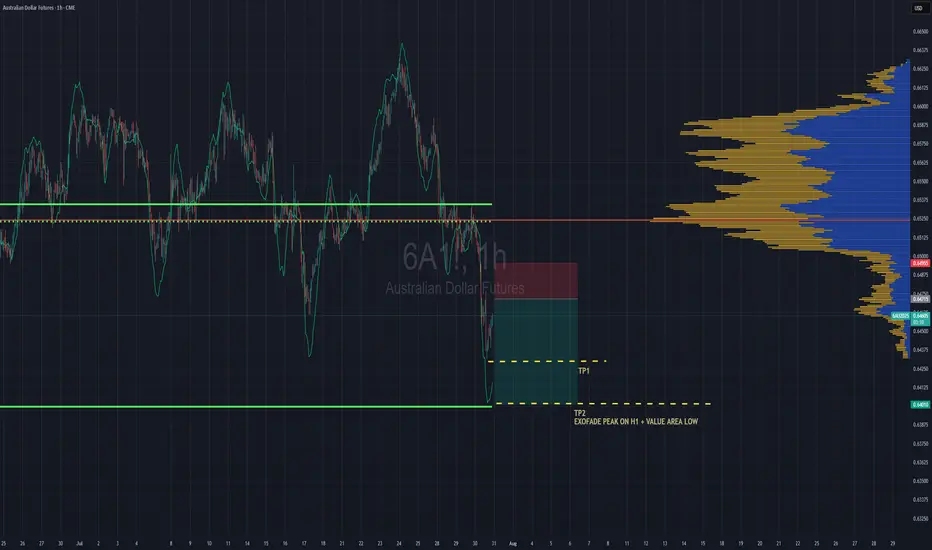
Aussie Shorts Looks Promising This is a pullback trend trade anticipating trend continuation. Entry is based on LVN (low volume node) for entry. Also looking on the footprint chart there is a high volume node with -ve delta that was traded at 0.64715.
If the sellers return to defend that price then this pullback should give some strong rejection once we pierce the entry zone and send bulls packing.
TP1 - First swing low
TP2 - Value area low of the range, which also is in confluence with the ExoFade peak on the 1HR timeframe. ExoFade peaks always gets taken out in a strong trend, that's why i love using them as price targets for exits. ExoFade is free on Tradingview for those curious about it. Just search for it.
Trendanalyisis
AUDCHF expecting bullish contianution
OANDA:AUDCHF interesting structure, trend based analysis, here exepcting bullish continuation.
SUP zone: 0.52200
RES zone: 0.52900, 0.53200

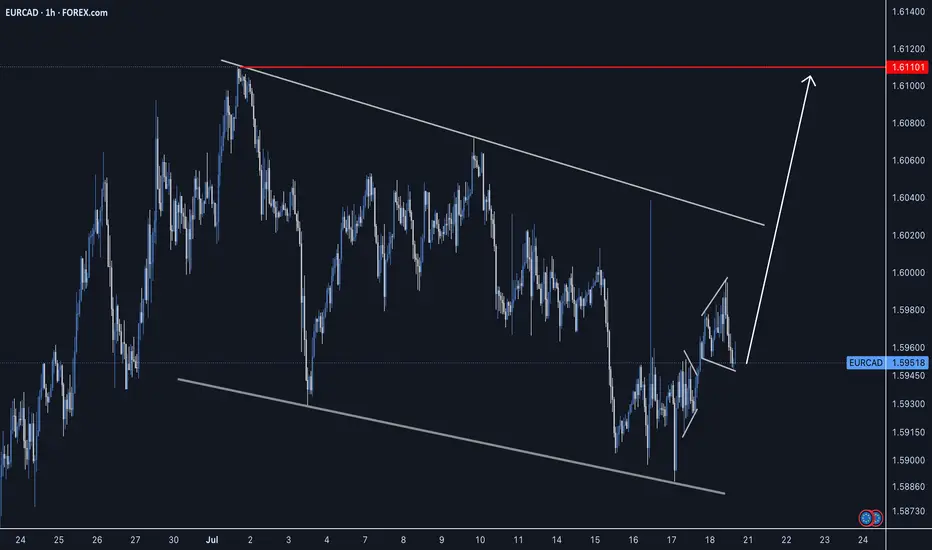
EURCAD - Long Setup - Impulse, Correction, ImpulsePrice action has been setting up for the next impulse phase as we can the bullish continuation is completing to indicate price has further growth. Looking for a long entry this upcoming week.
Good Luck
Fibonacci Retracement: The Hidden Key to Better EntriesIf you’ve ever wondered how professional traders predict where price might pull back before continuing... the secret lies in Fibonacci Retracement.
In this post, you’ll learn:
What Fibonacci retracement is
Why it works
How to use it on your charts (step-by-step)
Pro tips to increase accuracy in the market
🧠 What Is Fibonacci Retracement?:
Fibonacci Retracement is a technical analysis tool that helps traders identify potential support or resistance zones where price is likely to pause or reverse during a pullback.
It’s based on a mathematical sequence called the Fibonacci Sequence, found everywhere in nature — from galaxies to sunflowers — and yes, even in the markets.
The Fibonacci sequence is a series of numbers where each number is the sum of the two preceding ones, starting with 0 and 1. The sequence typically begins with 0, 1, 1, 2, 3, 5, 8, 13, and so on. This pattern can be expressed as a formula: F(n) = F(n-1) + F(n-2), where F(n) is the nth Fibonacci number.
The key Fibonacci levels traders use are:
23.6%
38.2%
50%
61.8%
78.6%
These levels represent percentages of a previous price move, and they give us reference points for where price might pull back before resuming its trend and where we can anticipate price to move before showing support or resistance to the trend you are following.
💡Breakdown of Each Fib Level:
💎 0.236 (23.6%) – Shallow Pullback
What it indicates:
Weak retracement, often signals strong trend momentum.
Buyers/sellers are aggressively holding the trend.
Best action:
Aggressive entry zone for continuation traders.
Look for momentum signals (break of minor structure, bullish/bearish candles). Stay out of the market until you see more confirmation.
💎 0.382 (38.2%) – First Strong Area of Interest
What it indicates:
Healthy pullback in a trending market.
Seen as a key area for trend followers to step in.
Best action:
Look for entry confirmation: bullish/bearish engulfing, pin bars, Elliott Waves, or break/retest setups.
Ideal for setting up trend continuation trades.
Stop Loss 0.618 Level
💎 0.500 (50.0%) – Neutral Ground
What it indicates:
Often marks the midpoint of a significant price move.
Market is undecided, can go either way.
Best action:
Wait for additional confirmation before entering.
Combine with support/resistance or a confluence zone.
Useful for re-entry on strong trends with good risk/reward.
Stop Loss 1.1 Fib Levels
💎 0.618 (61.8%) – The “Golden Ratio”
What it indicates:
Deep pullback, often seen as the last line of defense before trend reversal.
High-probability area for big players to enter or add to positions.
Best action:
Look for strong reversal patterns (double bottoms/tops, engulfing candles).
Excellent area for entering swing trades with tight risk and high reward.
Use confluence (structure zones, moving averages, psychological levels, Elliott Waves).
Wait for close above or below depending on the momentum of the market.
Stop Loss 1.1 Fib Level
💎 0.786 (78.6%) – Deep Correction Zone
What it indicates:
Very deep retracement. Often a final “trap” zone before price reverses.
Risk of trend failure is higher.
Best action:
Only trade if there's strong reversal evidence.
Use smaller position size or avoid unless other confluences are aligned.
Can act as an entry for counter-trend trades in weaker markets.
Stop Loss around 1.1 and 1.2 Fib Levels
⏱️Best Timeframe to Use Fibs for Day Traders and Swing Traders:
Day trading:
Day traders, focused on capturing short-term price movements and making quick decisions within a single day, typically utilize shorter timeframes for Fibonacci retracement analysis, such as 15-minute through hourly charts.
They may also use tighter Fibonacci levels (like 23.6%, 38.2%, and 50%) to identify more frequent signals and exploit short-term fluctuations.
Combining Fibonacci levels with other indicators such as moving averages, RSI, or MACD, and focusing on shorter timeframes (e.g., 5-minute or 15-minute charts) can enhance signal confirmation for day traders.
However, relying on very short timeframes for Fibonacci can lead to less reliable retracement levels due to increased volatility and potential for false signals.
Swing trading:
Swing traders aim to capture intermediate trends, which necessitates giving trades more room to fluctuate over several days or weeks.
They typically prefer utilizing broader Fibonacci levels (like 38.2%, 50%, and 61.8%) to identify significant retracement points for entering and exiting trades.
Swing traders often focus on 4-hour and daily charts for their analysis, and may even consult weekly charts for a broader market perspective.
🎯 Why Does Fibonacci Work?:
Fibonacci levels work because of:
Mass psychology – many traders use them
Natural rhythm – markets move in waves, not straight lines
Institutional footprint – smart money often scales in around key retracement zones
It's not magic — it's structure, and it's surprisingly reliable when used correctly.
🛠 How to Draw Fibonacci Retracement (Step-by-Step):
Let’s say you want to trade XAU/USD (Gold), and price just had a strong bullish run.
✏️ Follow These Steps:
Identify the swing low (start of move)
Identify the swing high (end of move)
Use your Fibonacci tool to draw from low to high (for a bullish move)
The tool will automatically mark levels like 38.2%, 50%, 61.8%, etc.
These levels act as pullback zones, and your job is to look for entry confirmation around them.
🔁 For bearish moves, draw from high to low. (I will show a bearish example later)
Now let’s throw some examples and pictures into play to get a better understanding.
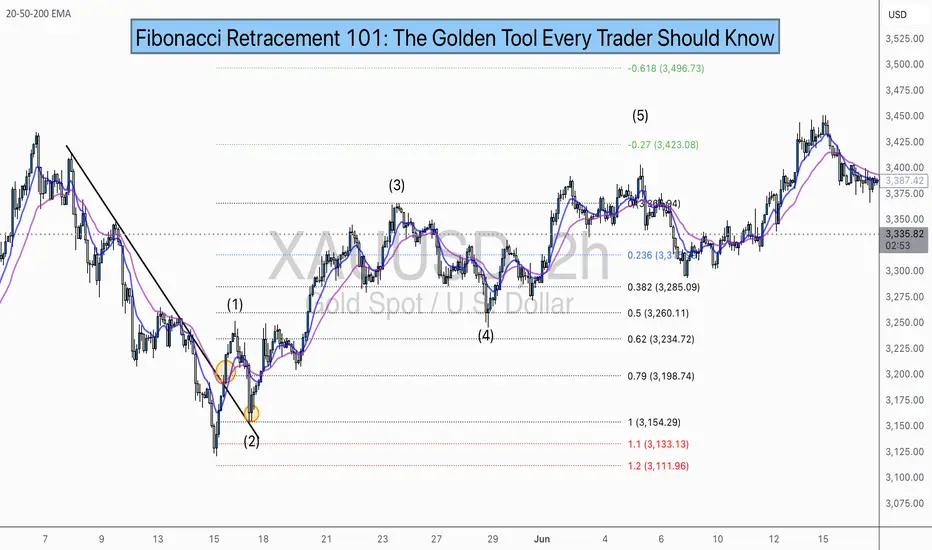
📈 XAU/USD BULLISH Example:
1.First we Identify the direction of the market:
2.Now we set our fibs by looking for confirmations to get possible entry point:
Lets zoom in a bit:
Now that we have a break of the trendline we wait for confirmation and look for confluence:
Now we set our fibs from the last low to the last high:
This will act as our entry point for the trade.
3. Now we can look for our stop loss and take profit levels:
Stop Loss:
For the stop loss I like to use the fib levels 1.1 and 1.2 when I make an entry based upon the 0.618 level. These levels to me typically indicate that the trade idea is invalid once crossed because it will usually violate the prior confirmations
Take Profit:
For the take profit I like to use the Fib levels 0.236, 0, -0.27, and -0.618. This is based upon your personal risk tolerance and overall analysis. You can use 0.236 and 0 level as areas to take partial profits.
Re-Entry Point Using Elliott Waves as Confluence Example:
This is an example of how I used Elliott Waves to enter the trade again from the prior entry point. If you don’t know what Elliott Waves are I will link my other educational post so you can read up on it and have a better understanding my explanation to follow.
After seeing all of our prior confirmations I am now confident that our trend is still strongly bullish so I will mark my Waves and look for an entry point.
As we can see price dipped into the 0.38-0.5 Fib level and rejected it nicely which is also in confluence with the Elliott Wave Theory for the creation of wave 5 which is the last impulse leg before correction.
🔻 In a downtrend:
Same steps, but reverse the direction — draw from high to low and look to short the pullback.
XAU/USD Example:
As you can see the same basic principles applied for bearish movement as well.
⚠️ Pro Tips for Accuracy:
✅ Always use Fib in confluence with:
Market structure (higher highs/lows or lower highs/lows)
Key support/resistance zones
Volume or momentum indicators
Candle Patterns
Elliott Waves, etc.
❌ Don’t trade Fib levels blindly — they are zones, not guarantees.
📊 Use higher timeframes for cleaner levels (4H, Daily)
💡 Final Thought
Fibonacci retracement doesn’t predict the future — it reveals probability zones where price is likely to react.
When combined with structure and confirmation, it becomes one of the most reliable tools for new and experienced traders alike.
🔥 Drop a comment if this helped — or if you want a Part 2 where I break down Fibonacci Extensions and how to use them for take-profit targets.
💬 Tag or share with a beginner who needs to see this!
Elliott Wave Analysis of Kirloskar Brothers KIRLOSBROSThe script is currently in 4th wave of hourly chart. The 4th wave seems to be ending, which means a 5th wave will start from here. The wave patters and patterns, retracements and analysis have been highlighted on the chart. Will update this as it progresses.

GBPUSD bearish continuation for expect
FX:GBPUSD strong bearish pushing, we can see BEARISH FLAG pat and trend line breaked, here still strong bearish to expect till TPs.
SUP zone: 1.35500
RES zone: 1.33850, 1.33400

GBPCAD bearish for expect
OANDA:GBPCAD last 4 ideas on this pair attached, we are have one strong fall, price is make few pushes on sup zone (violet doted), which taking for legal zone, currently price in ASCENDING TRIANGL better visible on 15TF (will make in note), expecting break of same and higher bearish continuation.
SUP zone: 1.85750
RES zone: 1.84500

80k BTC On The Move - WHAT It Means 80,000 BTC Wallet Movement (2011 Miner)
• Source: 8 wallets containing 10,000 BTC each — mined in 2011, dormant for 14 years
• Total Value: Over $8.6 billion USD
• Timing: Moved on July 4, 2025 — largest dormant BTC transfer in history
• New Addresses: Funds moved to modern SegWit wallets
• Probable Owner: Likely a single early miner with 200k+ BTC history
Possible Reasons for the Move
• Key Rotation: Upgrading to modern wallets for better security
• Recovered Access: Private keys may have been recently recovered
• Market Strategy: Positioning for profit-taking or major sell-off
• Yield Farming: Preparing COINBASE:BTCUSD for use in DeFi/lending platforms
• Collateral Use: Possibly for loans, stablecoin leverage, or RWAs
• Estate Planning: Legal restructuring or generational wealth setup
• OTC Transfer: Could be prepping for off-exchange institutional sale
• Psychological Warfare: Could be intended to spook or manipulate the market
• Regulatory Response: Aligning with new compliance or tax jurisdiction
Market Reaction
• COINBASE:BTCUSD Price Dip: Price briefly fell below $108,000 post-move
• ETF Context: Movement occurred despite record ETF inflows
Key Note: These wallets had not been touched since COINBASE:BTCUSD was worth ~$0.78. Their reactivation adds uncertainty and opportunity in a fragile macro environment.
• What to do????: Watch the orderbook to find these large bitcoin moves in case of exchange selling
Near term support & resistance
$106000 support
$109500 first resistance
👍 If this breakdown helped your trading, smash that Like and drop a comment below—let me know what you think will happen with the 80k COINBASE:BTCUSD . 👍
Best Reguards
MartyBoots, 17-year market trader

MACRO 3-Drive Pattern on Bitcoin | Major Reversal Ahead?Is Bitcoin completing a massive 3-drive structure on the macro chart?
Three clear pushes higher, each with fading momentum, are flashing a major reversal signal.
This could be the final phase before a long-term shift — are you ready for what’s next?
📚 3-Drive Structure Trading Strategy — Full Breakdown
The 3-Drive Pattern is a powerful reversal-based price structure used to spot major turning points in trending markets. It works by identifying three consecutive drives (or pushes) in one direction, typically ending with exhaustion and a high-probability reversal.
Each drive forms a new high or low, but with weakening momentum — especially visible using RSI, MACD, or volume divergence.
🔍 What is the 3-Drive Pattern?
3 consecutive higher highs (or lower lows)
Each drive followed by a shallow pullback
Momentum weakens on each push (divergence forms)
Fibonacci symmetry often present:
- Drive extensions: 127.2%–161.8%
- Pullbacks: usually 61.8%
📉 Bearish 3-Drive (Reversal from Uptrend):
Drive 1: Price makes a higher high with strong momentum
Drive 2: Another higher high, weaker strength
Drive 3: Final high with clear divergence
Reversal: Entry when price breaks below structure
🎯Entry Criteria:
Wait for all 3 drives to form
Confirm with divergence on Drive 3
Use a confirmation candle or structure break
Stop-loss: just beyond the 3rd drive’s high
🎯 Targets:
Conservative: Return to Drive 2 base
Aggressive: Full trend reversal (50%–100% Fib retracement)
🧠 Pro Tips:
Best on 4H, 1D, 3D or 1w timeframes
Confirm with RSI, MACD, or volume divergence
Combine with key S/R or supply-demand zones
💡 Summary:
The 3-Drive pattern is one of the most reliable reversal structures when combined with divergence and Fibonacci symmetry. It's especially powerful at market exhaustion zones and works best with confirmation-based entries.

Exact Entry Levels & Profit Potential (July 3, 2025)🎯 Market Structure Breakdown – Exact Entry Levels & Profit Potential (July 3, 2025)
📊 In today’s session, I revisit the market for the second time – and you’ll see why I’m ruling out some setups altogether. There’s value in looking twice. What did I miss earlier? It's all in the structure.
I break down price action step by step, highlight precise entry zones, and show where the real potential for movement lies. Clean levels, no guessing.
⚠️ Note: I don’t trade the first 10 seconds – all orders are placed after 9:30:10 and I'm looking for entries only until 11:30:00.
👉 Check out the full breakdown and stay ahead of the game.
NASDAQ:AMZN
NYSE:ANET
NASDAQ:AVGO
NYSE:BA
NASDAQ:COIN
NASDAQ:CZR
NYSE:DELL
NASDAQ:GOOG
NASDAQ:MSFT
NASDAQ:AMD
NASDAQ:RKLB
NASDAQ:SBUX
NASDAQ:SMCI
NYSE:VRT
NASDAQ:NVDA

Daily Outlook | XAUUSD June 30, 2025Hey traders,
Fresh week, clean structure. Let’s lock in the key levels and let price do the talking.
🌐 Macro Context
It’s a heavy week for USD – all major data drops before Friday:
Tuesday: ISM Manufacturing + Powell speaks
Wednesday: ADP Employment
Thursday: NFP, Unemployment Rate, ISM Services
Friday: US holiday – markets closed
📌 This means liquidity will build into Thursday, then fade. Expect gold to stay range-bound early in the week, unless momentum shifts hard today. Volatility should peak around NFP.
🧭 Daily Structure & Bias
Gold opened weak under 3287, still below 21EMA and 50EMA. The structure shows lower highs, bearish control, and no signs of strength reclaiming ground. RSI is at 42 — momentum down, but not oversold yet. Unless price breaks back above 3340, sellers stay in control.
✅ D1 Bias: Bearish while under 3340
📌 Key D1 Zones to Watch
🔺 D1 Breaker Block – 3340–3355
Former support, now clean resistance. Includes 50EMA and last failed closes. If price rejects again here, bearish continuation likely. A daily close above 3355 flips short bias.
🔺 D1 Supply + FVG – 3385–3405
Unmitigated imbalance from early June. If price pushes through 3355, this is the next upside magnet. Good spot for first reaction.
⚖️ D1 Decision Zone – 3287–3265
Current price zone. Multiple past reactions. A daily close below 3265 confirms breakdown. Holding above = more choppy range.
🟢 D1 Reaction Shelf – 3210–3180
Minor support zone from April candle bodies. Can slow price, but not strong enough for reversal on its own.
🟢 D1 Demand Block – 3155–3120
First major HTF demand. Includes 200EMA, strong structure, and previous breakout base. If price sells into it fast, watch for rejection — but only with confirmation.
🟢 D1 Macro Demand – 3090–3055
Final line of macro defense. Clean imbalance + demand from February. Valid only if sentiment breaks post-NFP.
✅ Final Summary
• Below 3265 = structure breaks → opens 3180
• 3155–3120 = real support zone
• Below 3120 = macro shift risk
• Reclaiming 3340 = short bias invalid
• Break above 3385 = continuation possible
📌 Today is all about the close. No confirmation = no trade. Thursday is the real trigger — be positioned, not exposed.
—
📣 If this gave you clarity and structure, drop a 🔥, share your bias, and follow GoldFxMinds for sniper plans with zero fluff — only clean, confirmed price action.

XAUUSD - High possibility of volatile market opening (20250616)Well, it is quite obvious we have a volatile geo-political crisis this weekend, so market may overreact once again to bring Gold to at least 3500 opening.
Looking at volume, though Gold is in uncharted territory and it can be move as high as 3550 - 3600, I rather play for a quick profit.
Hope later this Sunday, we can find some positive news that can at least hold the surge of Gold to minimum.
Trade safe, Trade wisely. Monday will be a very volatile opening.
USDJPY higher bullish for exepct
FX:USDJPY PA based analysis, price is bounce few times on bottom line of PA, last we have bullish push with short revers till zone 144.000, which taking here for sup zone from which expecting higher bullish continuation.
Technicalls are here same strong bullish for expect
SUP zone: 144.000
RES zone: 146.900

PYPL: Strong Resistance Zone in Play – Watch 73.34 for EntryNASDAQ:PYPL is showing a potential triple top formation near the 73 level. If price breaks above the 73.34 resistance , there's room to move toward 74.15 – a medium-term swing high.
💡 Trade idea: Enter 1 tick above 73.34, set your target and SL based on the 5-minute chart.

THE KOG REPORT THE KOG REPORT
In last week’s KOG Report we said we would be looking for price to attempt the high, fail and make the move downside. This worked well in the early part of the week giving traders a fantastic capture for the short trade into the red box target levels which were all complete. During the week we update trades with the plan to long, and although there was a break from the red box, our lower red box bounced price giving the long trade completing the move.
It was only towards the end of the week where we started ranging that we only managed to capture short scalps on the upside move before the suggesting we call it a day, thankfully before the small decline from the level.
So, what can we expect in the week ahead?
We have a key level here of 3310-6 which has been a previous pivot in this range and is holding price down at the moment. This now make a crucial support region forming at the 3280-5 level with extension of the move into 3275. If this level holds and the red box reacts, we can see price push up from here and attempt to target the 3400 level again, which is towards the top of the range.
It’s this lower red box that needs to be watched for the break, as a break here will target the 3250-55 region initially and then go for the potential swing low around the 3210-2- region which in this scenario maybe the ideal long trade.
As always, we’ll update traders through the week with our analysis and red box target levels but for now, let’s see if we gap on open. Please remember, the market gaps with intention, the intention is usually to get traders in chasing the gap as soon as they see immediate exhaustion, this hardly ever works on gold and BTC especially. We’ve back tested the stretch, so please play caution on chasing gaps.
More choppy and ranging price action expected!
KOG’s bias of the week:
Bullish above 3285 with targets above 3306, 3310, 3321 and 3335
Bearish below 3285 with targets below 3267, 3255 and 3240
RED BOXES:
Break above 3290 for 3297, 3306, 3310, 3320 and 3330 in extension of the move
Break below 3280 for 3277, 3270, 3267 and 3255 in extension of the move
Many of our followers and traders have seen the power of the red boxes, Imagine this on your own TV screen, 4H for swing trading, 1H for day trading and 15min for scalping. Any pair on any chart 23hrs a day. Add to that the Knights indicator giving you swing points, key levels and retracement levels and our custom volume indicator telling you when to long, when to short and when to stand back from your trades.
LEARN AND GENERATE YOUR OWN SIGNALS. You don't need any of us to guide you.
KEY LEVEL 3237!
Please do support us by hitting the like button, leaving a comment, and giving us a follow. We’ve been doing this for a long time now providing traders with in-depth free analysis on Gold, so your likes and comments are very much appreciated.
As always, trade safe.
KOG

Bitcoin's Breakout Fizzles: Is a Major Reversal in Play...?Bitcoin Technical Analysis – In-Depth Breakdown
Over the past two months, Bitcoin has exhibited a strong bullish trend, appreciating by approximately 51%. The sustained rally was primarily driven by bullish momentum, increased investor confidence, and broader market sentiment.
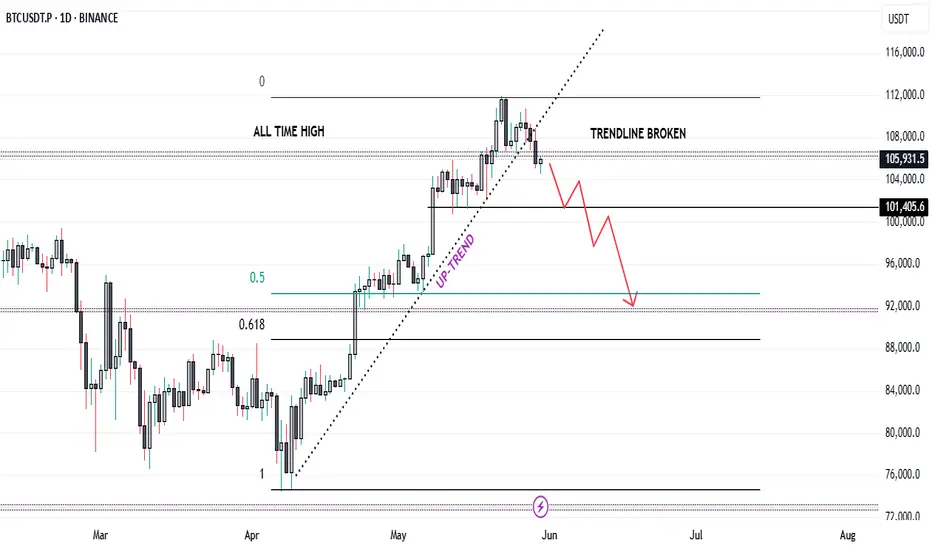
Recently, Bitcoin broke through its all-time high (ATH) of 106,500, surging to a new peak near 112,000. However, this breakout was short-lived as the price failed to sustain above this level, indicating significant profit-taking activity by traders and long-term holders. This inability to hold the ATH region highlights a potential liquidity pocket where sell orders accumulate, resulting in a rejection wick and a subsequent reversal.
From a Technical perspective:
The price has now fallen back below 106,500, turning this key level into a major resistance zone. Historically, once a strong resistance level (like an ATH) is breached and subsequently reclaimed, it often acts as a formidable barrier to upward price movement unless there’s renewed bullish momentum.
Additionally, Bitcoin has broken its ascending trendline (drawn from the lows of the uptrend) and has already retested this trendline from below. The retest was successful in confirming the breakdown, which further strengthens the bearish bias.
The price structure is now forming a potential lower high pattern near the 106,500 resistance. This could signal a shift in market sentiment from bullish continuation to consolidation or correction.
In terms of market psychology, the all-time high region represents a crucial psychological barrier. Traders and investors often exhibit heightened caution near such levels. Many choose to lock in profits due to fear of a double top or a false breakout. This behavior can create increased volatility, especially when combined with institutional and retail order flows.
Trading Strategy and Risk Management
Given the technical breakdown and the psychological factors at play:
✅ A short position can be considered, particularly around the 106,500 resistance, with confirmation from the trendline retest.
✅ However, exercise caution due to the high volatility typically observed near ATH levels. Whipsaws and fakeouts are common as both bulls and bears battle for control.
✅ Avoid high-leverage positions unless you have a strict stop-loss in place. Ideally, place the stop-loss just above the 106,500 - 107,000 zone, where a decisive breakout would invalidate the short setup.
✅ For profit targets, initial supports are seen around 100,000 - 98,000, and a deeper correction could test the 94,000 - 92,000 zone.
✅ Wait for clear confirmation, such as a strong bearish candle on the retest of the resistance, before entering the trade.
THE KOG REPORT Bank Holiday tomorrow so we'll keep it simple and update the KOG Report on Tuesday ready for the week ahead. Please have a look at the last few KOG Reports to see how it went, wasn't a bad week at all.
This week, immediate red boxes are on the chart, there is a red box active above and the indicator is suggesting a potential retracement on the move. So we'll look for price to attempt the high, if failed we can expect the move downside into the order region where we may settle.
RED BOXES:
Break above 3365 for 3370, 3376, 3381, 3390 and 3403 in extension of the move
Break below 3350 for 3343, 3335, 3330, 3323 and 3310 in extension of the move
Please do support us by hitting the like button, leaving a comment, and giving us a follow. We’ve been doing this for a long time now providing traders with in-depth free analysis on Gold, so your likes and comments are very much appreciated.
As always, trade safe.
KOG

Pimp Your Indicators – A Smoothed Take on RSIYou don’t need to reinvent the wheel to find new and effective trading tools. Often, enhancing classic indicators with a few thoughtful modifications can yield surprisingly powerful results. Here’s a simple yet effective way to upgrade the RSI and turn it into a more actionable entry signal.
The Relative Strength Index (RSI) is a widely used oscillator that ranges from 0 to 100, providing a measure of upside momentum within a given timeframe. For example, an RSI reading of 60 implies a 60% upside dominance based on recent price action. Traditionally, traders interpret levels above 70 as overbought and below 30 as oversold. However, RSI on its own isn’t reliable as a standalone entry trigger. An overbought reading doesn’t necessarily mean the market is losing strength—it simply indicates recent data reflects a strong upward move.
Smoothed RSI Approaches
To extract more useful signals, we can enhance the RSI in a couple of simple but effective ways:
1. RSI vs. RSIMA (RSI Moving Average):
One approach is to smooth the RSI itself by calculating a moving average of the RSI (call it RSIMA), and then observe the difference between the RSI and its moving average. A positive difference suggests bullish momentum; a negative one, bearish. This approach reduces some noise but can still result in a choppy indicator, as seen in the subplot of the reference chart.
2. RSI on Smoothed Price (RSI5M):
A more refined method involves smoothing the price before calculating RSI. Specifically, apply a 5-period EMA (Exponential Moving Average) to the price series, then compute the RSI on this smoothed series—let’s call it RSI5M. The key insight is to then analyze the difference between RSI5M and the standard RSI. This difference creates a smoother, more robust signal that better captures market bias.
Why It Works
In uptrends, the EMA(5) smooths out short-term fluctuations and highlights the prevailing trend more clearly than raw price data. As a result, RSI5M tends to rise faster and higher than the standard RSI. The difference between the two becomes positive in uptrends and negative in downtrends, making it a useful gauge of directional momentum. This effect is illustrated in the lower subplot of the reference chart, where the smoothed signal offers a clearer view of market regimes.
Ready-to-Use Script
If you're not into coding, you can explore the public script of the Parsifal.RSI.Trend indicator on TradingView. It implements a slightly refined version of this smoothed RSI differential and provides a clean visual cue for trend bias.

GOLD → this Week key area !**BULLISH SCENARIO**
Gold on monday making new support area on H4.
so if it break 3,290.00 will continue bullish nearest target is 3,378.00
**BEARISH SCENARIO**
if price reject on 3,264.00 GOLD will turn to bearish
Best Regard, Prafi

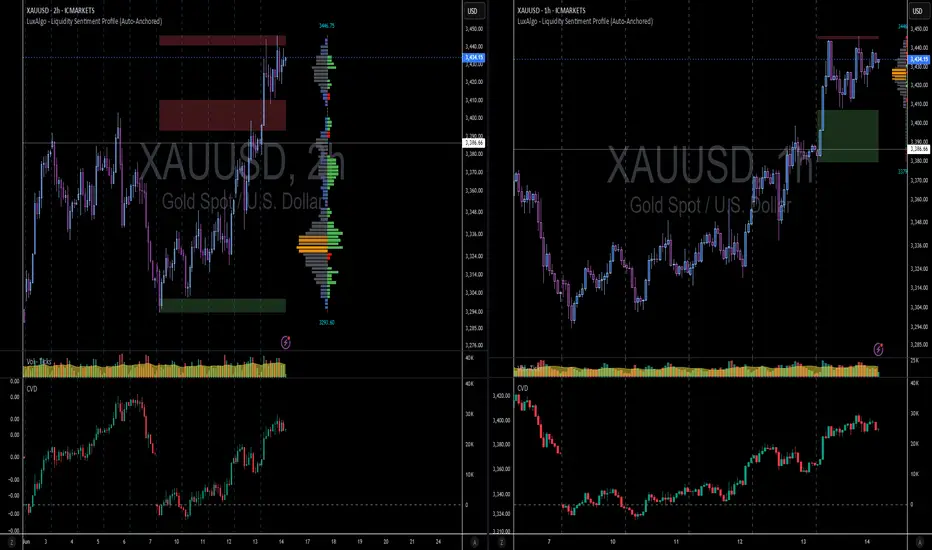
A little bit of tiny help that offer great resultsprnt.sc
As always I based my charting on trend following method, but knowing where the exhaustion is crucial in helping when to take profit or make a sniper entry.
As I always rely on periodic Volume Profile, recently I switch to using Luxalgo Liquidity and Sentiment Profile. For timeframe 30 mins and lower, I used the fixed range with a total of bars per timeframe as my range. For 1 hour and 2h, I will used the weekly setup.
So far it brings great combination results. Check above link for my current open trade.
XAUUSD UPDATE : FED INTEREST RATE DECISION hello & happy weekend everyone
For coming week trade forecast. From the left side, the daily chart indicates that a breakout has occurred, and the current increase is a temporary pullback. If a rejection happens at the 0.236 daily retracement and the trendline on 1 hour chart successfully pushes the price downward, I see an opportunity to short towards the upcoming Fed interest rate decision.
And I am very grateful for the support given, especially in some of the previous trades. I hope that my trade plan can help traders identify the direction to enter the market.
good luck all
**My trading strategy is not intended to be a signal. It's a process of learning about market structure and sharpening my trading my skills also for my trade journal**
Thanks a lot for your support

AT&T I Tipping Point : Short Opportunity with Head & ShouldersHey traders after a previous trade trade on the hood hitting targets of 16.4%. Today I bring you NYSE:T
Technical + Fundamental View
Pro Tip
- Breakdown below the Entry Line will be considered at Trade Initiation. (Risky Traders)
R:R= 5.4
- Rest can follow entry at day close post breakdown SL above Entry Candle.
- The Breakdown Below the Entry Line will confirm the head and shoulder pattern
Entry Line - 26.93
Stoploss - 27.53
Target 1 - 25.59 (Neckline of head and shoulder)
Target 2 - 24.74
Target 3 - 23.68
Technical View
- Head And Shoulder on Daily Time frame
- On the hourly timeframe, the chart looks weak, showing a potential double top pattern where the second peak is lower than the first, indicating growing investor fear.
Fundamental View
- High Debt: Over $140 billion in debt limits investment capacity and consumes significant cash flow.
- Network Issues: Poor service quality and outages risk losing customers to competitors.
- Strong Competition : T-Mobile and Verizon offer better plans, making customer retention harder.
- Market Saturation: The U.S. wireless market is nearly saturated, limiting new customer growth.
- Execution Risks: Growth and debt reduction depend on flawless asset sales and network upgrades; delays could harm finances and stock performance.
Additional Considerations
- AT&T’s valuation is higher than some peers, potentially capping upside.
- Telecom market competitiveness means growth hinges on successful 5G and fiber rollouts.
- Dividend yield (~3.9%) is attractive but lower than some rivals, which may impact income investors.

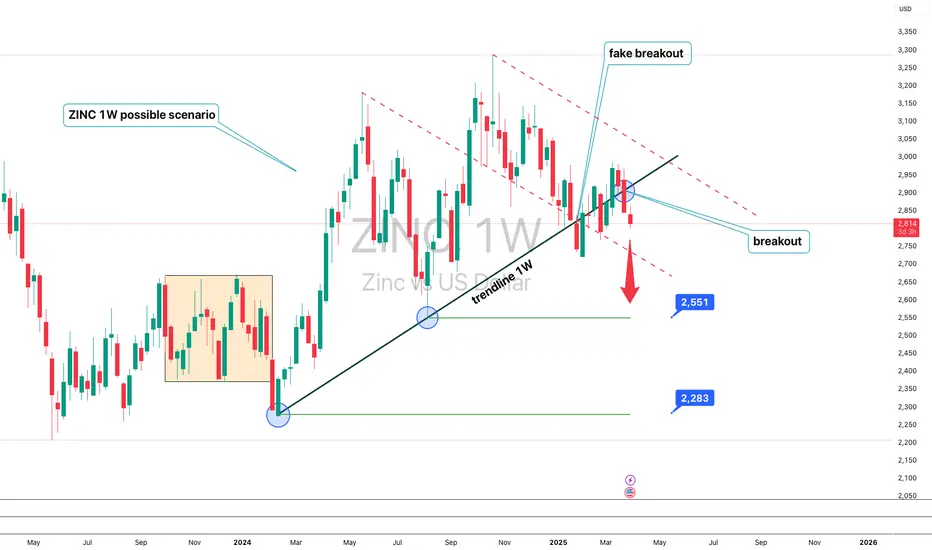
Zinc (ZINC) – Technical Analysis 1WThe price has broken below the 1W trendline, confirming a bearish scenario. After a fake breakout, the price moved downward and is now targeting 2551 and 2283. A breakdown below these levels could accelerate the decline. RSI shows weakening momentum, MACD signals a bearish crossover, and EMA 50/200 suggest further downside. Fundamentally, zinc prices depend on industrial demand, macroeconomic conditions, and USD strength. The main scenario is a drop to 2551 and 2283, while a recovery above 2900 could push prices toward 3100.