SPX: A Pullback in a Bull Trend.• The SPX is correcting today, however, it is still above the 4,100, indicating some strength;
• If the index drops more, and loses yesterday’s low, we might see a sharper correction. Probably the SPX would lose the 21 ema in this scenario;
• For now, it seems the bulls are in control, despite the pullback. As long as the index remains above the 4,100 / 21 ema, the gap at 4,218 is still our target;
• The index is correcting, but there’s no clear bearish reversal structure on it yet pointing to a real reversal. I’ll keep you updated on this.
Remember to follow me to keep in touch with my daily analyses!
Trendanalyisis

USDCAD Bearish view USDCAD looks a good sell from 1.34650 with strict resistance zone of 1.34810 and target expecting is 1.33100

EURGBPHi I'm still learning about market structure and trend analysis, based on what I've observed on EURGBP chart, as a SMC student, there might be a short trade. based on RSI on the monthly chart there seems to be a divergence happening.
Share your thoughts on the comment below on what do you think of EURGBP chart will look like.

TESLA: Buy the dip Strategy in short-medium termHi everyone!
At the moment the Tesla's main trend is bearish, but at the same time, if we look at intraday charts, such as 1h time frame, we see a clear bearish structure (12345) under development. After its completion we expect an important technical rebound which should push the price into the $140 area. From next week we will go looking for wave 5 level and start taking long positions.
💖 Support our idea with your Like & Comment, thank you! 💖

Emerged of Buying Interest!The candlestick indicates a significant price movement where the price closed above the MA line backed by high volumes due to fresh buying interest on the stock.
The MACD indicates a divergence signal, hence, confirming the price movement to the next price resistance.
The RSI is in positive momentum due to emerged of buying interest on the stock.
Let's save XINHWA in the WL and watch out for significant price movement backed with volume toward the next price resistance.
R 0.275, 0.300
S 0.240

TSLA: Fantastic Reaction. 👍• TSLA is doing an important reaction, as it is trying to reject the Dark Cloud Cover candlestick pattern, our top sign from Monday;
• This top sign wasn’t completely rejected yet, but even if TSLA resumes the drop, there are many support levels to hold the price;
• The first support is the $154, then the gap area around $146. What’s more, there is the 21 ema, which is ascending right now;
• A pullback to any of these support levels could be an opportunity to buy at a cheaper price;
• The key resistance is the $182.50. If TSLA breaks the $182.50, then our next resistance level is the $200;
• I’ll keep you updated on this, as usual.
Remember to follow me to keep in touch with my daily analyses!

A Strong Uptrend Pattern!The daily and weekly candlesticks indicate a positive trend. Hence, a strong uptrend pattern backed by large volume confirms the uptrend movement towards the price resistance R1.
MACD indicates a positive outlook, hence, confirming the price uptrend.
Precaution for a price correction between 5%-10% from the recent price with a minimum volume being transacted.
Let's save EKOVEST in WL and watch out for significant price movement after the price correction towards R2.
R 0.435, 0.490
S 0.365

GBPUSD above support, more growth expected if breaks above zoneGBPUSD
price is holding above the support area, if price continue to hold above the support structure, I expect the price to move higher towards next resistance.
Trade Wisely
*The content on this analysis is subject to change at any time without notice, and is provided for the sole purpose of assisting traders to make independent investment decisions.

AXS/USDT - (LOOKING BEARISH)axs/usd looking bearish technically
iam taking trade in axs at the price of 11.60$
chart patterns
harmonic patterns

Cardano bullish targetHey trader!
This analysis is based on a bullish result on Cardano. Behind the price is a strong bullish trend which is also indicated with a trend line. It is also seen that this strong trend has created some relevant support levels at 0.3631 , & 0.3262 . The trend progresses with some peaks followed by pullbacks. This development shows that the price is between a support level ( 0.3631 ) and a resistance level ( 0.3807 ). This indicates a so-called "calm before the storm", as it is an opportunity for the price to break the resistance level and create a new support. This development will mean that the price can possibly follow the bullish trend up to the target at 0.4544 and create a nice return of as much as 21.13% .
I hope this analysis was instructive and that it can be used for further consideration of Cardano.

Cardano bullish triangleHey trader!
This analysis reviews a bullish breakout for the price of Cardano. Cardano has recently experienced a bearish trend since the all-time high at 3.1059 . However, a triangle formation has emerged which may indicate that the price will rise despite the recent move. The triangle is pointing a lot upwards and with other tools like Fibonacci it can be estimated that the price has the potential to rise to new highs, potentially to the resistance level at 0.5118 , as there are e.g. there are also some support levels at 0.2436 , 0.3043 , 0.3224 , which makes the price potential for a strong development.
I hope this analysis was instructive and that it can be used for further consideration of the direction Cardano should take in the future.

USDJPY | A Pullback Before The Sell-offThis analysis is based on the fact I'm a trend follower.
The setup of this pair is as simple as it can get. The first thing to notice is the ease of identifying the price in a downtrend. Secondly, the estimation zone can easily be plotted. Finally, there is no confusion about what price is done on the weekly or daily timeframe. This is what I love about the potential of placing a pending order(sell limit) on this pair. I'm aware that I am waiting for a pullback up to 131.829. The range price can push into is between 131.829 as high as 134.773. At 131.829 I am fighting for the best price.
My stop loss will be 134.773, and my take profit will be low from where the price will pullback. I don't see evidence of a pullback right now, so I'll wait to confirm my take-profit price. Assuming price may pullback from here my risk to reward on this trade idea is 1.64.
However, this is what a simple technical analysis looks like. At least, for my sake.
What is your take on this pair? I'd love to view your take on this currency pair. 😍
*These are my personal views. Please trade your views at your own risk.


USDJPY Long Term Predictions (4H Chart)Technical Analysis Summary
ETH/USDT
TREND ANALYSIS
We have 1 Downtrend in red color (Long Term).
We have 1 Uptrend in green color Internal Trend (Short Term)
Be careful trends need to be modified when broken to the new peaks(Downtrend) and lows (Uptrend).
FUTURE PREDICTIONS
We have many resistance and support levels that I have mentioned above.
I use thickness as an indicator of strength of levels (ONLY FOR VISUALS).
White levels Levels are very tight stop losses that could be used in high leverage future trading.
Good luck everyone, stay safe!
If you need help don't hesitate to send me a message or comment
If you find this content beneficial please don't forget to LIKE and FOLLOW
Trading Involves High Risk
Not Financial Advice
Exercise Proper Risk Management

Spaghetti paths for BTCBullish Scenario
Green spaghetti: If we hold the 20700 support, then upside to the monthly support at 23500 is likely. After that, we could blast through the low-volume range straight to 30k.
Neutral Scenario
White spaghetti: If we lose the 20700 support, we may drop down and touch the nPOC at 19500 (with weekly/VAL confluence) and see a bounce to retest the 20700 level.
Bearish Scenario
Red spaghetti (the least likely scenario IMO): If we lose the 18800 support, we will test the long-term trend line support and possibly drop down to touch the POC at 16900.

Groovey Ltc Fib ChartThought it would be cool to overlay the regular fib retracement over the fib circles.
This is just for a fresh look at something.
Happy Holidays to all!

Emerged of Buying Interest!The RSI indicates a positive outlook due to the emergence of buying interest from the previous trade. Hence pushed the price into a significant price movement backed by high volumes.
The MA13 crosses up the MA50 indicating a strong uptrend toward the next price resistance backed by the MACD indicator which indicates a divergence signal.
Let's save PEKAT in WL and watch out for significant price movement toward price resistance.
R 0.520
S 0.470

SPX Short and Long Term Trend Analysis 2023Summary: Short term Bull Trap and Long Term Bear Trap. Prices may move up or sideways for about a week but over the next month prices will move down to a previous support level. Investors are reallocating their profiles and they will also be digesting negative earnings report outlooks that consider the employment costs from higher interest rates in 2023. Unemployment indicators will be key over the next quarter much like CPI was last quarter. My time horizon for retirement is 30+ years so I will be Dollar Cost Averaging into cheap beaten down stocks like tech and auto, selling covered calls on overpriced stocks I own like energy, and hedging recession capitulation risk with puts.
Best Case: Recession canceled, SPX breaks it's long term 2022 downward trend similar to the DOW. Earnings and unemployment numbers remain decent in 2023. SPX breaks through the double top pattern at the January 2022 highs and makes new highs.
Positive Case: A bullish triangle pattern forms next week and the SPX continues up to form a long term double top pattern with the January 2022 highs and then trades sideways in 2023. Max SPX $4800.
Negative case: Earnings reports from major institutions and unemployment show how bad the economy is getting and the market sells off to continue SPX's downward trend. SPX forms another shoulder to an inverse head and shoulders reversal pattern seen on the Monthly Chart and trades sideways in 2023. Min SPX $3700.
Worst Case: The unemployment data and earnings reports trigger a financial crisis like 2008. The much anticipated capitulation Wall street is waiting for associated with 8 out of 10 recessions causes SPX to drop below March of 2020 lows.
Short Term Technical Indicators (Daily):
1. Volume profile shows more people willing to buy SPX at lower price levels then higher ones.
2. SPX is at the top of it's long term price channel trend from 2022.
3. SMA's indicate negative price movement.
4. MACD indicates positive price movement.
5. RSI indicates the SPX is overbought.
Long Term Technical Indicators (Monthly):
1. Volume profile shows more people willing to buy SPX at lower price levels then higher ones.
2. SPX is well above it's true mean logarithmic growth rate for a recession.
3. SMA's indicate negative price movement.
4. MACD indicates a return to normal bullish levels but is still quite positive from past recessions.
5. RSI indicates the SPX is oversold.
Fundamentals:
1. Consumer and investor sentiment has turned positive.
2. Inflation data is telling us that inflation has peaked and the Federal Reserve may pivot soon.
3. Earnings reports from large financial institutions who are all predicting recession in 2023 come out this week (Wildcard).
4. Unemployment may start to increase due to rising employment costs.

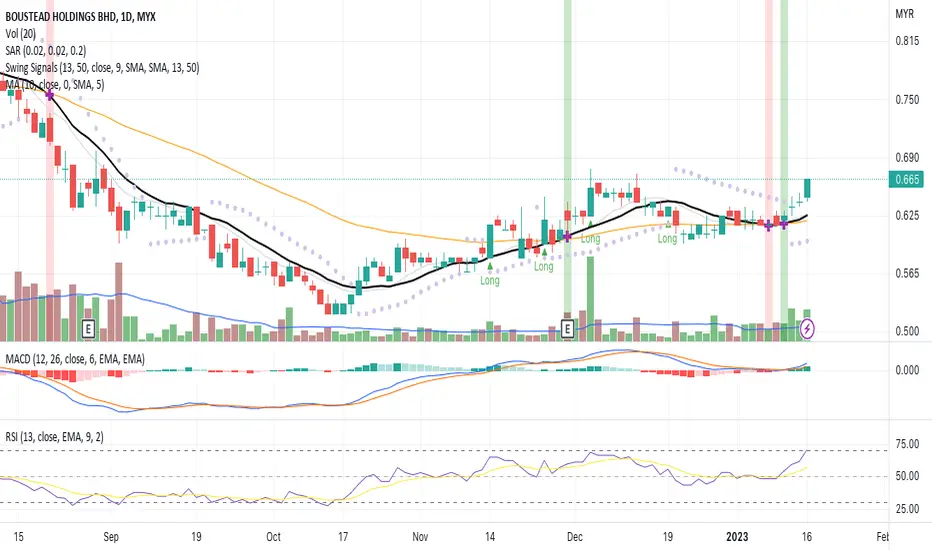
An Uptrend Momentum Pattern!The candlestick trend indicates an uptrend movement toward the next price resistance backed by continuous high volume on the previous trades.
The MACD indicates a divergence signal, hence, confirming the candlestick movement toward the next price resistance.
The RSI indicates a positive outlook due to fresh buying interest from the market.
R 0.675
S 0.620
Smells Like HopiumI don't post much; mostly I just watch and observe. But at this point in time, I cannot help my self. I'm seeing way too much joy and optimism in markets over the last few weeks. The smell of strong hopium in the air is pungent, especially in crypto. Lots of traders I follow are posting 10-12x posts a day talking about bullish action...lots of screams of "333% PUSH!", "555% EASY!", etc. etc. You know who you are.
Time for some real talk--crypto autumn is over and winter is just about to begin. Let's do the math...using "King Crypto" BTC as a guide.
Here we see the 2W chart and the story is clear. I like the 2W time frame as a starting point because if levels out all the BS and allows for clear headedness in lieu of what is obvious hysteria.
What are we seeing?
1. Heikin Ashi still points almostly perfectly bearish since the Nov 21 double top. This is a negative.
2. Current price action and all candles are below every channel there is, including KC and Bollinger Band Std Dev 1 and 2. This is super very negative.
3. 2W 50 per EMA is about to death cross 100 per EMA. That's EMA, folks...not simple MA. It will be very hard to see how the next 3 months won't have this cross, but we will wait and see. This is negative.
4. Stochastic has tried 4 times since Nov 21 to break favorable and has failed every time. Short term momentum still under longer term momentum, at the very bottom of the range. This is negative.
5. MACD, while approaching zero on the bars, is persistently below long-term trendlines. This is a negative.
6. On Balance Volume (the ultimate tell) is not even close to breaking favorable. This is negative.
Technical analysis, sorting out for all the short-term noise, is all pointing in one direction...downward.
From a macro-market analysis, we are just beginning to see the shakeout of the crypto hysteria. Some points:
A. Regulation, the "all clear sign" for big money, seems stuck in the muck across numerous geos, because...
B. Crypto firms continue to go bust at a rapid pace. Hard to know where to regulate when firms are dying every month. FTX is now "old news", but as yet nobody knows how far the contagion goes. BlockFi this week, likely another before the end of the month. And the "Binance Rescue Fund" (outside of a tweet) is a pipe dream.
C. The idea of BTC (or any crypto) as an inflation hedge or safe haven is fully disproven.
D. Crypto is now, minus higher variance, inexplicably tied to Tech. Yet even the media hyped, MOMO pushed, fake-out rally in QQQ didn't get to BTC over the last month.
E. Recession looms, corporate multiples are still insane, leverage is still too high (in markets, and especially crypto), and fundamental economic dynamics globally are not favorable.
All risk assets are still very far away from bottoms, crypto especially.
Smoke the hopium all you want, but don't hit that "Buy" button. Long way to go before we are out of the woods.
"Roll it up, light it up, smoke it up...Inhale, exhale" - Cyprus Hill.

The Value of PriceA basic concept in price action trading is that when it comes to the analysis process of price, some candles are more valuable than others.
By "more valuable" I mean, some candlesticks have more weight in the analysis process of price than others. Before I explain which candles
have more inherent value, let me explain a bit of price action philosophy.
When it comes to an asset's price, or even the market in general the price action trader believes that it is a living breathing entity.
Just the same as you and I, the market's movements differ from day to day and past behavior does not predict future behavior. That said,
just like you and I, the future behavior of an living breathing entity is much easier to predict if based on the analysis of recent behavior.
So in other words, if I were to predict your next move, it is much easier and practical to base that analysis on your recent behavior, rather
than your behavior 2 years in the past.
So this core philosophy pretty much dictates how you can set values to price. Simply put," Current price is more valuable than past price in
terms of the analysis process". So if you were to predict the future direction of the price of an asset, it is wise to analyze current price rather
than past price; simply due to the fact that past price has less weight in terms of the analysis process than current price.So for example,
if your analysis of price for the last 3 months was stating that price will rise in the future; however this week's price is stating that price will
fall, the price action trader will not hesitate to sell as dictated by their analysis of current price.
So the next time you find yourself confused about the future direction of price due to conflicting signals. Ask yourself, " what is current price
telling me about the future direction of price?" and let past price stay where it belong, "in the past."
That's it!
Have a great day!
Ken

EUR/USD: patiently waiting to pull the "BUY" trigger. No rush!Firstly, by zooming out and monitoring higher-timeframe graphs, we may observe that the sentiment of the EUR/USD market is clearly bullish as the price has managed to push above the level of the previous HTF Higher High point.
Last week, we expected for some correctional moves to kick in and drive the price down in the short run before further bullish resume. However, after consolidating for a while, the USD fundamentals were able to push the price higher and form a new HH point.
The price moves in cycles. In other words, step-by-step and not like a straight rocket. And thus, we are awaiting for the price to experience a short-term drop and reach the important area of support plotted on the graph that lines up with the 0.382 Fibonacci retracement level before we can execute long positions and ride the trend to the upside.

Can Nasdaq Make a Major Move in 2023?
Sharing my technical analysis on Nasdaq NASDAQ:NDX , sharing what the critical levels to watch, trend analysis, and potential trading opportunities are.
I hope you are enjoying the analysis. Do you agree with my analysis?
Follow, so you don't miss out on future technical analysis reviews.
