DOT / USDT 4H CHART - Targets and Stoploss!Hello everyone, let's look at the DOT to USDT chart on a 4-hour timeframe. As you can see, the price is moving in the uptrend channel indicated by the yellow lines.
Let's start with the support line and as you can see the first support in the near future is $6.69, if the support is broken then the next support is $6.50, $6.36 and $6.21.
Now let's move to the resistance line, as you can see the first resistance is $6.69, if you manage to break it, the next resistance will be $7.14 and $7.37.
Looking at the CHOP indicator, we see that we have a lot of energy for the next move, the MACD indicates a local uptrend, while the RSI has approached the upper end of the range, which may give an impending price rebound.
Trendanalyse

COTI / USDT 1D CHART - Resistance and SupportHello everyone, I invite you to review the COTI chart on a one-day interval. As we can see, the price failed to break the ongoing downtrend channel.
Let's start by marking the price support spots and we see that we first have support at $0.098, but if the price goes lower then we have another support at $0.089, then at $0.08, then we have a strong support zone from $0.067 to $0.05.
Looking the other way, we can similarly determine the places of resistance that the price has to face. And here we see that the price is currently moving towards the $0.11 to $0.12 resistance zone. We continue to have a strong resistance at $0.15, once the price breaks it it will move towards the resistance at $0.20.
The CHOP index indicates that we have a lot of energy for the next move, the MACD indicates that we are on the verge of entering an uptrend, while the RSI, after the last recovery, returns to the upper part of the range.

XRP - USDT on 1D interval Resistance and SupportHello everyone, I invite you to review the chart of XRP in pair to USDT, on a one-day timeframe. First, we will use the blue line to mark the downtrend from which the price has gone up, while locally, we can use the yellow lines to mark the downtrend channel that has not been broken at the moment.
Moving on, we can move on to marking support areas when we start a larger correction. And here, the first support is at $0.38, the second support is at $0.36, and then we have a strong support zone from $0.35 to $0.33.
Looking the other way, we see that the price has hit an important resistance zone from $0.40 to $0.43, which it failed to break. However, if it manages to exit the descending channel upwards and break through the resistance zone, the next resistance will appear at the price of $0.46, and then at the price of $0.50.
Please look at the CHOP index which indicates we still have a lot of energy for the next move, MACD indicates that we are in a downtrend, while the RSI could see a small increase but we are still staying at the lower part of the range.

Daily review of BTC interval 4HHello everyone, let's look at the BTC to USDT chart on a 4-hour timeframe. As you can see, the price has broken above the local downtrend line.
Let's start with the support line and as you can see the first support in the near future is $24587, if the support is broken then the next support is $24136, $23795 and $23429.
Now let's move to the resistance line, as you can see the first resistance is $25,112, if you manage to break it, the next resistance will be $25,636, $26,040 and $26,453.
Looking at the CHOP indicator, we see that the energy has been used, the MACD confirms the local uptrend, while the RSI has crossed the upper limit of the range, which indicates a needed price rebound.

XRP - USDT on 4H interval Targets and StoplossI invite you to review the XRP chart against USDT, taking into account the four-hour interval. First, we will use the yellow lines to mark the downtrend channel in which the price is moving.
Moving on, we can move on to marking the support areas when the price starts to reverse. And here in the first place we have a support zone from $0.38 to $0.37, when the price falls below this zone we have a second zone of strong support from $0.35 to $0.33.
Looking the other way, we see that the price has reached the resistance point at $ 0.39, which so far has no strength to break. However, if it manages to break out above, we have a second support at $0.40, then a resistance zone from $0.41 to $0.42, and then resistance at $0.43.
Please look at the CHOP index, which indicates that most of the energy has been used, the MACD indicates that we are moving in a local uptrend, while the RSI shows a significant increase and we are approaching the upper end of the range, where the price often has a rebound.

DOT / USDT 1D CHART - Resistance and SupportHello everyone, I invite you to review the DOT chart as its predecessors on a one-day interval. Please see that in this situation we can use the yellow line to mark the uptrend channel in which the price is moving.
Let's start by marking the support places for the price and we see that we have first support at $6.05, but if the price goes lower, we have another support at $5.67, then at $5.33, and another support at $5.33 $4.83.
Looking the other way, we can similarly determine the places of resistance that the price has to face. And here we see that there is a very strong resistance at $6.74, only when the price breaks it will it be able to move towards the resistance at $7.43.
The CHOP index indicates that we have a lot of energy for the upcoming move, the MACD indicates the continuation of the downtrend, while the RSI moves sideways in the middle of the range.

ETH - USDT, 1D Interval Resistance and Support I invite you to review the current situation on the ETH chart in pair to USDT, also on a one-day interval. In the first place, the yellow line can be used to mark the uptrend line that managed to keep the ETH price from falling further.
Now let's move on to marking the places of support. We will use the Fib Retracement tool to mark the supports, and as you can see we have the first support at $1472, the second support at $1395 and then we can mark the strong support zone from $1319 to $1211.
Looking the other way, we can also mark the places where the price should encounter resistance on the way to increases. And here we have the first very strong resistance at the price of $1666 which is the so-called golden point of 0.618 Fib, the next resistance is at the price of $1825 and then the third resistance at the price of $2032.
The CHOP index indicates that there is still some energy left for further movement. The MACD indicator remains in a downward trend. However, on the RSI we see that it has returned to the beginning of the upper part of the range.

Daily review of BTC interval 1DHello everyone, I invite you to review the chart of BTC in pair USDT taking into account the one-day interval. First, we will use the yellow line to mark the uptrend line above which the BTC price is moving.
Now we can move on to marking the places of support in the event of a correction. And here, in the first place, it is worth marking the support zone from $ 22,382 to $ 21,228, however, when we fall below this zone, we can see a drop around $ 20,322 and even $ 19,333, then we have a second very strong support zone from $ 17,988 to $ 16,285.
Looking the other way, in a similar way using the Fib Retracement tool, we can determine the places of resistance. We will first mark the resistance zone from $22794 to $23673, when we manage to break it we will move towards the resistance at $24277 and then $26035.
Please pay attention to the CHOP index which indicates that most of the energy has been used, the MACD indicator maintains a downtrend, while the RSI shows an increase and an upward exit from the downtrend.

DOT / USDT 4H CHART - Resistance and Support!Hello, I invite you to review the DOT chart in pair to USDT, on a four-hour interval. First of all, we will use the blue lines to mark the uptrend channel from which the price has gone down, while the yellow lines will mark the downtrend channel in which we are currently moving.
Going further, we can move on to marking support areas in a situation where the correction is deepened. And here the first support is at $5.91, but when we go lower, the next support is at $5.56.
Looking the other way, we see that we first have an important resistance zone from $6.21 to $6.38, only when we break through it will the next resistance be at $6.52 and then $6.66.
Please look at the CHOP index, which indicates that the energy collected is being used to correct the price, the MACD indicates that we have entered a downtrend, while the RSI has touched the lower end of the range.

BNB / USDT 1D INTERVAL, Support and ResistanceHello everyone, welcome to a review of the BNB chart on a four-hour time frame. Let's start by marking with the yellow lines the uptrend channel from which the price went down.
Let's start by marking the support places for the price and we see that the first support is at $279, but if the price goes lower, we have another support at $266, then at $246 and another support at $220.
Looking the other way, we can similarly determine the places of resistance that the price has to face. And here we see that the first resistance is at $290, then we have a strong resistance zone from $308 to $331, and then the price will move towards $361.
The CHOP index indicates that the collected energy is used for the current correction, the MACD indicates entering a downtrend, while the RSI has a further rebound and is approaching the lower end of the range.

Daily review of ETH interval 1DHello everyone, I invite you to review the chart of ETH in pair to USDT, this time on a one-day interval. First of all, using the blue line, we can mark the downtrend, from which the price went up, while currently ETH is on the border of the uptrend line.
As we can see, EMA Cross 10 and 30 are close to entering a downtrend when the red line crosses the green line from above.
Now let's move on to marking the places of support. We will use the Fib Retracement tool to mark the supports, and as you can see we have the first support at $1472, the second support at $1396, then we can mark the strong support zone from $1319 to $1211.
Looking the other way, we can also mark the places where the price should encounter resistance on the way to increases. And here we first have a strong resistance zone from $1553 to $1663, the next resistance is at $1825 and then the third resistance at $2029.
The CHOP index indicates that there is still energy left for the next move. The MACD indicator is in a downtrend. However, on the RSI we see a rebound and that we are moving in a downtrend.

Daily review of ETH interval 4HHello everyone, let's look at the ETH to USDT chart on the 4-hour time frame. As you can see, the price is moving below the local downtrend line.
Let's start with the support line and as you can see the first support in the near future is $1470, if the support is broken then the next support is $1444, $1419 and $1385.
Now let's go to the resistance line, as you can see the first resistance is $1508, if you manage to break it, the next resistance will be $1534, $1555 and $1577.
Looking at the CHOP indicator, we see that there is still some energy left, the MACD indicates the limits of entering the local downtrend, while the RSI has returned to the lower limit of the range.

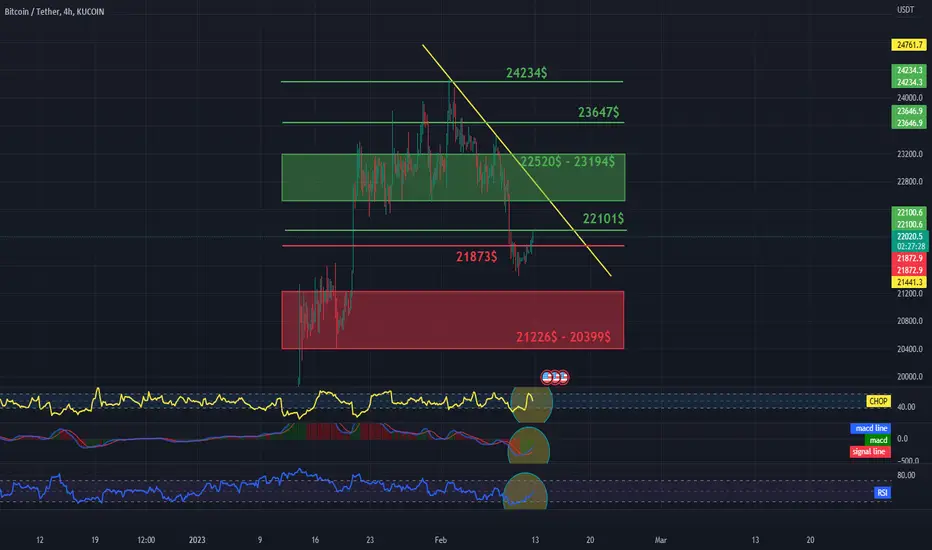
Daily review of BTC interval 4HHello everyone, let's look at the BTC to USDT chart on a 4-hour timeframe. As you can see, the price is moving below the local downtrend line.
Let's start with the support line and as you can see the first support in the near future is $21873, if the support is broken then we have a support zone from $21226 to $20399.
Now let's go from the resistance line, as you can see the first resistance is $22,101, if we manage to break it, then we have a strong resistance zone from $22,520 to $23,194, then resistance at $23,647 and $24,234.
Looking at the CHOP indicator, we see that there is still a lot of energy left for a further move, the MACD indicates entering a local uptrend, while the RSI shows an increase and room for the next move.
SOL - USDT 4HChart, resistance and supportHello everyone, let's look at the SOl to USDT chart on a 4-hour timeframe. As you can see, the price is moving below the local downtrend line.
Let's start with the support line and as you can see the price is currently based on the support at $20.30, if the support is broken we can see a rapid drop to around $16.29.
Now let's go from the resistance line, as you can see the first resistance is $21.38 if you manage to break it the next resistance will be $22.46, 23.26 then a strong resistance zone from $24.10 to $25.28 .
Looking at the CHOP indicator, we see that the energy is exhausted, the MACD is on the verge of returning to an uptrend, while the RSI is moving in the lower range and there is room for growth.

DOT / USDT 1D CHART - Resistance and SupportHello everyone, I invite you to review the DOT chart in pair to USDT, on a one-day timeframe. As we can see, the price is currently based on the downtrend line.
Going further, we can move on to marking support areas in a situation where the current correction is deepened. And here, the first support is at $6.02, then we have the support zone from $5.68 to $5.33, the next support is at $4.84, and then at $4.21, where the last low is.
Looking the other way, we see that the price must first overcome the strong resistance from $6.96 to $7.59, which has not been broken so far. Only when the price breaks through this zone will it be able to move towards $8.49 and then $9.66.
Please look at the CHOP index, which despite the correction indicates that there is a lot of energy, the MACD indicates a downward trend, while the RSI shows a further rebound, but there is still room for a larger price drop.

BNB / USDT 1D INTERVAL, Support and ResistanceHello everyone, I invite you to review the BNB chart as before, taking into account the one-day interval. As we can see, despite the correction, the price is still moving in the uptrend channel.
Let's start by marking the support spots for the price and we see that we first have a support zone from $310 to $293, however, if the price goes lower, we have another support at $279, then a second support zone from $265 to $245.
Looking the other way, we can similarly determine the places of resistance that the price has to face. And here we see that the price failed to break the resistance at $331. We continue to have strong resistance at $361, once the price breaks it, it will move towards resistance at $398.
The CHOP index indicates that we have a lot of energy, the MACD indicates the entry into a downward trend, while the RSI can see a strong rebound.
