Will Ethereum reach 15K soon?In my video I share why is it possible for Eth to reach 14-17K in the next months.
Disclaimer: Not a financial advice
Trend Analysis

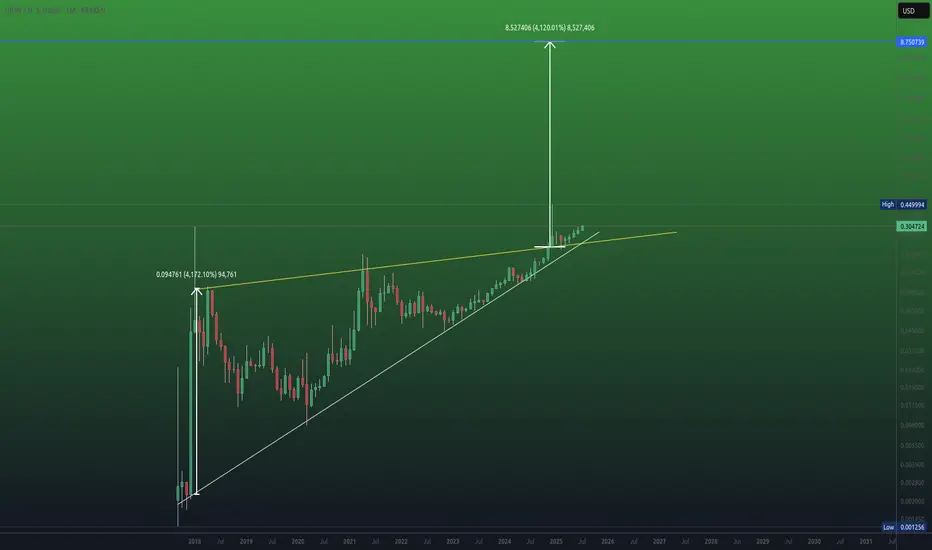
8 Year XRP / US OIL Range Break out?Not to get ahead of myself, but... The 8 year range XRP has been in is about to give, too.
The fibonaccis on that point to (at current oil prices):
- $110 (also in range of a number I'd called for)
- $165 (also in range of a number I'd called for)
- $1035 (w/ full global adoption and swift - not out of the question, but I hadn't been able to substantiate this high with my current model. But I am over solving in the model and have a lot of conservative assumptions, basic math could support it - but alot of unknowns getting there.)
Bitcoin Breakout: Charting the Next TargetsWe’re taking another look at #Bitcoin, which has surged higher and broken above its long-term channel — a move that’s caught the attention of many market watchers.
🔍 Key technical insights:
✅ The recent consolidation appears to be a midway pause in the uptrend. By measuring the preceding flagpole and projecting from the breakout, we derive an overall target near $145,000.
✅ Using Fibonacci extensions:
• From the September 2023 low to the March 2024 peak, projected off the July 2024 low, we see an interim resistance around $127,000.
• A secondary extension from the July 2024 low to the January 2025 high, projected off the March 2025 low, points to approximately $134,500.
📊 The broader bull trend remains intact while Bitcoin holds above its 55-day moving average. For those seeking tighter risk parameters, the 4-hour chart with cloud analysis suggests initial support around $119,500.
⚠️ As always, it comes down to your individual risk tolerance. (This is not investment advice.)
💬 I’d love to hear your perspectives:
• Are these targets on your radar?
• Where do you see Bitcoin heading next?
Disclaimer:
The information posted on Trading View is for informative purposes and is not intended to constitute advice in any form, including but not limited to investment, accounting, tax, legal or regulatory advice. The information therefore has no regard to the specific investment objectives, financial situation or particular needs of any specific recipient. Opinions expressed are our current opinions as of the date appearing on Trading View only. All illustrations, forecasts or hypothetical data are for illustrative purposes only. The Society of Technical Analysts Ltd does not make representation that the information provided is appropriate for use in all jurisdictions or by all Investors or other potential Investors. Parties are therefore responsible for compliance with applicable local laws and regulations. The Society of Technical Analysts will not be held liable for any loss or damage resulting directly or indirectly from the use of any information on this site.

#BTC/USDT It's not over yet! Eying at 130K +ALTCOIN CHEAT SHEET!The last time I shared this chart was on April 14th, when Bitcoin was trading around $84,000 — right when panic was setting in across the market.
The message back then was simple: don’t panic, it’s just a retest.
And here we are again, revisiting the same sentiment with a new chart!
There are a lot of “double top” charts circulating in the space right now, but let me be clear: it’s not over yet.
Before jumping to conclusions, go through this chart and analysis to understand the full picture.
Bitcoin closed the week at $105,705 — certainly higher than most expected just a few days ago.
This marks the first red weekly candle after seven consecutive green closes, which is normal in the context of a healthy uptrend. We're still midway toward the broader target, so there’s no reason to panic or shift into disbelief.
Yes, we may see further corrections in BTC over the coming days or week, potentially down to $98K, and in a less likely scenario, even $ 92K. But this time, Ethereum is showing signs of strength and is likely to outperform Bitcoin, creating high-quality entry opportunities across the altcoin market. In other words, this phase is not a threat, it's an opportunity. BTC is still destined to hit $130k+ as per charts and other important metrics.
Here’s a typical market structure and reaction flow to help put things in perspective:
1. Bitcoin rallies — Altcoins underperform or get suppressed due to capital rotation into BTC.
2. Bitcoin corrects — Altcoins correct further as fear increases and dominance rises.
3. Bitcoin stabilises — Ethereum begins to gain strength, often leading the altcoin recovery.
4. ETH/BTC ratio increases — Ethereum holds up better while many altcoins continue to lag.
5. Bitcoin breaks ATH — This triggers a gradual recovery in altcoins.
6. BTC dominance peaks — Altcoins start gaining serious momentum.
7. Capital rotates from BTC and ETH into altcoins — Sectors tied to the current narrative (like meme coins this cycle, and Metaverse/NFTs in the last one) begin to lead.
8. Altcoin season begins — Utility and mid-cap tokens follow, often delivering strong returns in the final phase.
This pattern has repeated across cycles. Currently, we appear to be in the transition between Bitcoin stabilising and Ethereum gaining dominance — typically the stage that precedes a strong altcoin rally.
Now is not the time to assume the move is over. Stay objective, monitor capital rotation closely, and prepare for what comes next.
If your views resonate with mine, or if this post adds any value to you, please boost with a like and share your views in the comments.
Thank you
#PEACE

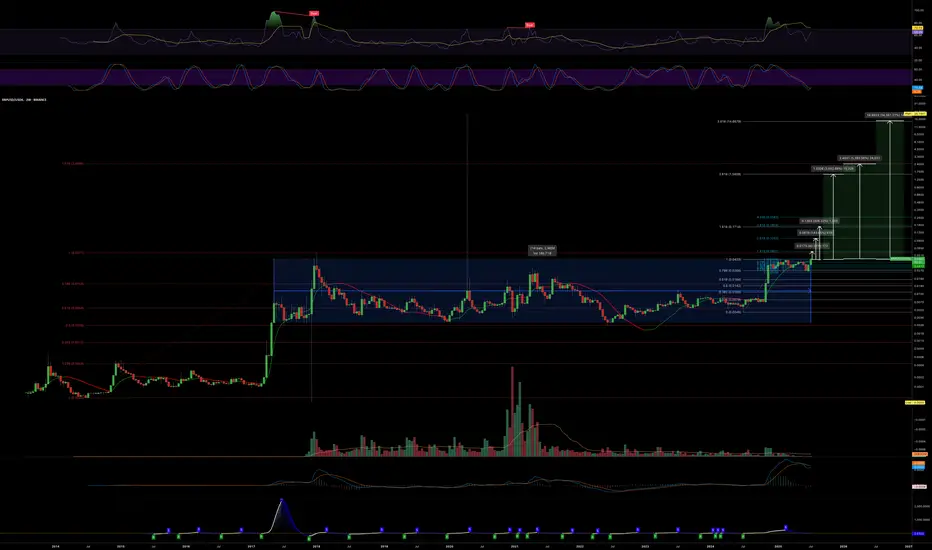
Wave 3Friends,
This wave is much too big to be some kind of first wave!
Technical Section:
What we have:
- The rise from 2019 to 2021 was Wave 1.
- Wave 2 is an expanded flat.
What we don't have:
- Wave 3 = either 1.62 x length of wave 1
or
2.62 x length of wave 1
or
4.25 x length of wave 1

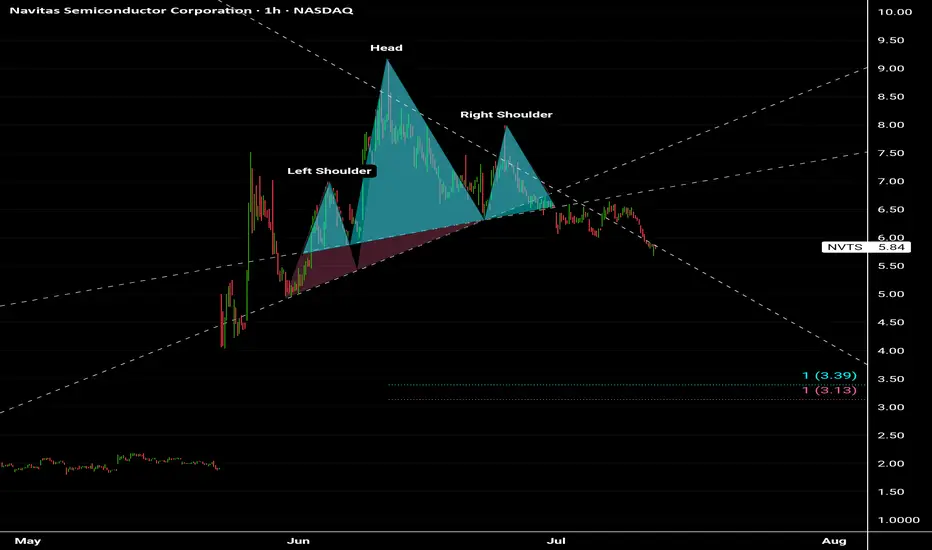
Navitas Semiconductor Corporation NVTS Another Negative Senario in Navitas Semiconductor Stock ...
Head and Shoulders patterns
Target prices between 3.00$ - 3.50$
🤕🤕🤕🤕
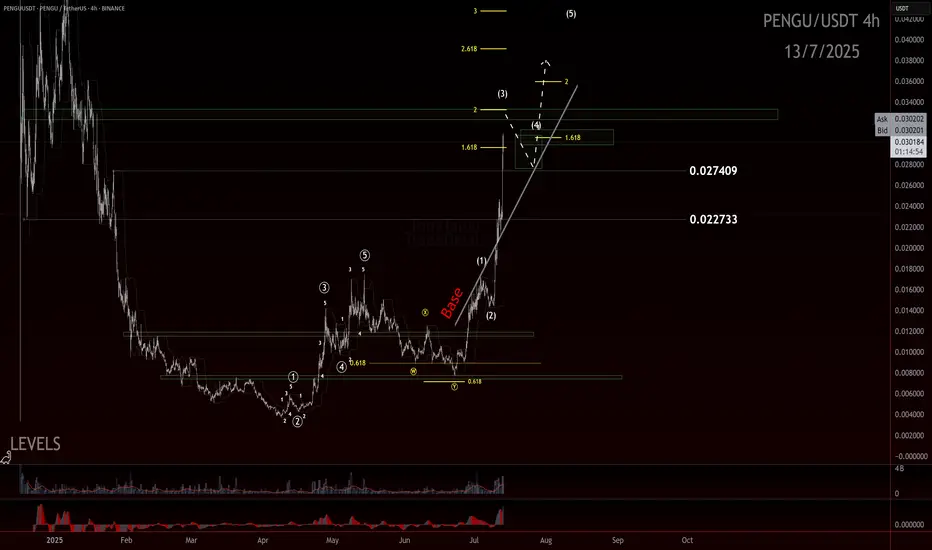
PENGU still has room!?If you find this information inspiring/helpful, please consider a boost and follow! Any questions or comments, please leave a comment!
The move off the low looked like a clean, completed impulse—sharp, decisive, and well-structured. After that, we got a double zigzag retracement. It ran a bit deeper than the textbook version, but still landed right in the normal range you’d expect for a healthy correction. From there, we saw another smaller-degree impulse form off the .007 pivot, suggesting bullish momentum was building again.
Since the last update, PENGU has come a long way—more than doubling in price and now hovering around a most likely target for a wave 3. What’s notable is how it got there: not just by breaking above the 0.017 resistance, but by blowing through multiple base channels on solid momentum and healthy volume.
We didn’t get the ideal depth for a retrace for a wave 2 before that breakout, but that doesn’t disqualify the larger count. In fact, from an Elliott Wave perspective, I still believe we haven’t seen a proper wave 4 to balance out the earlier wave (2). So I’m holding off on calling a top to this wave 3 just yet.
Here’s what we’re watching closely now:
The secondary impulse off .007 continues to build structure
Ideally, the next pullback holds above the 0.027 or .022 region, signaling respect for previous support and AOIs
That pullback needs to unfold correctively, not impulsively, to confirm bullish continuation
The next trade setup I’m eyeing is that wave 4 into wave 5 move. I’ll be stalking this ticker closely as structure unfolds.
Trade safe.
Trade clarity.
Gold LongsFollowing last weeks bias. Looking for REQH target.
Want to pair longs with a weekly profile. Ideally Monday or Tuesday creates the low of week. Will look to get onside with longs once theres a clear intraweek reversal. Trade the continuation higher. A close below 3320 is invalidation. Expecting previous week low to be protected and expansion to the upside

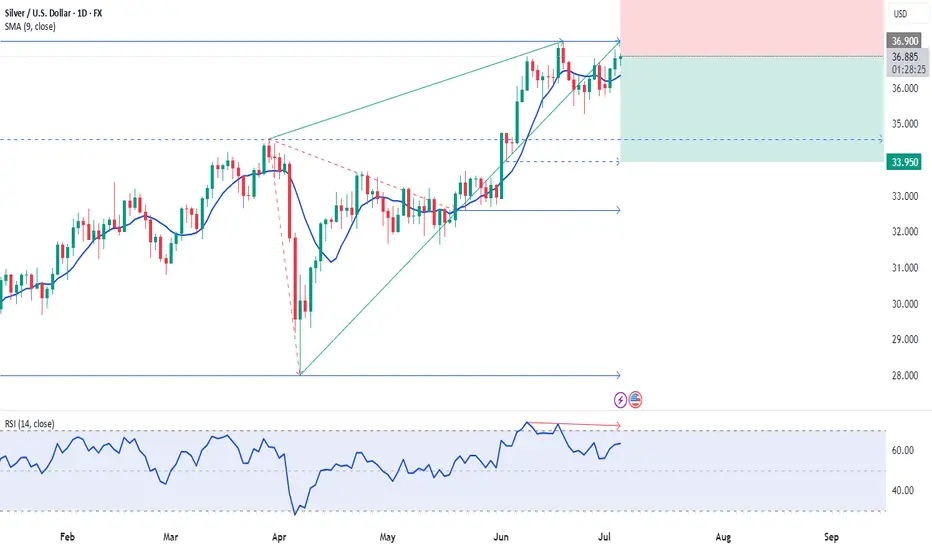
04.07.2025 #XAGUSDSELL 36.9000 | STOP 38.5000 | TAKE 34.7000 - 33.9500 | Medium-term investment forecast on silver deal for the next 2-3 months. On the D1 chart we observe the technical structure of the completion of the ascending wedge. Formation of double top of highs. We also consider a probable potential for the output of volumes in this instrument and a gradual decline to a pronounced support range on the background of growing interest and the potential of the US dollar until the end of summer.
NIFTY 24740: Smart Money Signals Bearish Move IncomingThe directional bias is clear – bearish – and I'm currently waiting for a precise setup to present itself. Based on the Smart Money Concept, we could be looking at a potential short opportunity around the 24740 zone.
📍 Once the setup is confirmed, I’ll be sharing the exact entry and stop-loss levels with you.
Stay tuned – patience here is key. Let the market come to us.

TRON/TRX: The Hottest Chart in All of CryptoThe ascending triangle pattern is obvious as day. Price action has broken out and the triangle's already been tested from the top. Soon TRON will go on price discovery. The target of such ascending triangle is the height of the base of the triangle. I'm a bit conservative so my TP is $8 bucks.
Don't be angry at me please. I don't make the rules. And this isn't financial advice.
Peace out y'all!
USDJPY 30Min Engaged ( Buy & Sell Entrys Detected ) ➕ Objective: Precision Volume Execution
Time Frame: 30-Minute Warfare
Entry Protocol: Only after volume-verified breakout
🩸 Bullish From now Price : 147.350
🩸 Bearish Reversal Price : 147.850
➗ Hanzo Protocol: Volume-Tiered Entry Authority
➕ Zone Activated: Dynamic market pressure detected.
The level isn’t just price — it’s a memory of where they moved size.
Volume is rising beneath the surface — not noise, but preparation.
🔥 Tactical Note:
We wait for the energy signature — when volume betrays intention.
The trap gets set. The weak follow. We execute.

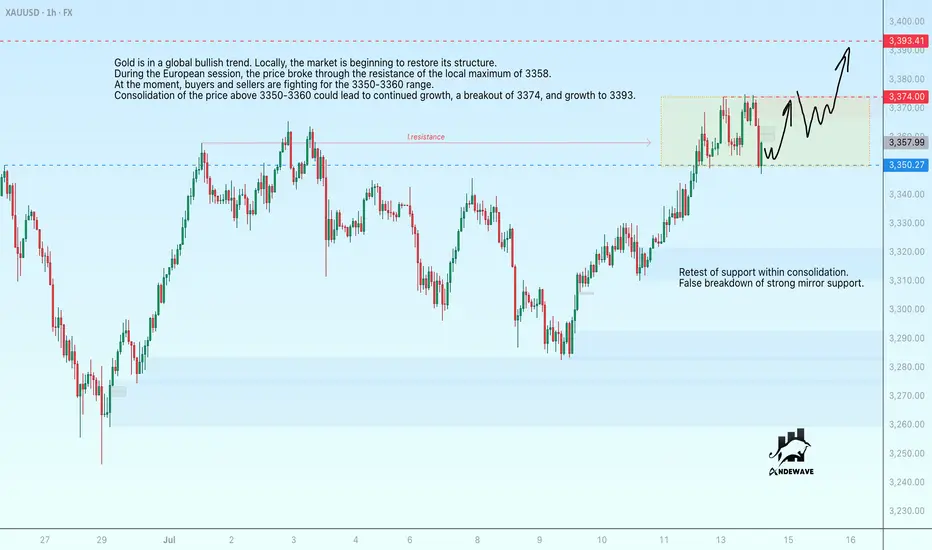
Gold looks set to rise to 3390Gold is in a global bullish trend. Locally, the market is beginning to restore its structure.
During the European session, the price broke through the resistance of the local maximum of 3358.
At the moment, buyers and sellers are fighting for the 3350-3360 range. Consolidation of the price above 3350-3360 could lead to continued growth, a breakout of 3374, and growth to 3393.
Scenario: Consolidation of prices above 3350–3353 could trigger growth to 3375. Further, a slight correction may form from resistance before a retest to break through the level and grow to 3393.
Hype - Resistance Levels to HigherCurrently you are looking at a rising wedge retest on Hype I
It will now either
1) Reject Here
2) Attempt to avoid having to go the full short target by pumping back up through the wedge.
Main Resistance Points coming up that makes be think we see a wick and through, failure to flip the wedge and back down lower
Daily Resistance / Fib Pivot Points
(Labeled On The Chart)
R3 / R2 / R1 / PP S1/S2/S3
$53.66 / $47.96 / $44.45 / $38.7 / $33.03 / $29.55 / $23.86
Fib 1.6 April Swing Low (TOP TOP) is $59 which likely is explored later t

We start ALT Season now with 3 targets!Hello guys,
As you can see we have 3 targets🎯 green, blue, red,
which target we will reach?
It depends on the Fractal scenario on the right, So we will wait 2 clear trends,
each one has 3 tops and Clear correction between the up trends,,
Don't lose your positions and don't jump between currencies!
Also Don't burn your wallet with Future!
Spot is Enough!

PENGU short X10Entry $0.03
Once hit $0.028 place B/E
1st target $0.027 sell 1/2
Stop Loss $0.0315
Final Target - $0.023

GBP/AUD Ready To Go Up After Melted , 2 Entries Valid !Here is my GBP/AUD 1H Chart and this is my opinion , the price moved very hard to downside without any correction and the price at strong support now 2.05000 which is forced the price many times to go up , so it`s my best place to enter a buy trade , and if you checked the chart you will see the price now creating a reversal pattern and i put my neckline and if we have a closure above it to confirm the pattern we can enter another entry to increase our contracts . if we have a daily closure below my support area then this idea will not be valid anymore .

BITCOIN 2025 - THE LAST HOPECRYPTOCAP:BTC currently finds itself at the intersection of geopolitical tensions and broader macroeconomic uncertainty. Although traditionally viewed as a hedge against systemic risk, it is presently exhibiting characteristics more aligned with high-risk assets. The FED's forthcoming policy decisions will likely play a pivotal role in determining whether Bitcoin stabilizes or experiences further downward pressure.
The chart represents the most optimistic scenario for Bitcoin to date

GBPUSD(20250714)Today's AnalysisMarket news:
① Fed's Goolsbee: The latest tariff threat may delay rate cuts. ② The Fed responded to the White House's "accusations": The increase in building renovation costs partly reflects unforeseen construction conditions. ③ "Fed's megaphone": The dispute over building renovations has challenged the Fed's independence again, and it is expected that no rate cuts will be made this month. ④ Hassett: Whether Trump fires Powell or not, the Fed's answer to the headquarters renovation is the key.
Technical analysis:
Today's buying and selling boundaries:
1.3518
Support and resistance levels:
1.3621
1.3583
1.3558
1.3479
1.3454
1.3415
Trading strategy:
If the price breaks through 1.3518, consider buying in, with the first target price at 1.3558
If the price breaks through 1.3479, consider selling in, with the first target price at 1.3454

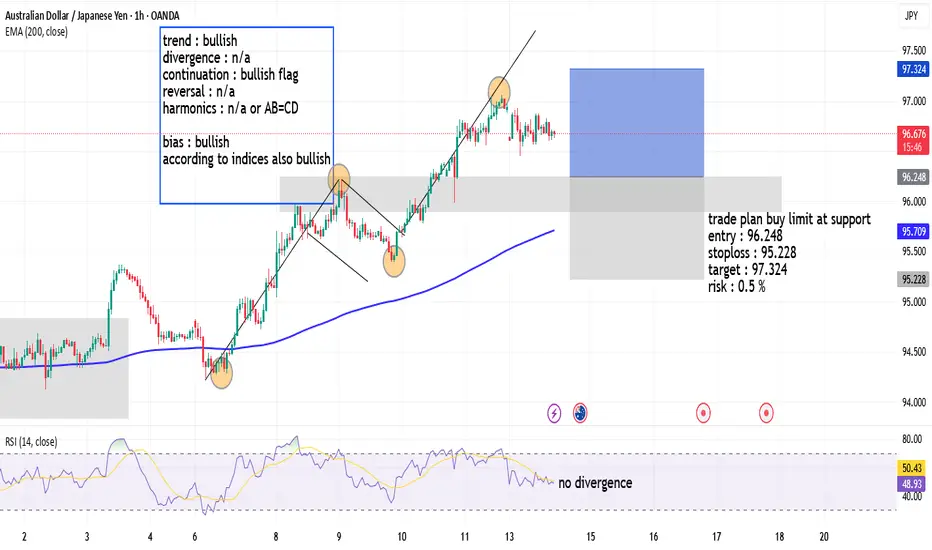
AUDJPY 14-7-2025trend : bullish
divergence : n/a
continuation : bullish flag
reversal : n/a
harmonics : n/a or AB=CD
bias : bullish
according to indices also bullish
Weekly review of SPY, QQQ, GC, CL, ETH, BTC, UBER, TOST, TKOWeekly review of SPY, QQQ, GC, CL, ETH, BTC, UBER, TOST, TKO

ZENUSDT | Triangle Breakout Setup Brewing!#ZEN is currently consolidating in a symmetrical triangle pattern on the 4-hour timeframe, following a strong bearish move. The price action has shifted to a sideways range, signaling a potential trend reversal or continuation setup in the making.
What to Watch:
We’re closely monitoring a bullish breakout from the triangle or resistance zone.
A confirmed breakout with a successful retest will trigger our long entry.
As always, proper risk management is key – wait for confirmation before entering.
Trade Plan:
✅ Wait for breakout above resistance
✅ Look for volume confirmation
✅ Enter on retest with a tight stop-loss
✅ Target recent highs for a solid R:R setup
What’s your take on #ZEN? Do you see a breakout coming or more chop ahead? Drop your thoughts in the comments!
Follow me for more real-time crypto setups and chart breakdowns!
#ZEN #CryptoTrading #PriceAction #TrianglePattern #BreakoutTrade #TechnicalAnalysis #ZENUSDT #Altcoins #TradingSetup #CryptoTA #BullishBreakout #SwingTrade #4hrChart #TradingViewIdeas

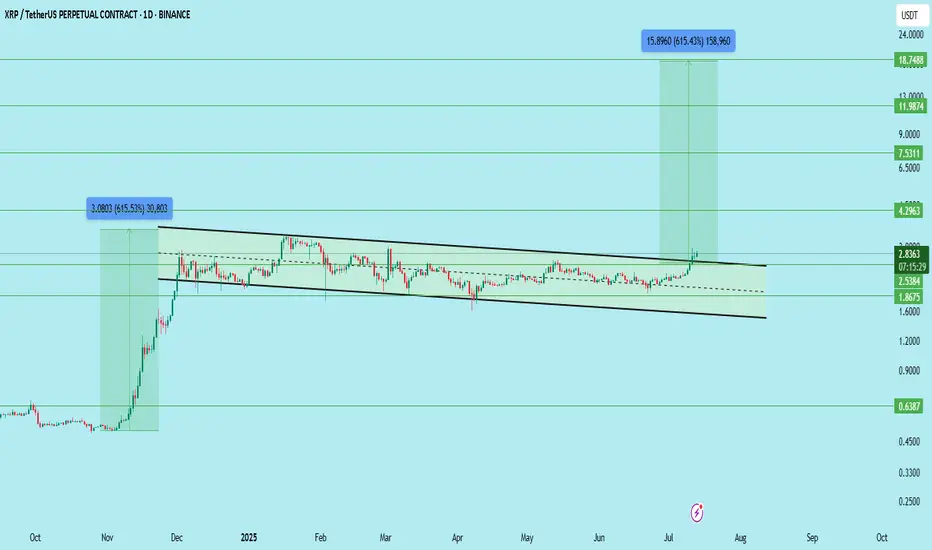
XRP/USDT – Long-Term Breakout Setup FormingXRP has broken out of a multi-month falling channel and is showing early signs of a macro bullish shift. However, price has printed a series of strong green candles, so waiting for a clean retest before entry is advised.
Key Levels:
Support Zones: 2.5384 | 2.00 | 1.8675
Resistance Zones: 2.8340 | 4.2963 | 7.5311 | 11.9874 | 18.7488
Breakout Level: 2.5384 (channel breakout and current structure retest area)
Setup Strategy:
Entry (Ideal): On retest near 2.53–2.60 support zone
Stop Loss: Below 2.00 (or tighter depending on risk appetite)
Target 1: 4.2963
Target 2: 7.5311
Target 3: 11.9874
Target 4 (Final): 18.7488
Upside Potential: Over 600% if the structure plays out fully
Structure Insight:
Multi-month falling channel breakout confirmed
Continuous green candles suggest short-term overextension
Safer entry lies in retest and hold of the breakout zone
Long-term accumulation zone forming between 2.53–2.83
This setup favors long-term investors and swing traders waiting for a macro move. Let the price come to you — avoid chasing.
DYOR | Not Financial Advice
#XRP #Ripple