EURGBP, Bullish Breakout!!!EURGBP after getting rejected from the support we can expect again a upside movement.
I am expecting a movement from 0.86500 to 0.8700 at least, we can plan sl below 0.86300.
Safe Player wait for proper breakout and wait for retest of 0.8650 area.
Trend Analysis

Bears Target $0.14 DOGE — Is the Trend Your Friend?DOGEUSDT has been in a clear downtrend since late July, printing consistent lower highs and lower lows. The current market structure shows sellers firmly in control, with every bullish bounce quickly fading. The recent rejection near $0.2244 and the inability to sustain above the $0.21 zone highlight persistent selling pressure.
At the moment, DOGE is hovering around $0.2043, just under a short-term resistance band between $0.2067 and $0.2090. This area has acted as a rejection point in the last few sessions, suggesting that unless bulls can break above it with strong volume, the path of least resistance remains downward. Below, the first major support sits at $0.1855. If that breaks, the selling could accelerate toward $0.1680, a level that aligns with a previous consolidation base from June. In an extended decline, $0.1427 comes into view as a long-term support level that previously acted as a strong demand zone.
The chart also shows an active short trade setup in play:
• Entry: $0.2043
• Stop-Loss: $0.2244
• Targets: TP1 at $0.1855, TP2 at $0.1680, and TP3 at $0.1427
From a risk-reward perspective, this setup remains attractive, especially if the price breaks below $0.1855. However, traders should watch for any bullish invalidation signs — a close above $0.2136 could challenge the short bias, while a sustained break above $0.2244 would signal a possible trend shift. Until then, the broader technical picture still favors the bears.

XAU/USD (Gold) - Triangle Breakout (1.08.2025)The XAU/USD Pair on the M30 timeframe presents a Potential Selling Opportunity due to a recent Formation of a Triangle Breakout Pattern. This suggests a shift in momentum towards the downside in the coming hours.
Possible Short Trade:
Entry: Consider Entering A Short Position around Trendline Of The Pattern.
Target Levels:
1st Support – 3249
2nd Support – 3225
🎁 Please hit the like button and
🎁 Leave a comment to support for My Post !
Your likes and comments are incredibly motivating and will encourage me to share more analysis with you.
Best Regards, KABHI_TA_TRADING
Thank you.
Disclosure: I am part of Trade Nation's Influencer program and receive a monthly fee for using their TradingView charts in my analysis.

Rates Coming Down?TLT could be a great trade here. I'm seeing signs that the low could be in. The RSI is coiling up and piercing the downtrend. We are also climbing above the 21 Week Moving average, which is has been firm resistance since the rate hiking cycle.
Bond yields are tanking, employment is weakening, pressure is building on rate cuts from the highest level. TLT could be a beneficiary.
Not financial advice, do what's best for you.

Do you think I'm joking ???As I said, Bitcoin broke the triangle, and now with a slight price correction(109k), it could surge to $150k , and you still think I'm joking!!
Previous analysis

Ethereum: Smart Money Reversal After Stop Hunt?In the previous update, we warned that Ethereum might drop lower before any meaningful bounce — especially if it failed to hold the midline of the ascending channel. That scenario played out exactly as anticipated.
🟡 Price action summary:
ETH broke below the midline of the weak ascending channel, hunted the liquidity below recent lows, and tapped into the key bullish order block near $3,490 – $3,520. Price is now reacting to this zone with early signs of a reversal.
📌 Key observation:
Midlines of weak or low-momentum channels often act as liquidity traps in smart money models. Buying at these levels can be extremely risky — especially during corrective or distribution phases.
⸻
📚 Educational Note:
Never enter long positions solely at the midline of a weak ascending channel, especially when there’s a high probability of liquidity sweep below. Smart entries usually occur at order blocks formed after stop hunts.
⸻
🎯 Next steps:
Wait for confirmation (such as internal BOS or FVG closure) before entering longs. The structure suggests a potential move back toward the upper boundary of the channel if this OB holds.
⸻
🔗 Save this analysis and share it with fellow traders.
💬 Thoughts? Drop your view in the comments.

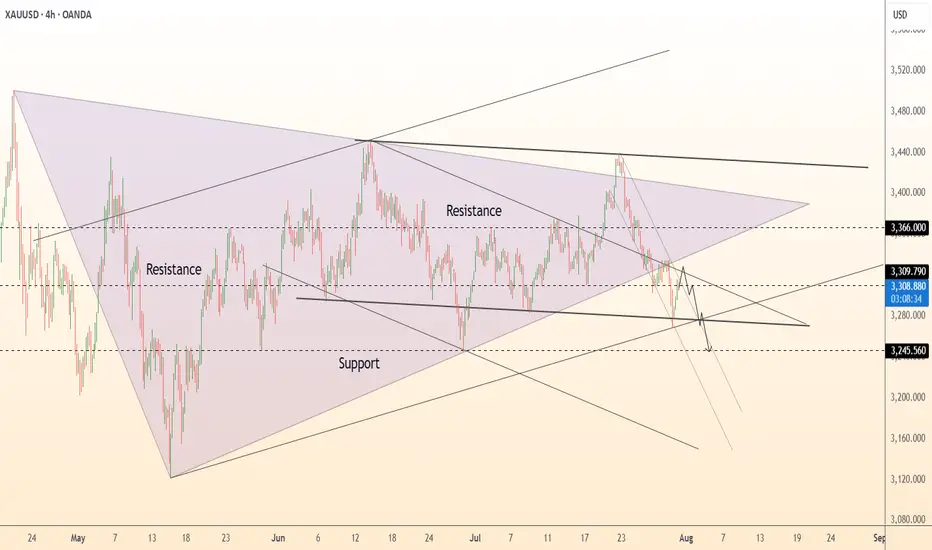
DeGRAM | GOLD fixed below the triangle📊 Technical Analysis
● XAUUSD is forming a bearish descending wedge within a broader symmetrical triangle, facing rejection at 3,310 near prior support-turned-resistance.
● Repeated failure to hold above trendlines and continued lower highs favor a drop toward the 3,246.56 level, with possible overshoot if support breaks.
💡 Fundamental Analysis
● Rising real yields and hawkish Fed tone continue to pressure gold; ISM Manufacturing Prices and NFP loom as next volatility catalysts.
● Reduced ETF inflows and strong dollar on resilient US macro data weigh on demand for non-yielding assets.
✨ Summary
Short bias below 3,310. Breakdown eyes 3,246 → 3,200 zone. Resistance holds while trendline caps recovery.
-------------------
Share your opinion in the comments and support the idea with a like. Thanks for your support!
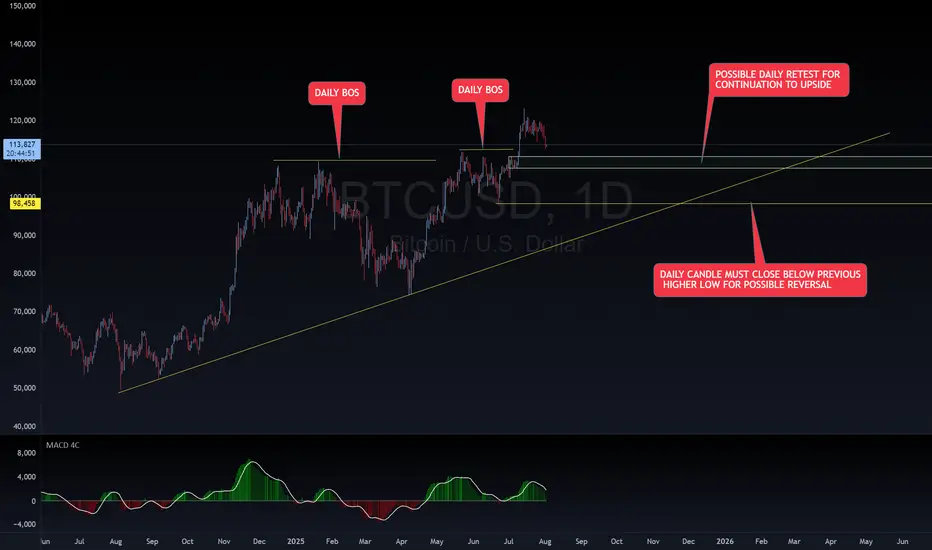
BTC BUY SET UPBTC is on an overall DAILY uptrend with a DAILY BOS. Waiting on a DAILY retest for continuation upward. If DAILY candle breaks and closes below last DAILY HL, it could potentially cause a reversal to downside. Happy trading!
~~~~I want everyone to succeed!
DXYBack to the initial direction which is bullish momentum acoording to cot report. And I'm expectiong more continuation till maket close of before

to 65K soon BTC/USD – Historical Cycle Analysis & Mid-Term Outlook (1W)
Exchange: Coinbase
Timeframe: Weekly (1W)
Key Observations:
Long-Term Trendline Resistance
The black ascending trendline has historically acted as a major resistance zone since 2017.
Every touch of this line in the past has been followed by a significant correction.
Bearish Divergences (DIV / HDIV)
Red arrows indicate historical bearish divergences on RSI/MACD.
Each divergence marked a local or macro top before a sharp retracement.
Major Historical Resistance – $64,899
Derived from 0.5 Fibonacci retracement of the primary cycle.
Served as a key ceiling during previous cycles before new all-time highs.
Bitcoin Cycle Behavior
BTC historically forms parabolic tops followed by deep corrections.
The current cycle (2024–2025) mirrors 2017 and 2021 structures, suggesting we may be approaching a macro inflection point.
Mid-Term Scenario
Price near the trendline (~$120K) implies high risk of volatility and correction.
Primary support zone: ~$65K (historical + Fibonacci confluence).
Likely scenario: range-bound movement between $65K–$120K before any sustainable breakout or new parabolic leg.

Continued recovery, positive after NFP news✍️ NOVA hello everyone, Let's comment on gold price next week from 08/04/2025 - 08/8/2025
⭐️GOLDEN INFORMATION:
Gold prices surged over 1.5% on Friday, climbing toward $3,350, as a weaker-than-expected U.S. Nonfarm Payrolls (NFP) report signaled a faster-than-anticipated slowdown in the labor market. Heightened geopolitical tensions between the U.S. and Russia further boosted safe-haven demand for the precious metal.
Following the disappointing July jobs data, markets began pricing in a potential interest rate cut by the Federal Reserve. While the Unemployment Rate held relatively steady, signs of labor market softness supported recent comments from Fed officials Michelle Bowman and Christopher Waller, who advocated for a 25-basis-point rate cut at the July 29–30 meeting.
Additional data added to the cautious sentiment: the ISM’s July report confirmed that U.S. manufacturing activity remains in contraction territory, while consumer confidence took a hit, according to the University of Michigan’s latest survey.
⭐️Personal comments NOVA:
Gold prices continue to be positively affected after last week's NFP news, market expectations of an early rate cut are rising
🔥 Technically:
Based on the resistance and support areas of the gold price according to the H4 frame, NOVA identifies the important key areas as follows:
Resistance: $3384, $3434
Support: $3331, $3307, $3268
🔥 NOTE:
Note: Nova wishes traders to manage their capital well
- take the number of lots that match your capital
- Takeprofit equal to 4-6% of capital account
- Stoplose equal to 2-3% of capital account
- The winner is the one who sticks with the market the longest

XRPUSDT ShortWe´ve just finished the 5th wave of the bullish structure and started a 5 wave corrective structure for a bigger ABC correction. Right now we´re in the 4th wave and exspecting one more bearish move into the yellow area

Fiber (EurUsd) Short Idea. Aug 4-8 This Idea wont be precise as my Last Euro Analysis, You can check that out on my Profile.
Now the what do i mean by it not being precise? it means that there is room for upside Movement But it should break that high (Fib high) and the target is Sell-Side Liquidity for this week Key Things in this charts are Liquidity gap, Breaker block IFVG weekly Inverse rejection block.

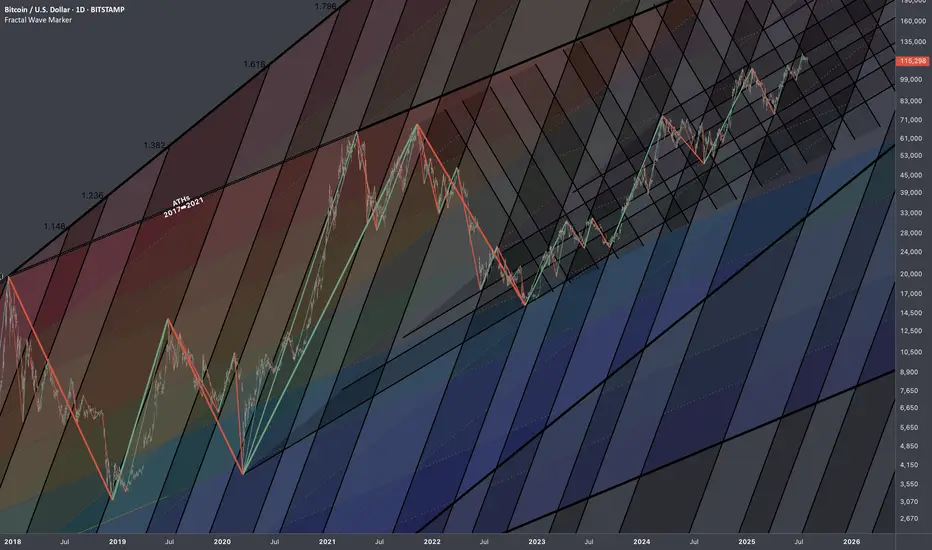
Bitcoin: Interconnections Rewired🏛️ Research Notes
Keeping fib channel of the rising trend angles as they've number of times covered well that aspect of cycle texture.
The other frame of reference would be with fib channel that covers drop from 2021 ATH to late 2022 bottom.
Last bit would be integrating fib channel discovered while ago that connects covid & late 2022 bottoms
Together they create a framework that addresses the complexity and makes even the most chaotic price movements seem to be a part of structural narrative.
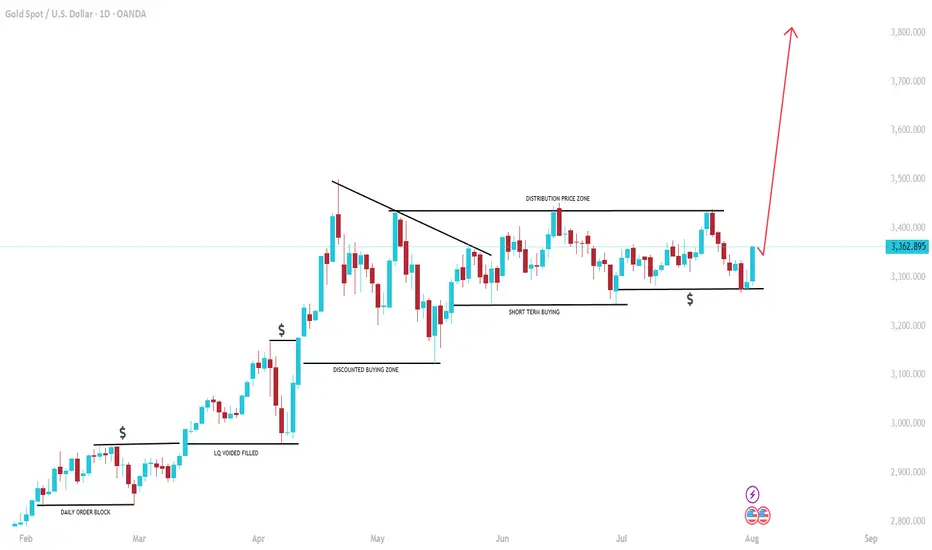
GOLD: $4000 on the way! Bulls has the controlGold is on the way hitting a record high since the global tension rising we can see gold creating another record high. Please note that it is a swing trades and may take weeks and months to hit the target or it may not even reach the target itself. This is prediction only so do your own due diligence.
BTCUSD: Long Signal with Entry/SL/TP
BTCUSD
- Classic bullish formation
- Our team expects growth
SUGGESTED TRADE:
Swing Trade
Buy BTCUSD
Entry Level - 11326
Sl - 11231
Tp - 11516
Our Risk - 1%
Start protection of your profits from lower levels
Disclosure: I am part of Trade Nation's Influencer program and receive a monthly fee for using their TradingView charts in my analysis.
❤️ Please, support our work with like & comment! ❤️

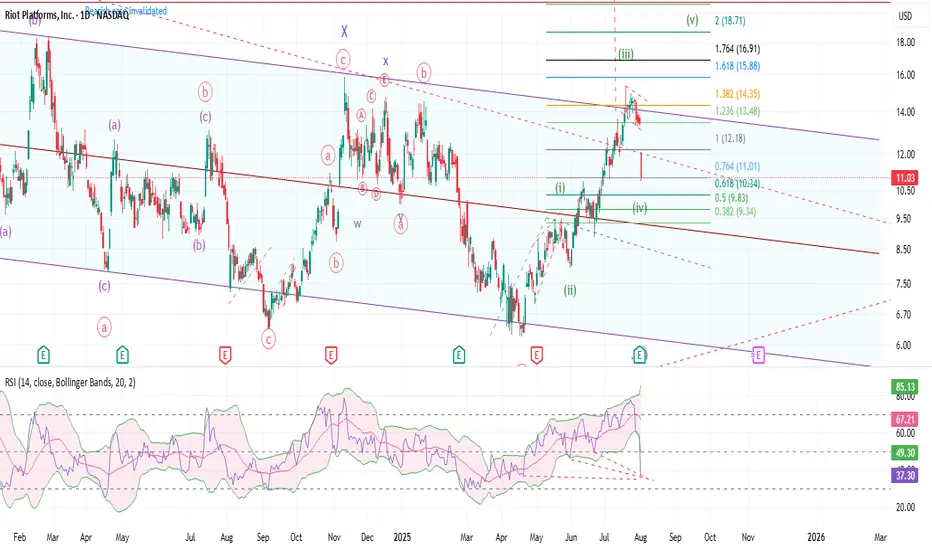
RIOT: Looks pretty bad, but still has a chance to recoverBreaking down into the big bad channel maybe was the first warning of a false breakout. August first price action just made things a whole lot worse. The hope here is that RSI is tanked and has multiple pints of bullish divergence. But the bad news is, the overall price action is still a very 3 waves structure. If price falls into wave 1 territory, then it is pretty much game over. It could be a leading diagonal, or it could be another x wave to bring the price back down to the bottom of the channel yet again. BTC is also trying to maintain must keep support level. So, if next week we see a sharp recovery, then the 5 waves structure may still be intact. However, if price breaks down below $10, then best to stay out of it until things settle down. I took some profit at the top of the channel and got stopped out for most of my position for now. I will hold the rest with a stop at $9.5. If price recovers, then will ride the final wave towards $18.
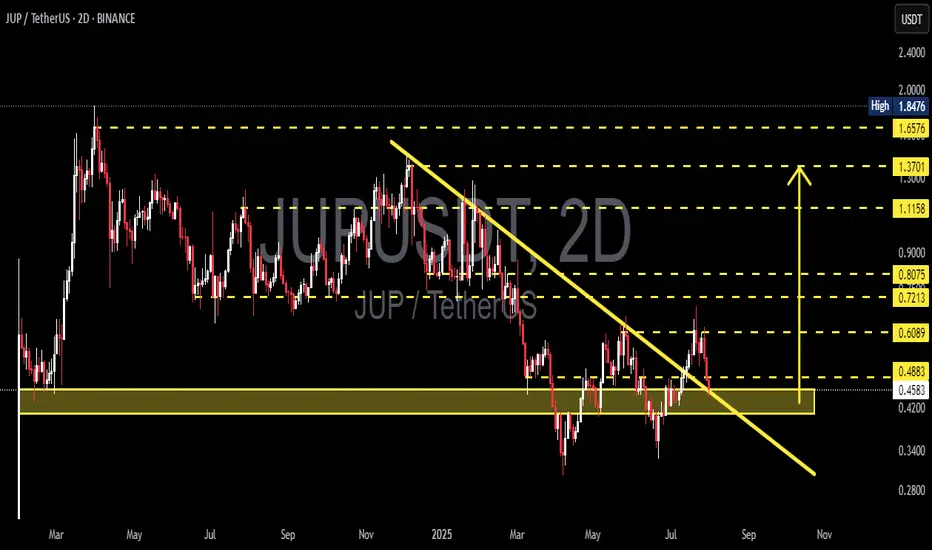
JUP/USDT Retests Key Support! Bounce Incoming or Breakdown Ahead📉 Complete Technical Analysis:
The JUP/USDT pair is currently showing a critical price action after breaking out from a medium-term descending trendline (yellow diagonal line). However, the price is now retesting a major demand zone around $0.4200–$0.4574.
📌 Pattern Identified:
Descending Trendline Breakout: Price successfully broke above a long-standing bearish trendline.
Retest of Breakout Zone: The current move is a classic retest, often seen before a trend reversal continuation.
Strong Demand Zone: The yellow zone ($0.4200–$0.4574) has historically served as a strong accumulation and bounce area.
---
📈 Bullish Scenario:
If the price holds and bounces from the $0.4200–$0.4574 zone, bullish momentum could resume with upside targets:
Short-term target: $0.6089
Next resistances: $0.7213 – $0.8075
A confirmed higher low above support would strengthen the bullish structure.
---
📉 Bearish Scenario:
If the price breaks down below $0.4200, bearish pressure could return, leading to further downside.
Potential decline toward deeper support levels around $0.35–$0.30.
Breakdown with increasing volume would confirm seller dominance.
---
🎯 Key Levels to Watch:
Support Zone: $0.4200 – $0.4574 (Critical Retest Area)
Immediate Resistance: $0.4883, $0.6089
Major Resistance Levels: $0.7213, $0.8075, $1.1158, up to $1.6576
---
🧠 Conclusion:
JUP/USDT is currently at a crucial decision point. The reaction at this support zone will define whether the breakout holds or fails. Traders should watch this level closely for confirmation of the next major move.
#JUPUSDT #CryptoAnalysis #AltcoinUpdate #TechnicalAnalysis #CryptoBreakout #SupportAndResistance #TradingView #Cryptocurrency #ChartPattern #BullishSetup #BearishCase
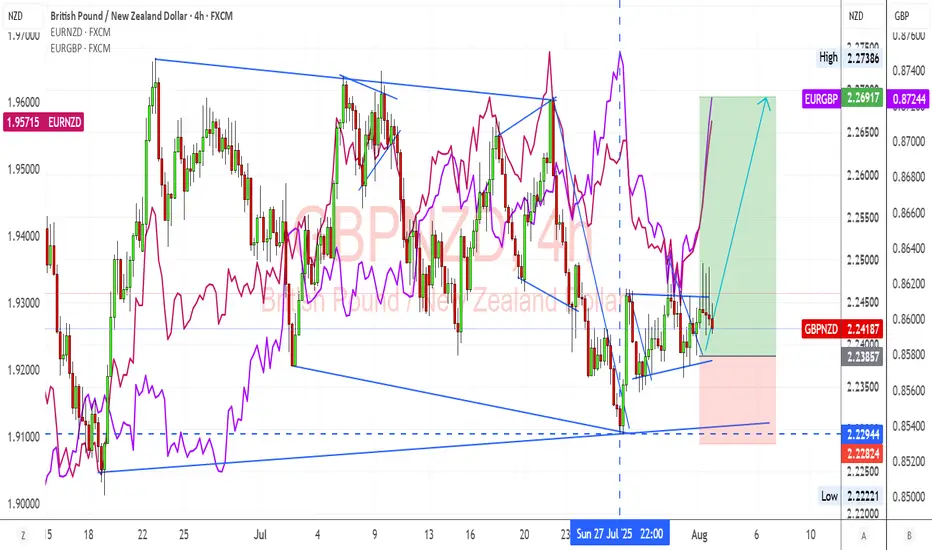
GBPNZD Breakout from Consolidation Bullish Momentum BuildingGBPNZD has broken out of its recent consolidation pattern and is showing signs of bullish continuation. Strong GBP fundamentals combined with NZD weakness from global risk-off sentiment and tariffs support this technical move.
Technical Analysis (4H Chart)
Pattern: Breakout from a descending channel with bullish follow-through.
Current Level: 2.2418, trading above the breakout level, confirming momentum shift.
Key Support Levels:
2.2294 – recent breakout support and invalidation point for bulls.
2.2222 – secondary support if a deeper pullback occurs.
Resistance Levels:
2.2500 – near-term resistance and potential target for the breakout.
2.2690 – extended bullish target if momentum continues.
Projection: Likely to continue higher toward 2.2500, with room for 2.2690 if GBP strength persists.
Fundamental Analysis
Bias: Bullish.
Key Fundamentals:
GBP: Supported by BOE’s cautious stance on inflation and the relative resilience of the UK economy.
NZD: Pressured by global tariffs, weaker risk sentiment, and limited domestic growth catalysts.
USD Factor: Fed rate cut expectations indirectly support GBP crosses against risk currencies like NZD.
Risks:
Hawkish surprise from RBNZ could strengthen NZD.
BOE dovish signals could stall GBP upside.
Key Events:
BOE meeting and UK CPI.
RBNZ policy decision.
Risk sentiment trends globally.
Leader/Lagger Dynamics
GBP/NZD is a leader among GBP crosses, with GBP strength and NZD weakness driving momentum. It also aligns with EUR/NZD upside moves, reinforcing the bearish NZD outlook.
Summary: Bias and Watchpoints
GBP/NZD is bullish, having broken consolidation with upside targets at 2.2500 and 2.2690. The main drivers are GBP’s policy support, NZD’s risk-off weakness, and global tariff concerns. Watch for BOE and RBNZ updates as potential volatility triggers.
XRP 1H – 21% Decline Off the HighAfter hitting a strong resistance near $3.75, XRP has been in a steady downtrend, losing over 20% from its peak. The chart shows clear lower highs and a strong descending resistance line capping every bounce. Price action remains bearish, but short-term momentum (via Stoch RSI) shows signs of being oversold — hinting at a potential relief bounce.
To flip bias, bulls would need a clean break of the trendline and reclaim the $3.15–$3.25 area. Until then, lower highs + sustained sell volume = caution for longs.
📌 20.6% decline
📌 Downtrend intact
📌 Momentum diverging — bounce or continuation?
This setup is primed for a mean-reversion or further breakdown — stay reactive, not predictive.

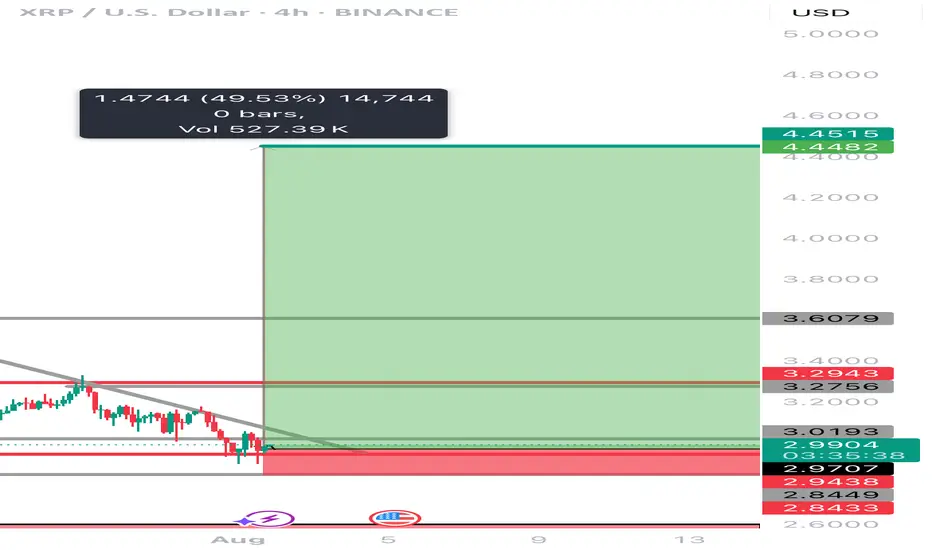
Can XRP obtain a 50% increase in the next few weeks XRP has recently been under a lot of manipulation lately! Is it time for the bulls to finally step in and move the price point on this digital asset to a 50 percent increase to another ATH at $4.45………? The world will see with the next few weeks! And why is #Bradgarlinghouse X account always following 589………..? It’s it a signal or is he just trolling
VETUSDT is BullishPrice was in a downtrend, however the bullish divergence with a double bottom reversal pattern hints the control of bulls. If previous lower high is broken with good volume then we can expect a bullish reversal as per Dow theory. Targets are mentioned on the chart.

SOL 1H – Bounce From Demand, Can It Reclaim the Breakdown Zone?SOL tapped into the key demand zone near $157 and is now showing signs of a reaction bounce. Price is approaching the former support-turned-resistance zone around $184 — a critical level that marked the start of the previous breakdown.
A reclaim of that zone would suggest bulls are regaining control, opening up room toward the $190–$200 region. Until then, it remains a lower high attempt inside a bearish structure.
📌 Demand bounce
📌 Bearish market structure
📌 Key resistance at ~$184
No confirmed reversal yet — just a bounce until proven otherwise. Keep watching the structure evolve.
