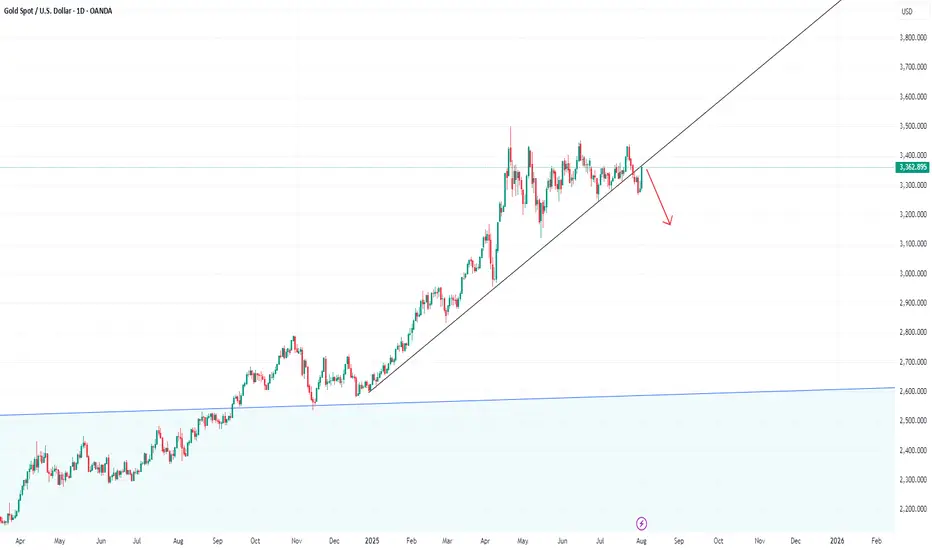
xauusdxauusd Focus on red line
From the price level of 3368 and above, gold is expected to pull back at least until the Stochastic on the M30–H1 timeframes reaches oversold levels.
After that, a bullish continuation is likely, pushing the price up to around 3400.
This area will be a critical decision point — determining whether the market will continue its uptrend or reverse into a downtrend.
If the H4 chart prints a reversal candlestick pattern, it would indicate the beginning of a bearish trend, which could potentially lead to a downward movement of up to 20,000 points.
Trend Analysis

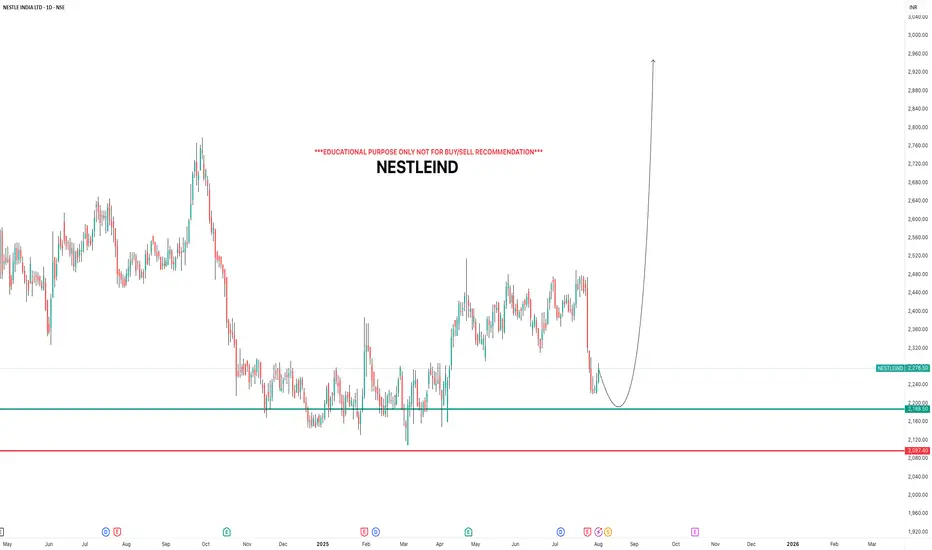
NESTLEINDIAi Observed these Levels based on Price Action and Demand & Supply which is my own Concept "PENDAM CONCEPTS"... Please don't take any trades based on this chart/post... Because this chart is for educational purpose only not for Buy or Sell Recommendation... Thank Q
USDJPY descending only to fetch more buyers.The USDJPY bearish mode might be short-lived if it could show any reversal pattern on a shown orderblock!

EPIC : Risky signal...Hello friends🙌
🔊Due to the good price growth, we have found important support points for you.
Now, due to the price correction, we have found buy points for you and you can buy with risk and capital management and move with it until the goals we have set for you.
🔥Follow us for more signals🔥
*Trade safely with us*

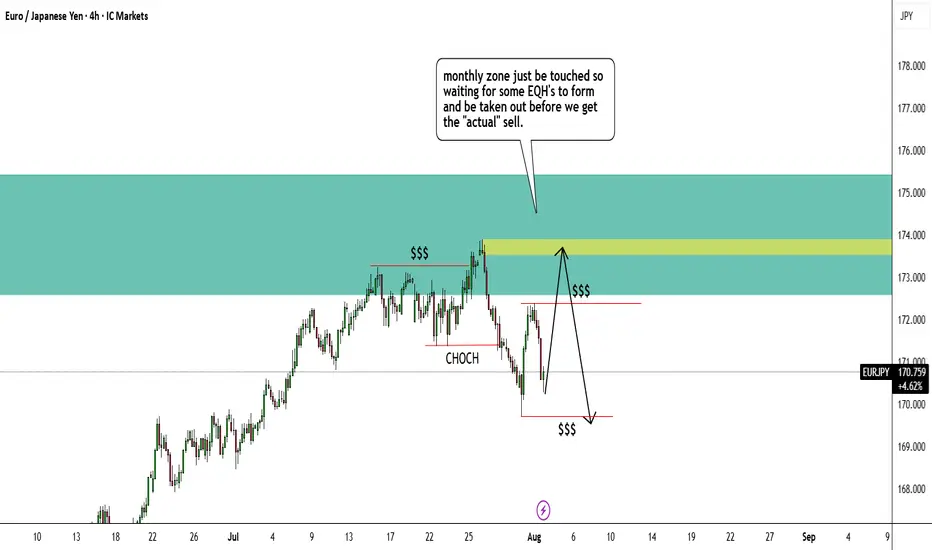
EURJPY shortsHello everyone
I got a EURJPY short trade coming up soon.
Reason being is that price came back to the monthly supply zone (blue)
Price than made a EQH zone which got taken out and created a CHOCH.
Price is now consolidating and has formed EQL and EQH but i believe price will break EQH first to come back to 4hr supply zone (yellow).
Some news is also coming out as well which could influence price as well
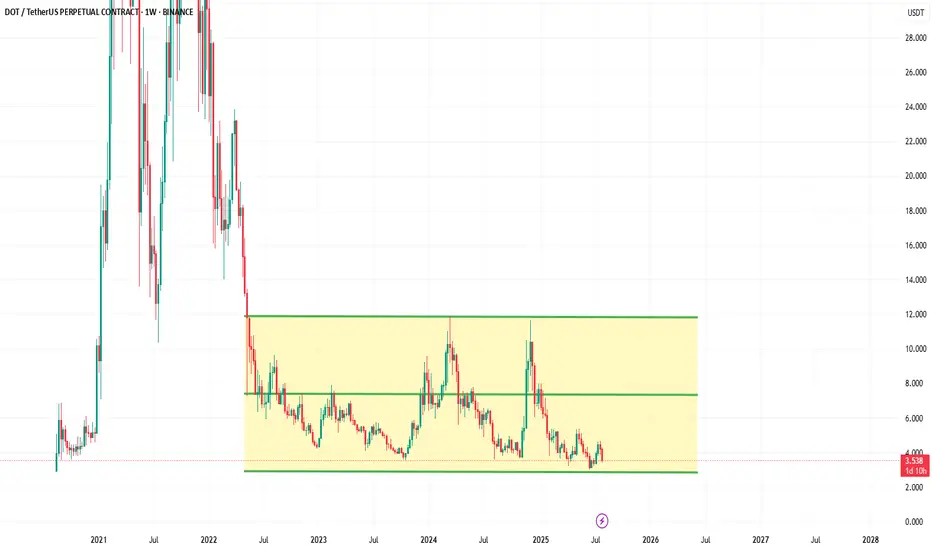
DOT is sitting at the bottom of the Weekly Channel💰 #DOT is sitting at the bottom of the Weekly Channel👀
Given the fact that market is in correction mode, it's literally the dip🔥
Target: 10$📈
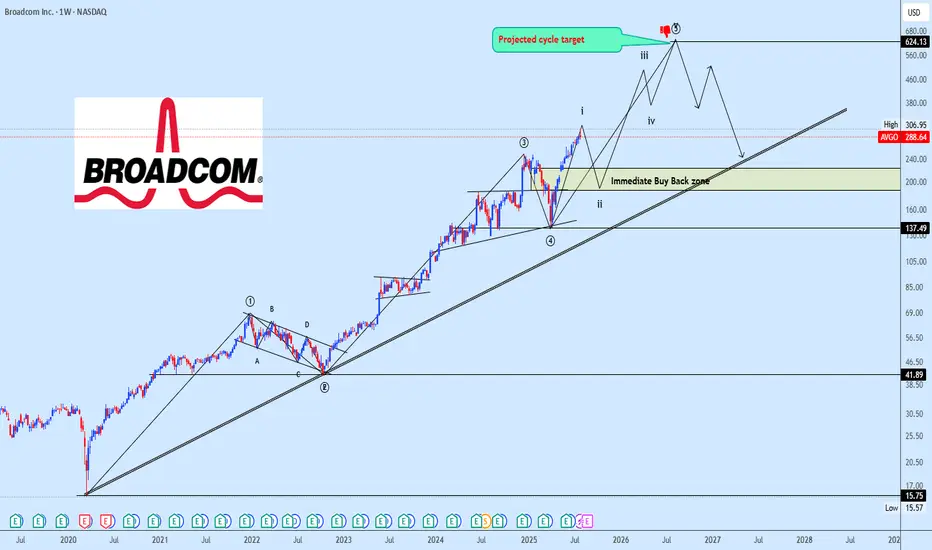
AVGO Bullish Impulse Wave Structure in ProgressAVGO continues its macro advance with a clear 5-wave impulse structure unfolding. The current price action marks the completion of subwave (i) of wave ⑤, setting the stage for a corrective pullback into subwave (ii).
We expect this corrective leg to reach into the 38.2%–50% Fibonacci retracement zone of subwave (i), which will serve as a potential re-accumulation area before the next bullish expansion.
The strategy remains to monitor the development of wave (ii) closely, waiting for key price reaction around the identified retracement zone to build positions in anticipation of subwave (iii) of ⑤ typically the strongest and most impulsive move in Elliott Wave structure.
Targets are shared on the chart for clarity. Patience here is key as we await the right entry zone aligned with technical confluence.
📌 Drop your stock requests in the comment section for quick chart updates — only equity-based assets will be accepted under this post.
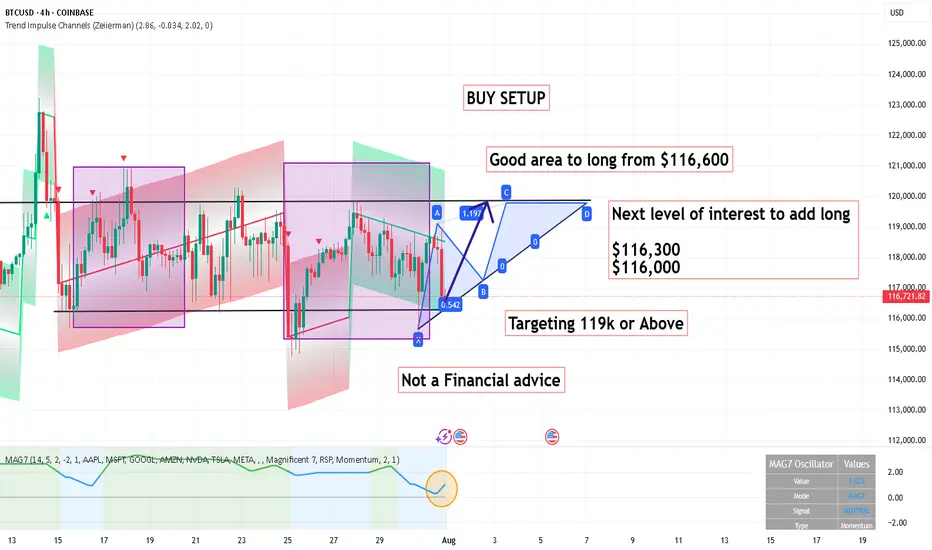
BUY SETUP ,Good area to long from $116,600BUY SETUP
Good area to long from $116,600
Next level of interest to add long
$116,300
$116,000
Targeting 119k or Above
Its not a Financial advice
LIVE TRADEHello friends🙌
Given the good trend we had, now that we have had a price correction, we can enter the trade with risk and capital management and move towards the specified goals.
🔥Follow us for more signals🔥
*Trade safely with us*
The worst drops often come later!Don’t be fooled by the first crash… The worst drops often come later in a bear market.
Let’s break down the brutal truth about the 2008 GFC and what it teaches us today. 🧵
1.
In the 2007–2009 bear market, the S&P 500 had 7 failed rallies before finally bottoming.
Every bounce looked like the bottom — and every one was a trap.
👇
2.
The early drops were steep:
🔻 Down 11%
🔻 Down 17%
But the most violent crashes came after those…
Near the END — not the beginning — of the bear market.
3.
Later stage declines:
❌ Down 28%
❌ Down 36%
❌ Down 29%
That’s when capitulation kicked in.
Investors gave up. Fear took over.
4.
Capitulation volume isn’t a guaranteed bottom.
It feels like it’s over.
But if fundamentals haven’t turned and the trend isn’t broken, the bear can still bite — hard.
5.
Final crashes are like cliffs:
Markets are exhausted.
Hope is crushed.
And that’s finally when the real bottom shows up.
6.
The lesson?
Bear markets are full of traps.
Relief rallies can fool even seasoned pros.
Stay patient. Wait for trend confirmation. Don’t chase fake bottoms.
7.
📉 The biggest crashes usually happen at the end of the bear market.
That’s the final flush — and it sets the stage for true opportunity.
Learn from the past. Don’t get trapped. Stay sharp.

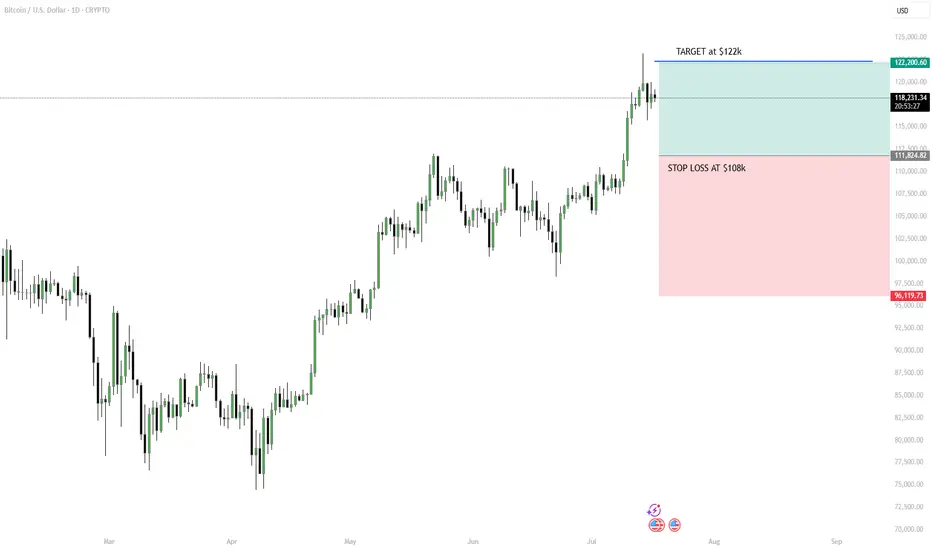
Strategy: “Breakout Bounce” – Buy the Retest, Ride the WaveHello Traders! BTC has broken out above $118K–$120K after a strong uptrend. Now it’s pausing, and a short-term pullback looks likely. Instead of buying the top, we wait for the price to retest previous resistance (around $112K–$114K), which could turn into support.
MY PLAN:
Wait for pullback to $112K–$114K zone.
Look for a bullish candle (daily or 4H) to confirm entry.
Target: $122K short-term or trail stop if trend continues.
Stop loss: Below $108K to manage risk.
Tip: Don’t chase. Be patient, follow the setup, and use proper risk management.
Please leave a comment and don't forget to support a fellow trader! Also, you can leave in the comments your target and plan ideas!
Have a great day y'all!
-Neo
Pullback and then down!I would like to see this daily candle as a pullback to the trendline. So I expect the price to fall.
Bitcoin ATHBINANCE:BTCUSDT This is amazing for crypto community because this level-up all of lover crypto currencies.
Next target: 120.000K
Best for pollback levels: 111.000K & 105.500K
👓We are this time keep calms emotional in buy or sell.

Novo Nordisk (Revised) | NVO | Long at $47.78**This is a revised analysis from February 5, 2025: I am still in that position, but added significantly more below $50**
Novo Nordisk NYSE:NVO is now trading at valuations before its release of Wegovy and Ozempic... From a technical analysis perspective, it's within my "major crash" simple moving average zone (gray lines). When a company's stock price enters this region (especially large and healthy companies) I always grab shares - either for a temporary future bounce or a long-term hold. While currently trading near $47 a share, I think worst case scenario here in 2025 is near $38-$39. Tariffs may cause a recession in the second half of 2025, so no company would be immune.
As mentioned above, I am still a holder at $86.74. However, I went in much heavier within my "major crash" simple moving average band and have a final entry planned near $38-$38 (if it drops there). My current cost average is near $55.00.
Why do I still have faith in NYSE:NVO ? Because no one else does right now, yet it generated $42 billion in revenue, $14 billion in profits, and has significant cash flow YoY. The company has a massive pipeline, despite Wegovy and Ozempic competition, and I think the market is undervaluing its position in the pharmaceutical industry.
Revised Targets in 2028:
$60.00 (+25.6%)
$70.00 (+46.5%)
$80.00 (+67.4%)

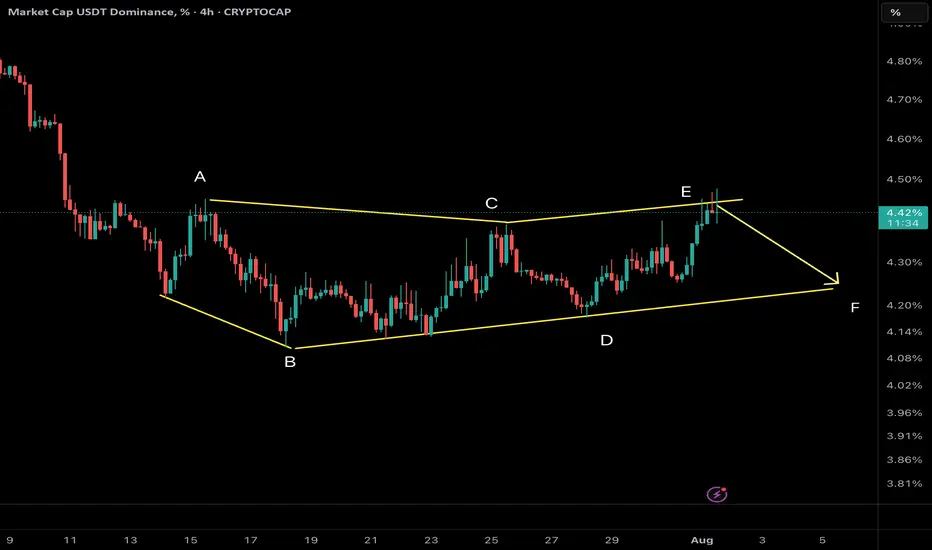
USDT Dominance – Potential Wave F Reversal?
We are tracking a NeoWave Diametric formation (7-leg corrective structure: A–B–C–D–E–F–G) on the USDT Dominance chart. Recently, price reached the projected resistance zone of wave E, and early signs of reversal are emerging.
⸻
🧠 Structural Analysis:
• The structure has developed with alternating legs in price and time, consistent with the symmetrical diametric rules.
• Wave E has likely completed, reacting from prior supply and resistance.
• A pullback from here can mark the beginning of Wave F, which in diametrics tends to retrace significantly toward the internal balance of the structure.
⸻
🔍 What to Watch:
• Confirmation of bearish intent via a break of internal supports or lower-timeframe BOS.
• Possible retracement targets: 4.2% → 3.95%, depending on momentum.
• A decisive break below 4.00% would reinforce the wave F scenario.
⸻
⚠️ Implications for the Crypto Market:
A drop in USDT Dominance typically indicates rotation into risk assets (alts/BTC/ETH). However, context matters — if the drop happens during a general market sell-off, it may reflect risk-off unwinding into fiat, not risk-on rotation.
⸻
🔄 Strategy Note:
• Avoid premature shorts or longs; wait for structure to confirm.
• Watch for smart money traps (e.g., false breakouts or liquidity grabs) around the recent highs.
⸻
📌 This is a high-risk zone for entering long USDT.D — be cautious with stablecoin bias.
📊 Analysis by CryptoPilot – Precision through structure.
Those daily +20% to +30% candles soon will appear!!Those Fibonacci levels which are last supports for healthy & #Bullish market are all touching i mean the 0.218$(0.5 #Fibonacci) & 0.202(0.61 #Fibonacci) and i think these supports are strong enough to stop the correction and soon again it will pump and even can break daily high near 0.42$ and hit targets like 0.5$ and 0.75$.
DISCLAIMER: ((trade based on your own decision))
<<press like👍 if you enjoy💚

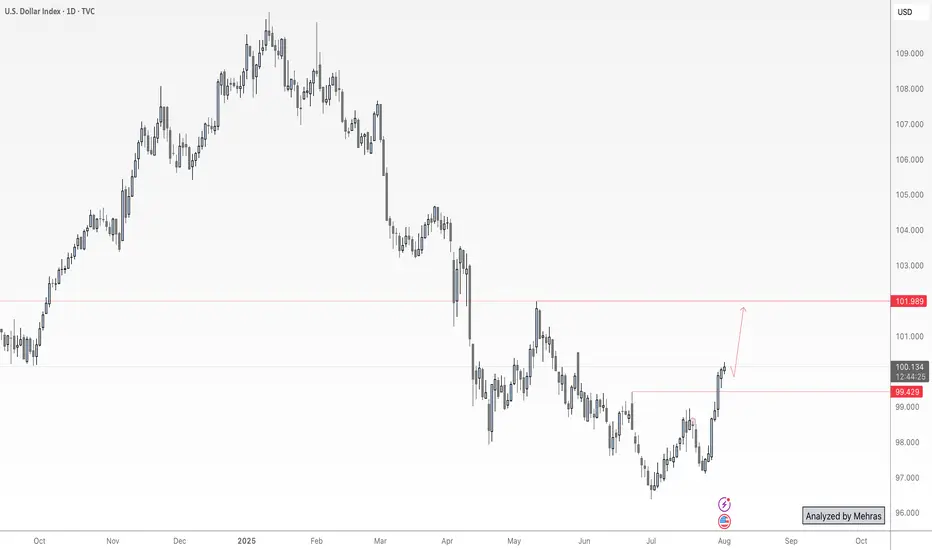
NFP Volatility Ahead – Is the Dollar Ready to Break Higher?🟢 DXY Outlook – A Key Day for the Dollar Index
Yesterday’s monthly candle closed with strong bullish momentum, marking a powerful start to August. Today, on the first trading day of the month, we’re expecting three major U.S. economic releases:
NFP, Average Hourly Earnings (m/m), and the Unemployment Rate.
As discussed in last week’s outlook, DXY has successfully broken above the key 100 level and confirmed a monthly close above it — a significant technical development. With no major order blocks or visible resistance in the way, the path toward the 102 target appears technically clear.
That said, I anticipate mixed data from today’s releases — which means we could see both sides of liquidity being taken during the initial reaction. Price might dip toward lower zones temporarily to collect liquidity before resuming its bullish move toward 102.
📌 In summary:
From a swing perspective, I believe the direction remains bullish for the Dollar Index as long as we hold above the 100 level.
When I say the data might be “mixed,” I mean the market could show an initial drop toward lower zones at the time of release — not because of a reversal, but to grab liquidity before continuing higher toward the 102 target.
Unless we see something unexpectedly extreme in the numbers, I expect the DXY to remain on track to reach the 102 level in the coming days or next week.
🔁 This analysis will be updated whenever necessary.
Disclaimer: This is not financial advice. Just my personal opinion.
Kas short to $0.0816Just now opened a short on KAS.
Sl: $0.08749
limit entry: $0.08548
Tp: $0.0816
Risk to reward: 1:2
DTT analysis applied - learn more on X

ETHUSDTPossible short on ETH, as we know this might be a news dump that caused this blood in the market and might recover very soon, but we broke a key support level, this is the 4HR chart and we will have a better idea what's on the table when weekly close.

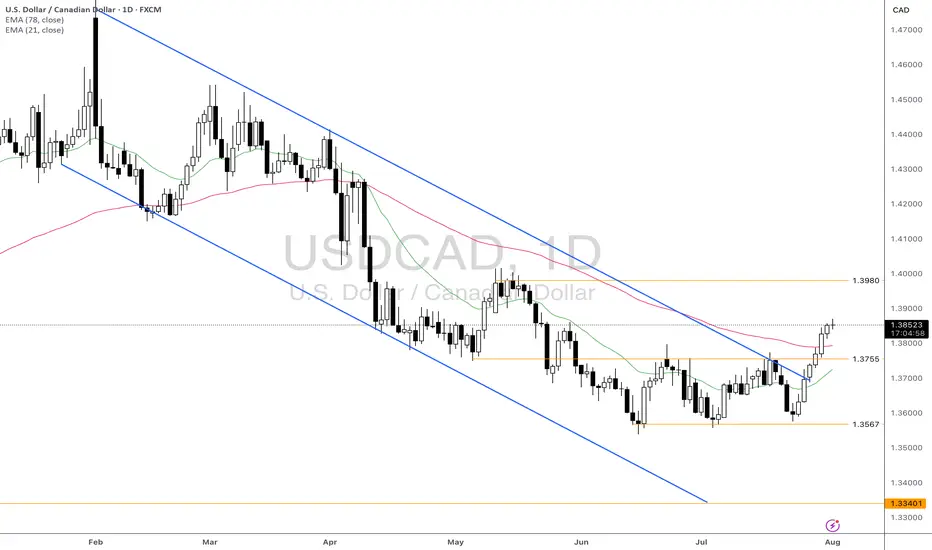
Will the Canada-US Trade Tension Continue to Impair CAD?Fundamental approach:
- USDCAD advanced this week, supported by broad US dollar strength and renewed trade tensions as the US announced higher tariffs on Canadian imports.
- The pair was further buoyed after the BoC left rates unchanged and signaled caution amid persistent core inflation and ongoing trade negotiations.
- Meanwhile, US labor data indicated that job openings were moderating growth while tariff-related uncertainty weighed on risk sentiment.
- The BoC’s decision to keep its policy rate at 2.75% cited domestic economic resilience and the unpredictable US trade policy outlook.
- At the same time, negotiations between Canada and the US over trade terms remained in an “intense” phase, with additional tariffs entering effect 1 Aug, adding to downside risks for the Canadian economy.
- USDCAD may remain elevated next week as markets monitor follow-through from new tariffs and assess further data on US jobs and Canadian trade. Potential progress or setbacks in Canada-US trade talks and upcoming economic releases could influence direction, while central bank policy signals and risk appetite will remain key catalysts.
Technical approach:
- USDCAD formed a Triple-bottom pattern at around 1.3567 and bounced up to break the neckline at 1.3755. The price also broke the descending trendline and closed higher than both EMAs, indicating a potential trend reversal.
- If USDCAD remains above the support at 1.3755 and both EMAs, the price may retest the resistance at 1.3980.
- On the contrary, closing below the support at 1.3755 and both EMAs may lead USDCAD to retest the key support at 1.3567.
Analysis by: Dat Tong, Senior Financial Markets Strategist at Exness
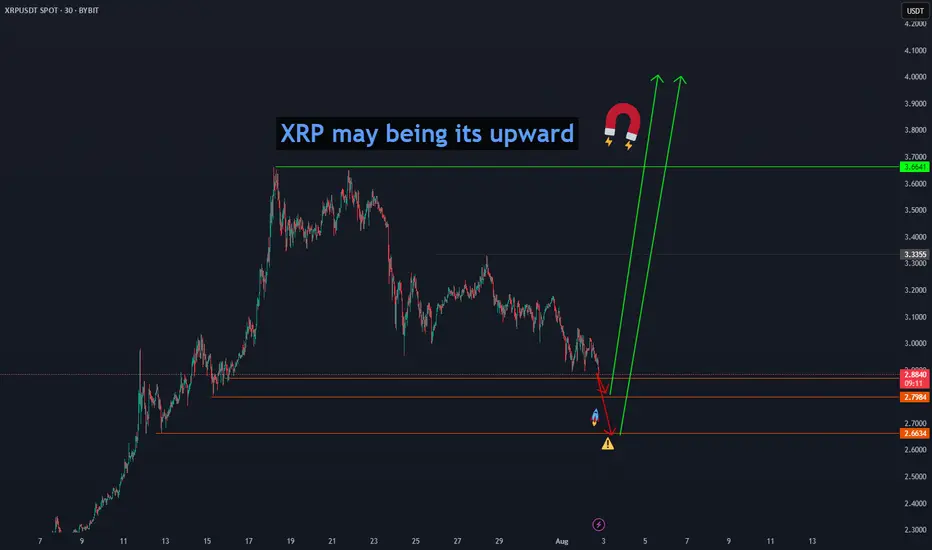
XRP may being its upward" Ripple (XRP) may begin its upward move from the price levels of 2.8865, 2.7984, and 2.6634, aiming for a first confirmed target at 3.6641 and then $4." BINANCE:XRPUSDT
BTCUSD The Week Ahead Key Support and Resistance Levels
Resistance Level 1: 119,000
Resistance Level 2: 121,030
Resistance Level 3: 122,862
Support Level 1: 111,683
Support Level 2: 110,450
Support Level 3: 108,720
This communication is for informational purposes only and should not be viewed as any form of recommendation as to a particular course of action or as investment advice. It is not intended as an offer or solicitation for the purchase or sale of any financial instrument or as an official confirmation of any transaction. Opinions, estimates and assumptions expressed herein are made as of the date of this communication and are subject to change without notice. This communication has been prepared based upon information, including market prices, data and other information, believed to be reliable; however, Trade Nation does not warrant its completeness or accuracy. All market prices and market data contained in or attached to this communication are indicative and subject to change without notice.

The Great XRP Escape Plan: Thief Strategy Deployed🌀 XRP/USDT – Thief Trader’s Master Heist Plan: Crack the Vault Before They Catch On! 🧠💰
🔐💸 Operation Code: Ripple Raid 3.9 - Eyes on the Prize, Hands on the Trigger 💥
🌍 Attention Global Market Robbers and Strategic Money Movers!
This ain't just another analysis—this is the Thief Trading Style Blueprint, surgically designed for the XRP/USDT Crypto Market. Whether you're a silent sniper or full-squad raider, this trade setup is your next high-voltage money heist.
🔍 Market Breakdown:
📊 Technical + Fundamental = Robbery Precision
Currently, Ripple (XRP) is showing bullish fuel—charging into our trap-the-bears zone. Volatility is tightening, resistance is trembling, and it smells like liquidity is about to get stolen.
⚠️ Warning: The market’s at a risky cross-zone – overbought with heavy consolidation – where big bears and trapped traders usually play defense. That’s exactly where we strike.
🔓 Entry Gameplan – “Wait, Trigger, Execute”
📈 Entry:
"The heist begins when the candle breaks the high and screams confirmation!"
Set Buy Stop Orders above the recent resistance (around 3.1000).
Alternatively, use Buy Limit Orders on pullbacks at key swing levels (15M or 30M timeframes).
We use a multi-layered entry strategy (aka DCA + stacking like a pro thief stacking vaults). Be surgical. Be patient.
📌 Pro Tip: Always set a chart alert at the trigger zone to avoid missing the breakout party.
🛑 Stop Loss – “Breakout First, Then Talk Safety”
🚫 NO SL BEFORE BREAKOUT. Period.
Once price breaks out, then:
🔐 SL = Nearest 4H candle wick swing low (around 2.8000).
But remember, your SL = your risk appetite.
Whether you're placing 1 big order or 10 mini traps, manage it smart.
🎯 Target – "Get Rich, Then Vanish"
🏴☠️ Primary Take Profit Zone:
Target: 3.9000
Or exit anytime you see signs of reversal.
Don't get greedy—get paid.
👀 Scalpers’ Note:
Only play the Long side.
If you're deep-pocketed, dive in straight. If not, ride with swing traders and trail your SL to protect profits.
🔥 Why This Trade is 🔐:
📈 Current price structure, liquidity zones, and momentum favor bulls.
📊 Correlated intermarket signals + on-chain activity + macro backdrop align with XRP strength.
🧠 Smart money accumulation is visible – this is your window before the big breakout.
🚨 News & Position Management Alert:
📢 Stay clear of opening trades during major news events.
Use Trailing Stop-Loss on running positions to lock gains while letting profits fly.
This is not hype. This is precision.
Thief Trader doesn’t guess – we plan, we trigger, we exit.
📌 Final Words:
Whether you're scalping seconds or swinging for days – follow the blueprint. XRP has a vault to crack, and we’re here to rob it clean.
Now go out there, set those traps, and let the market pay you like it owes you.
🧠💸🕶️ Next Heist Plan Coming Soon… Stay Sharp.
