LTCUSD Possible Scenario breakout of trendline resistanceLTCUSD is at major support and has now broken the resistance and price will likely will move up.
Trend Analysis

ETH/USDT | ETH Under Pressure – Watch $3500 Support!By analyzing the Ethereum chart on the weekly timeframe, we can see that after reaching the $3940 zone, ETH faced selling pressure and is now trading around $3540. If the price fails to hold the key $3500 support, a deeper decline is likely, with potential targets at $3040 first and possibly $2680 as the second bearish target.
Please support me with your likes and comments to motivate me to share more analysis with you and share your opinion about the possible trend of this chart with me !
Best Regards , Arman Shaban

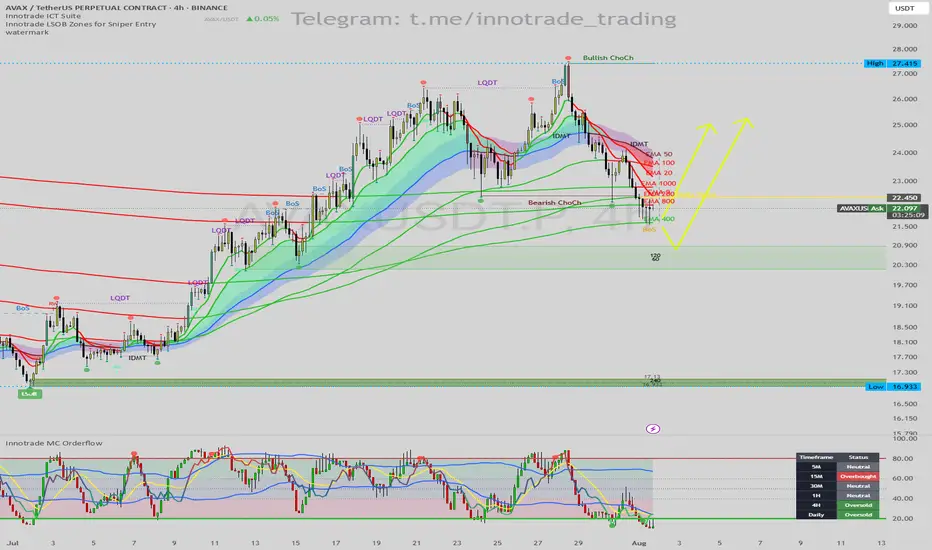
AVAX/USDT: Bullish Reversal at MA Support & Daily OversoldHello traders,
Today's analysis focuses on a high-probability long setup for AVAX/USDT on the 4H timeframe. The price has pulled back to a critical area where a confluence of powerful technical indicators suggests a significant bounce or reversal is imminent.
1. Trend & Context (The "Why")
Following a strong uptrend, AVAX entered a corrective phase, marked by a Bearish Change of Character (ChoCh). This correction has now brought the price to an A+ support zone.
Here are the key confluences for this bullish setup:
Major Support Cluster: The price is currently reacting to a critical support cluster formed by the EMA 200 and EMA 400. These long-term moving averages are major levels where institutions often step in to buy.
Momentum Exhaustion (MC Orderflow): The Innotrade MC Orderflow oscillator provides the critical confirmation that selling pressure is exhausted:
The oscillator is deep in the OVERSOLD territory on the 4H chart.
THE CRITICAL MTF CONFLUENCE: The Multi-Timeframe Cycle Table is the most important factor here. It shows that both the 4H and Daily timeframes are "Oversold". This alignment of higher timeframe momentum at a key technical support level is a very powerful signal for a reversal.
2. Entry, Stop Loss, and Targets (The "How")
The alignment of these factors gives us a clear and actionable trade plan with a great risk-to-reward profile.
Entry: An entry around the current price ($21.50 - $22.10) is ideal, as we are right at the MA support cluster.
Stop Loss (SL): $21.20. This places the stop loss safely below the EMA 400 and the recent swing low, providing a clear invalidation point for the setup.
Take Profit (TP) Targets:
TP1: $24.00 (Targeting the Bearish ChoCh level and the cluster of short-term EMAs).
TP2: $26.50 (The next major swing high, a logical area of resistance).
TP3: $27.40 (The major high of the entire range, a longer-term target if the uptrend resumes).
Conclusion
This trade setup is of very high quality due to the powerful confluence of a major MA support cluster with a confirmed multi-timeframe momentum exhaustion signal (4H and Daily). This synergy creates a high-probability environment for a significant bullish reversal.
Disclaimer: This is not financial advice. This analysis is for educational purposes only. Always conduct your own research and manage your risk appropriately.
Solana coin Long setupIn this video I go through the current price action and talk about how the 126$ target level was recently reached for a clean long entry and on the daily timeframe we printed a higher low .
I expand on my thoughts for a continuation to the upside and to retest some higher levels of resistance 180$s and time will tell if we print a higher high at the 180$s before retesting the $200 zone .

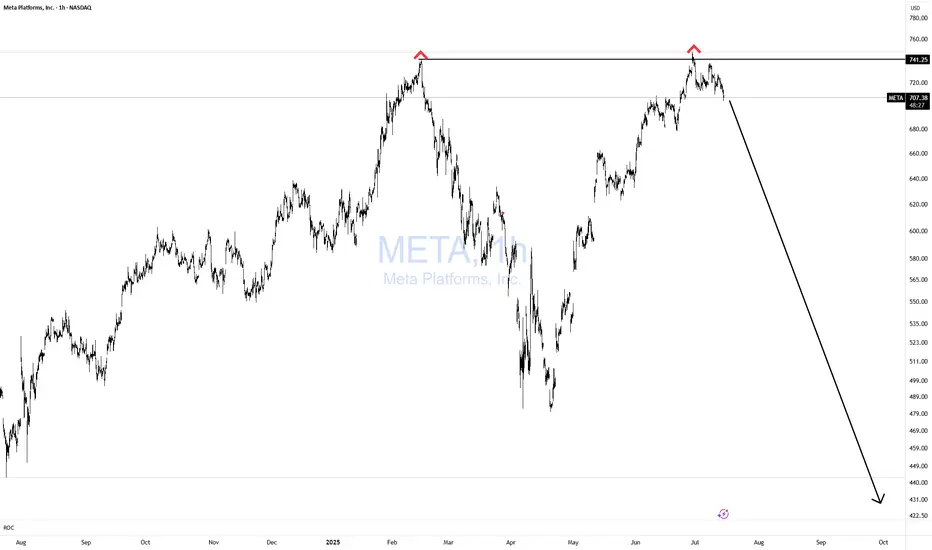
META Double Topping!Does it get any easier than this? NOPE!
If you can't spot this pattern from 1000 miles away, then you need a lot more time in the seat, training yourself in TA.
Simple with great risk reward!
Bulls GTFO!
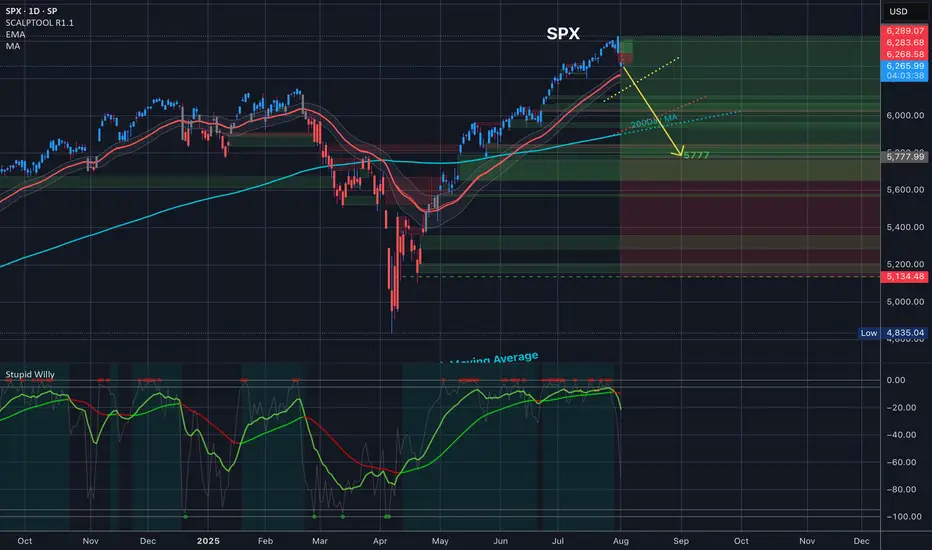
$SPY $SPX 5777 Target for end of AugustAMEX:SPY SP:SPX 5777 Target for end of August
What do you guys think here?
SSGC – BUY SIGNAL | 01 AUGUST 2025SSGC – BUY SIGNAL | 01 AUGUST 2025
The stock recently broke out of a bearish channel (marked light pink) and made a high of Rs. 47.41. Since the breakout, it has been undergoing a lateral pullback, which now appears to be complete based on the volumetric profile and recent price action. With momentum shifting back in favor of buyers, SSGC is poised for the next leg upward.

Ascending Channel Bounce – Long SetupAscending Channel Support Test – Potential Reversal Setup 📈
Price has just tested the lower boundary of the ascending channel and reacted strongly, signaling potential buying interest at this level.
RSI is hovering near the oversold zone, adding confluence to a possible bullish reversal scenario.
Trade Idea:
Entry: 0.89
Target 1: 1.178
Target 2: Previous swing high at 1.69
Stop-loss: Below the channel support breakout
A break and hold above 1.178 could pave the way for a continuation toward the previous high. Watching for volume and bullish candlestick confirmation before adding to the position.
#TechnicalAnalysis #AscendingChannel #RSI #CryptoTrading #ChartPatterns #PriceAction #TradingSetup #BullishScenario #SupportAndResistance #SwingTrade #CryptoSignals

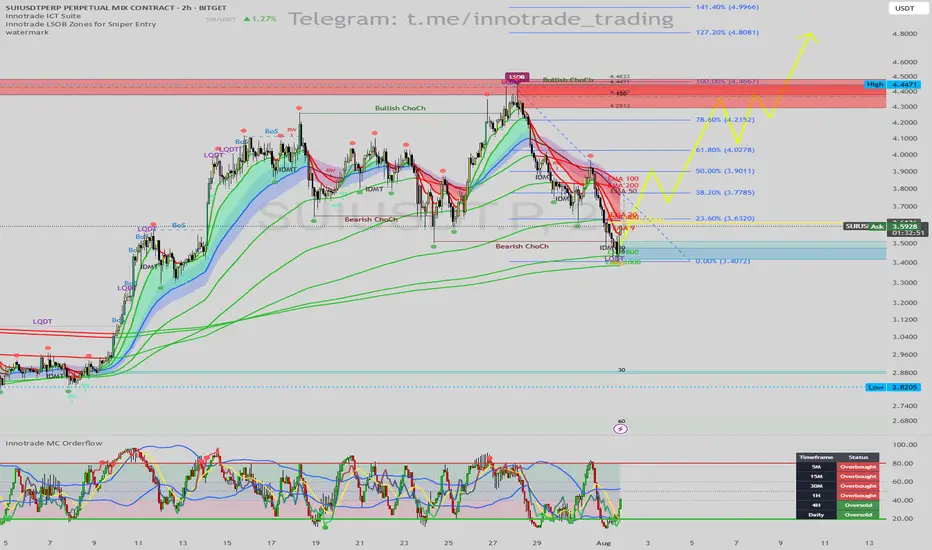
SUI/USDT: Prime Long Setup from LSOB Demand & Daily OversoldHello traders,
This analysis highlights a high-probability long setup on SUI/USDT (2H Chart). The current price action presents a classic institutional-style reversal pattern, strongly confirmed by momentum indicators signaling a bottom may be in.
1. Trend & Context (The "Why")
While the short-term trend has been corrective after a "Bearish ChoCh," price has now entered a major area of interest where a powerful bullish move could originate.
Here is the confluence checklist:
Primary Signal (LSOB Zone): Price has tapped into a key Bullish LSOB (Liquidity Sweep Order Block). This is a critical demand zone where smart money is likely to absorb selling pressure and initiate long positions.
Liquidity Sweep Confirmation: The price action confirms this with a clear Liquidity Sweep (LQDT), where the price wicked down to take out stops below the previous lows before reversing. This is a very strong bullish signal.
Momentum Exhaustion (MC Orderflow): This is where the setup gains its highest conviction:
The MC Orderflow oscillator is in the EXTREME OVERSOLD territory, indicating that sellers are exhausted.
CRITICAL MTF CONFLUENCE: The Multi-Timeframe Cycle Table is showing that both the 4H and Daily timeframes are "Oversold." This alignment of higher timeframe momentum with our 2H demand zone is the most powerful confirmation for this trade.
2. Entry, Stop Loss, and Targets (The "How")
This confluence provides a clear and structured trade plan with excellent risk-to-reward potential.
Entry: An entry around the current price ($3.50 - $3.58) is ideal, as we are in the LSOB demand zone. For a more conservative entry, one could wait for the 2H candle to close bullishly.
Stop Loss (SL): $3.38. This places the stop loss just below the low of the liquidity sweep wick. If this level is broken, the bullish setup is invalidated.
Take Profit (TP) Targets:
TP1: $3.90 (Targeting the cluster of short-term EMAs and the recent swing high).
TP2: $4.28 (The next major structural resistance).
TP3: $4.45 (The major swing high, which is also a Bearish LSOB supply zone).
Conclusion
This trade presents a superb opportunity due to the powerful combination of a price-action sweep into a key demand zone (LSOB), confirmed by severe multi-timeframe momentum exhaustion. This alignment across indicators points towards a high-probability bullish reversal.
Disclaimer: This is not financial advice. This analysis is for educational purposes only. Always conduct your own research and manage your risk appropriately.
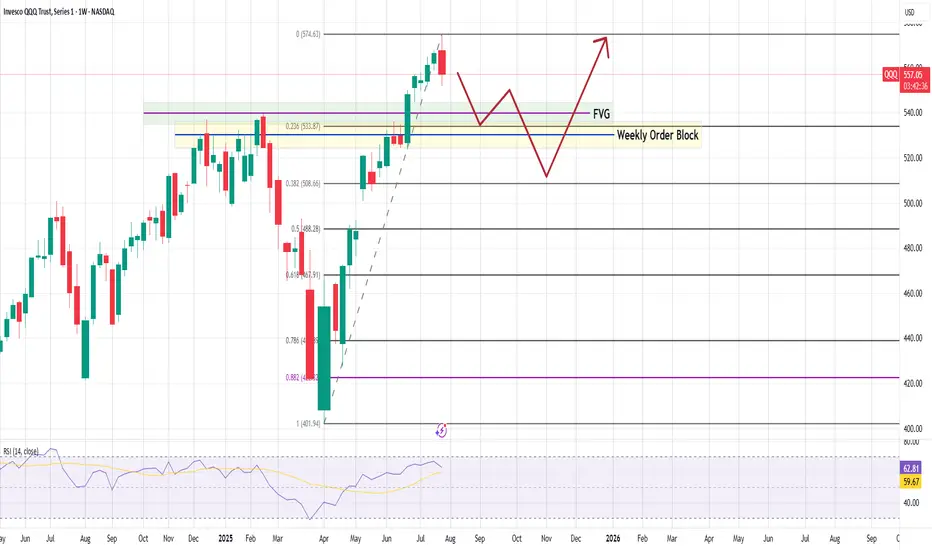
#QQQ Weekly Chart – Technical Breakdown As of August 1, 2025QQQ Weekly Chart – Technical Breakdown
🧠 Key Observations
Bearish Weekly Rejection
A red candle at the recent high ($574.63) suggests buyers are taking profits.
Short-term reversal likely in play.
First Reaction Zone:
0.236 Fib at $533.87 is the first potential bounce zone.
Aligned with:
Fair Value Gap (FVG)
Upper range of the Weekly Order Block (OB)
Deeper Demand Zone:
If $533 fails, the Weekly Order Block becomes critical.
That zone stretches down toward $520–$508 (Fib 0.382).
Strong historical reaction area — may attract long setups if macro aligns.
RSI Divergence Risk:
RSI shows some signs of flattening.
Still above 59, so momentum is intact — but weakening.
📉 Pullback Path (Base Scenario):
Potential move to $533 → $520, consolidating inside the order block
From there, bullish continuation back toward $575+
Invalidated below $500, where structure breaks
📈 Mid-Term Bullish Bias Intact
Strong uptrend, higher lows still in place
Any dip into the OB + FVG zone = buy-the-dip opportunity.
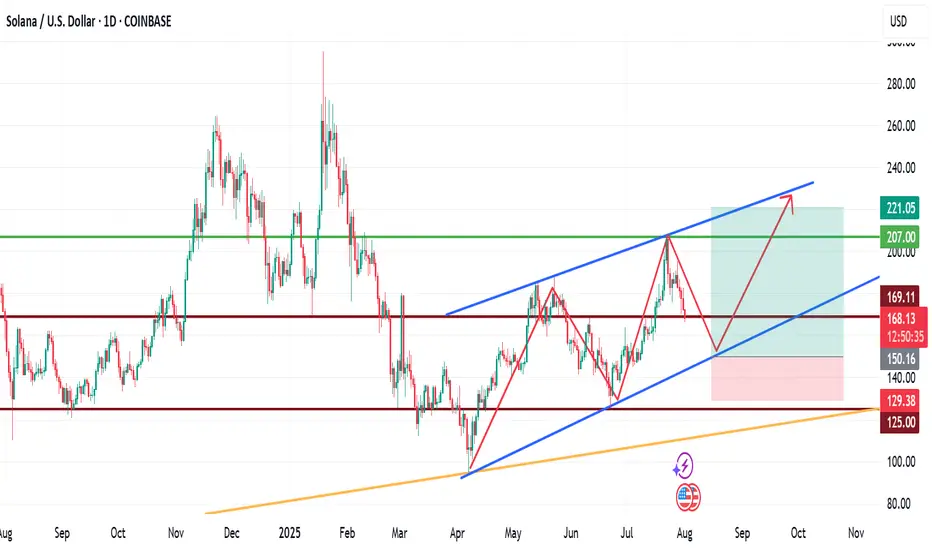
My View for SOLANA next moveMy View for SOLANA next move.
Technically, SOL has been trading within a channel for a while now, with the formation of HHs and HLs.
If fundamentals play out positively long to mid-term, we are likely to see SOLNA fall to $150 zone before another upward leg forms. This leg may rally to as high as $220.
Trade with care.
If you found this helpful, please connect with me.
Like, comment and share
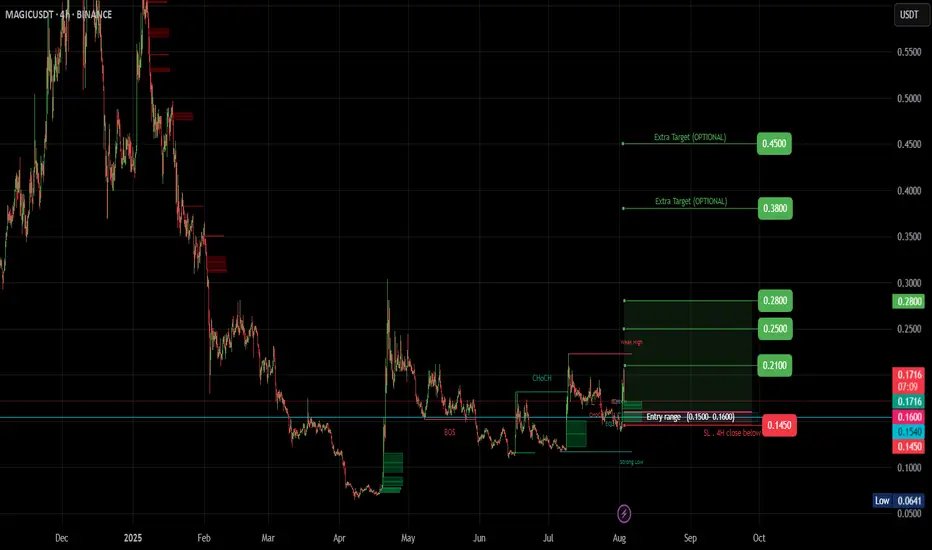
MAGIC (SPOT)BINANCE:MAGICUSDT
#MAGIC / USDT
Entry range (0.150- 0.160) **** Wait for the price to come to the entry range ****
SL 4H close below 0.145
T1 0.210
T2 0.250
T3 0.280
Extra Targets
T1 0.380
T2 0.450
_______________________________________________________
Golden Advices.
********************
* collect the coin slowly in the entry range.
* Please calculate your losses before the entry.
* Do not enter any trade you find it not suitable for you.
* No FOMO - No Rush , it is a long journey.
dYdX Bottom Consolidation Continues, Bullish NextHere you are looking at the formation of a bottom. The formation is a process not a single day event. It can take months for a bottom to fully form.
The way you know this to be true is because there is no downtrend. There are no new lows.
DYDX has been sideways now for 179 days, 6 months. Since early February 2025. In just three months, between December 2024 and March 2025, there is a very strong decline; lower highs and lower lows. A bearish move, a down-wave, a downtrend.
Ever since February the downtrend is no more. Rather than new major lows we have shy lower lows and finally not even that, no new lows. You can see the pattern how the market turned from bearish to sideways. This is the transition period. From sideways it will turn bullish, bullish goes next.
This is the point in time when most people will lose patiently and fold at a loss. Sell at the bottom, near support. This is the most important time to be patient, to accumulate, to even buy more and hold because we are looking at bottom prices. When prices are trading at the bottom and you are a bull, you can't go wrong.
Buy and hold. Continue holding because the market will soon turn.
Namaste.

Could this be the end of Bitcoin’s trend?The Current State of Bitcoin’s Trend: Has the Uptrend Come to an End...?
Based on recent analyses, Bitcoin has exited its 4-hour channel over the past few days, and there is still a possibility for further correction. However, this does not mean that the uptrend for Bitcoin is over.
My targets for Bitcoin remain the same as before: 123,700 and 129,710. It’s even possible that we might see a wick above these prices.
For those with more capital who are looking to buy Bitcoin, there are two good entry levels:
110,880
109,770
Everything else is clearly shown on the chart. Please be cautious, as there will likely be high volatility once the market opens.
Be sure to open the analysis link and boost the analysis with your likes.

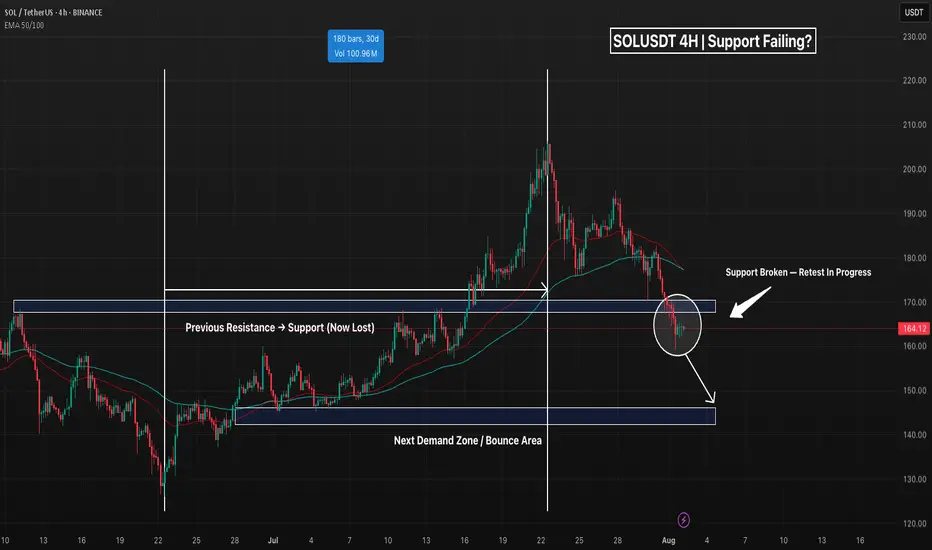
SOL - Support Broke, Is This Just a Retest Before The Pump?Solana just lost a key structural level on the 4H chart — the former range high (~163–166), which had acted as resistance throughout June and flipped to support in mid-July. Price is now sitting just below this zone, forming a weak retest without any real bullish momentum.
This setup often leads to trap scenarios: either a fast reclaim (bullish deviation) or a clean continuation to the next demand. So far, the price is holding below the EMAs and failing to reclaim lost ground — not a bullish look.
📌 Confluence for Further Downside:
Break and close below prior support
EMA 50/100 acting as dynamic resistance
No bullish divergence present (if RSI confirms)
Weak volume on current bounce attempt
If sellers stay in control, eyes are on the next demand zone around 144–146, which supported the last major breakout. Conversely, a clean reclaim above 166 and back inside the range would flip bias neutral-to-bullish.
Bias: Bearish unless 166 is reclaimed
Invalidation: Break above 177–180 (EMA cluster)
Next Key Support: 144–146
Potential Setup: Short on failed retest / Long on demand reaction
Do you see this as a breakdown or a trap? Let me know 👇
ETHUSD The Week Ahead Key Support and Resistance Levels
Resistance Level 1: 3677
Resistance Level 2: 3752
Resistance Level 3: 3833
Support Level 1: 3485
Support Level 2: 3400
Support Level 3: 3316
This communication is for informational purposes only and should not be viewed as any form of recommendation as to a particular course of action or as investment advice. It is not intended as an offer or solicitation for the purchase or sale of any financial instrument or as an official confirmation of any transaction. Opinions, estimates and assumptions expressed herein are made as of the date of this communication and are subject to change without notice. This communication has been prepared based upon information, including market prices, data and other information, believed to be reliable; however, Trade Nation does not warrant its completeness or accuracy. All market prices and market data contained in or attached to this communication are indicative and subject to change without notice.

XRP VS AI ?Hi,
This is fun, come on XRP $4.95
Average Speed (Points/Day) 0.053
Retracement Amount (Points) 0.80
Retracement % 51.28%
Probability of Retracement % 5-10%
Projected Next Move Size (Points) 2.09
Next Projected High Price 4.95
Estimated Duration to Next Target 39.4 days
Projected End Date 2025-09-10
All the best
Not a guru

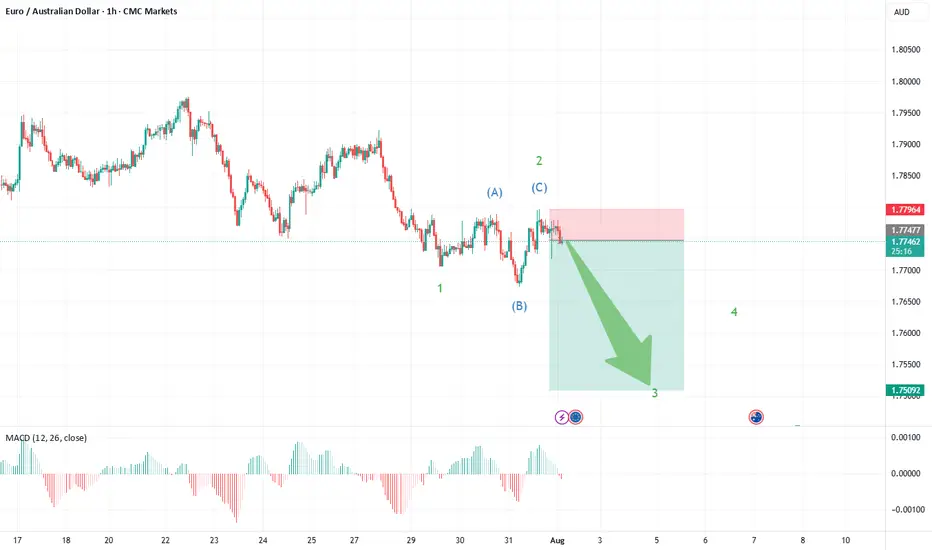
EUR/AUD: Short Setup Forming—Is the Downside Just Beginning?EUR/AUD is flashing the early signs of a new short trading opportunity, with the latest chart pointing toward a fresh move lower as the corrective phase may be wrapping up.
What the Current Structure Shows (Primary Scenario)
Corrective Pattern Complete: The strong advance off the May 14th, 2025 lows at 1.7247 unfolded as a classic double zigzag (WXY), culminating at recent highs. Price action has since reversed and formed an initial impulse down—clear evidence that the correction may be over.
Wave 1 Down, Expanded Flat for Wave 2: The chart now displays a completed wave 1 on the downside, followed by an expanded flat for wave 2—where price retraced upward but failed to break the previous peak, a sign of fading bullish momentum.
The recent structure shows a sharp, impulsive move down (wave 1), fitting Elliott Wave expectations for a new trend immediately after a complex correction.
The expanded flat for wave 2—where the B wave exceeded the start of A and C pushed higher—typically heralds a strong, extended wave 3. This supports a bearish outlook from current levels.
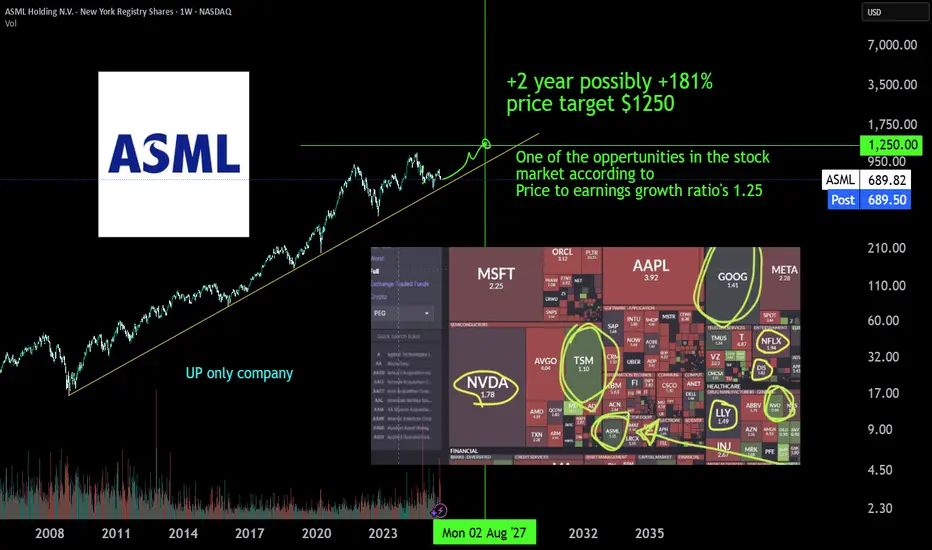
ASML monopolist, a +181% | 2Y oppertunityASML is the monopoly Extreme ultra violet machinery company. There is no one close to it's technology or there is no one investing enough to R&D a thing like it. The whole AI datacenter and cloud chip growth depends on EUV machinery of ASML developed in 2013 (>10y of PhD level R&D deveopment). The first new High-NA EUV systems have been deployed at Intel in July 2025 for research purposes and will scale just like the EUV already does to keep pace with moore's law. TSMC has stated it will not yet buy & depoly the newest machines jet, but has to expand with the 10 year older tech EUV machines just to get the AI chip demand going. AI chip demand at NVIDIA is growing harder than expected comfirmed by latest earnigns of alphabet, microsoft, meta and amazon. The whole AI data center growh depends on 2013 asml tech machines, and they already have a new tech High-NA EUV machine, just figure.
Also don't sleep on BESI a packing machinery wonder, due to hybrid bonding which makes stacking 3D chip structures possible.
#GoHighTechNetherlands
GBPUSD: Bearish Continuation & Short Signal
GBPUSD
- Classic bearish setup
- Our team expects bearish continuation
SUGGESTED TRADE:
Swing Trade
Short GBPUSD
Entry Point - 1.3264
Stop Loss - 1.3287
Take Profit -1.3218
Our Risk - 1%
Start protection of your profits from lower levels
Disclosure: I am part of Trade Nation's Influencer program and receive a monthly fee for using their TradingView charts in my analysis.
❤️Please, support our work with like & comment! ❤️

Gold Showing Signs of Reversal After Hitting Key ResistanceHello Guys.
Gold has reached a major resistance zone around 3439–3425, which has already acted as a strong ceiling in the past. The price tapped into this area again, forming a clear divergence, and failed to break higher.
Here’s what stands out:
Divergence signals a weakening bullish momentum at the top.
The price rejected the resistance and is now breaking structure to the downside.
A minor pullback may occur before continuation, as shown in the projected moves.
First target: 3259.792
Second target (if support breaks): 3136.869, a deeper zone for potential bounce or further drop.
This setup hints at a bearish trend building up. Stay cautious on longs unless the price structure changes again.

GBPUSD MULTI TIME FRIME ANALYSISBased on the TREX method, this analysis is expected to be bearish, but the market is 50-50 and the pound may break the zone and rise.
If the sound quality is bad, forgive your greatness.

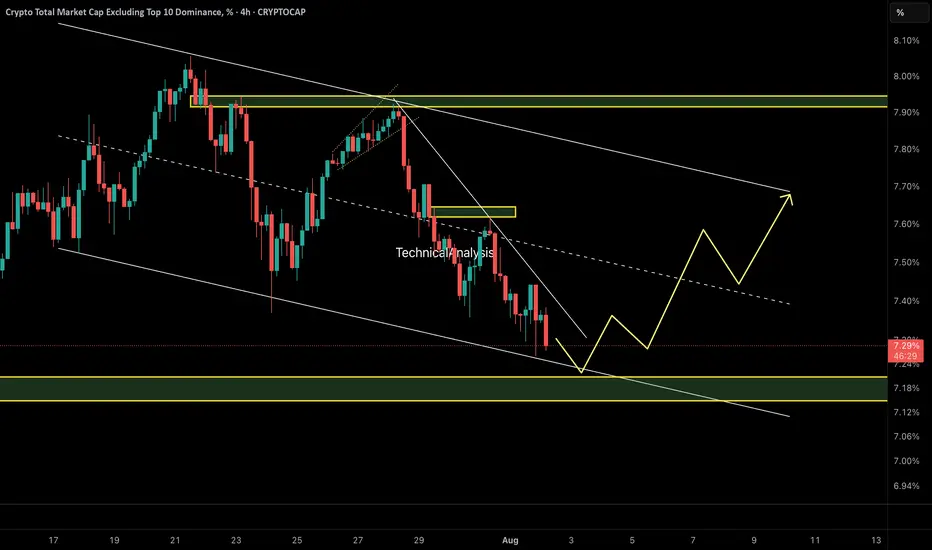
OTHERS.D – Perfect Reaction to Previous AnalysisAs predicted in the last update, OTHERS.D broke structure and dropped sharply toward the 7.20% demand zone — exactly as expected.
Now, we’re waiting for a potential bullish reaction from this key area. If demand holds, a move toward the upper channel boundary (~7.70%) could follow.
🧭 Technical Outlook:
• Price tapped into a key demand zone at 7.20%, which aligns with the lower boundary of a descending channel.
• A bullish reaction is forming, suggesting short-term strength in altcoins.
• A move toward the channel top near 7.70% is now on the table if demand holds.
⚠️ Important Note:
This move is likely to remain a corrective rally unless we see a proper breakout above 7.70% with volume and structure shift. Be selective with altcoin longs.
🔍 Watch for:
• Reaction at 7.50% midline
• Price behavior at 7.70% resistance
• Structure shift or failure pattern near channel top
⚠️ Caution: This remains a corrective rally unless price breaks 7.70% with structure shift.
🔗 Analysis by CryptoPilot