Major Warning: Bitcoin Breaches Key Support with Bearish SignalsBitcoin has officially broken down from its recent consolidation zone, closing below the critical 21 EMA on the daily chart. This move, combined with reversal signals on both the weekly and daily timeframes, suggests that downward pressure is intensifying.
In this video, I’ll walk you through:
• The candlestick patterns signaling reversal
• The significance of the 21 EMA breach
• Confirmed divergences from key indicators
• What this means for short-term and long-term price action
Whether you're holding Bitcoin or trading around it, this is a pivotal moment. The charts are speaking—are you listening?
Trend Analysis

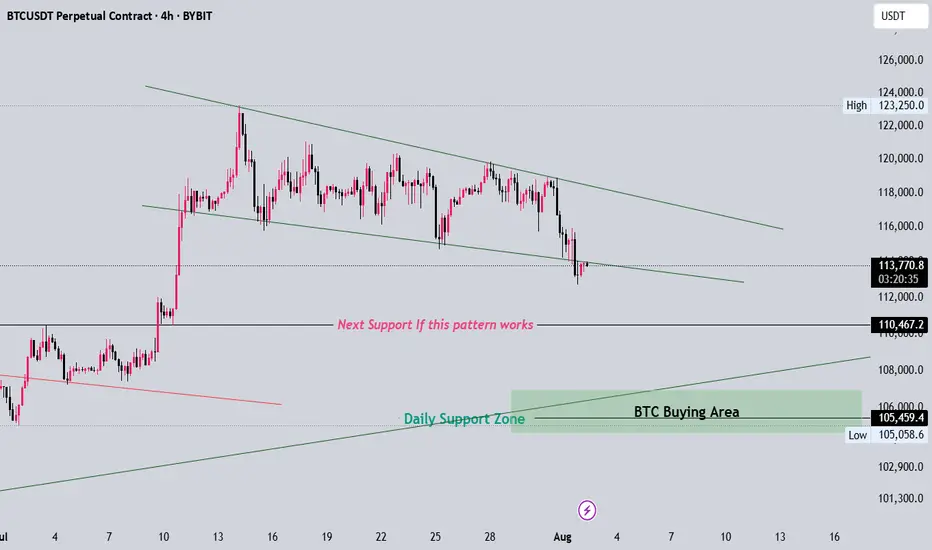
BTCUSDT 1D – Retesting Key Support, Will Bulls Hold the Line?Bitcoin is retesting a crucial structural support level around $112K after its recent local top near $120K. This zone previously acted as resistance and is now being tested as support — a textbook bullish continuation signal if it holds.
Historically, these flips (from resistance to support) have triggered strong upside momentum, as seen after the $78K breakout earlier this cycle. However, failure to hold this level could open the door for a deeper correction toward $100K or even the $90K region.
This chart outlines the major structural zones:
Long-term accumulation base near $70–78K
Resistance flip zone at $110–112K
Local resistance near $120K
📌 If bulls defend this zone and reclaim momentum, we could see another push toward cycle highs. If not, patience is key — the next high-conviction entry may come lower.
How are you positioning around this zone? Let me know in the comments 👇

GBPUSD : NEW WEEK TECHNICAL BIAS (MARKET OPEN)CONTEXT
(Strictly Technical Outlook – No Fundamental Overlays)
▪︎ Higher Timeframe (HTF) Price Action from the previous week signals a potential pullback or reversal, as last month closed with a strong bearish momentum candle.
▪︎ However, the broader bullish structure remains intact — current Descend Sequence is interpreted as a corrective leg into discounted territory.
▪︎ I anticipate price to trade lower into the Monthly Price Inefficiency Zone (M-PIZ) and further toward the discount zone of the prevailing price leg.
▪︎ A rally toward the 1.33502 – 1.34014 region would offer a high-probability zone for short setups. A sweep or reclaim of 1.31739 may precede this rally.
▪︎ The premium OCZ appears unlikely to be reached — unless employed as a Trap.
▪︎ Downside targets include:
i. Monthly PIZ
ii. 1.29442 and potentially levels below
Invalidation:
Bearish setup will be invalidated if price trades above 1.36942 with microstructure confirming an Ascend Sequence continuation.
Note: Bias is developed strictly from chart structure using IntelEdge Technical Protocol – no fundamental overlays included.
📌 Disclaimer: is a strategic directional bias, not financial advice. Execute only with confirmation and proper risk management.

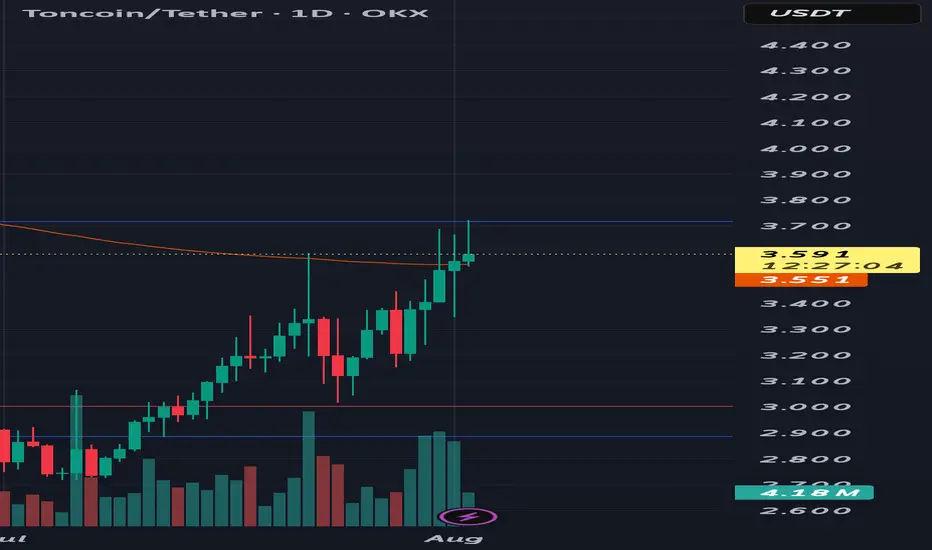
Up only desuTon has crashed a lot from its all time high and it seems to be rebounding now. Today will be the fifth daily green candles in a row and yesterday's daily closed above EMA 200
IN ADDITION TO THIS
Some bullish news for Ton i found from elfabot
The recent surge in CRYPTOCAP:TON price is primarily attributed to strong ecosystem activity, including significant NFT purchases by Pavel Durov (Telegram’s founder), such as buying a Plush Pepe NFT for 15,000 TON (about $53,000), which has boosted market confidence and demonstrated TON’s real-world utility. This has been widely discussed in the crypto community and cited as a bullish catalyst (source).
⦁ Additional bullish factors include Grayscale considering investment in TON, the launch of new Telegram NFT features, and US users being able to access TON Wallet directly inside Telegram without a VPN (source).
So, yea, i think we're breaking previous ATH and hitting $10 soon
cheers
Bitcoin’s Game Has Changed: Fresh Support Zone, Targets Sky-HighHey Dear Friends,
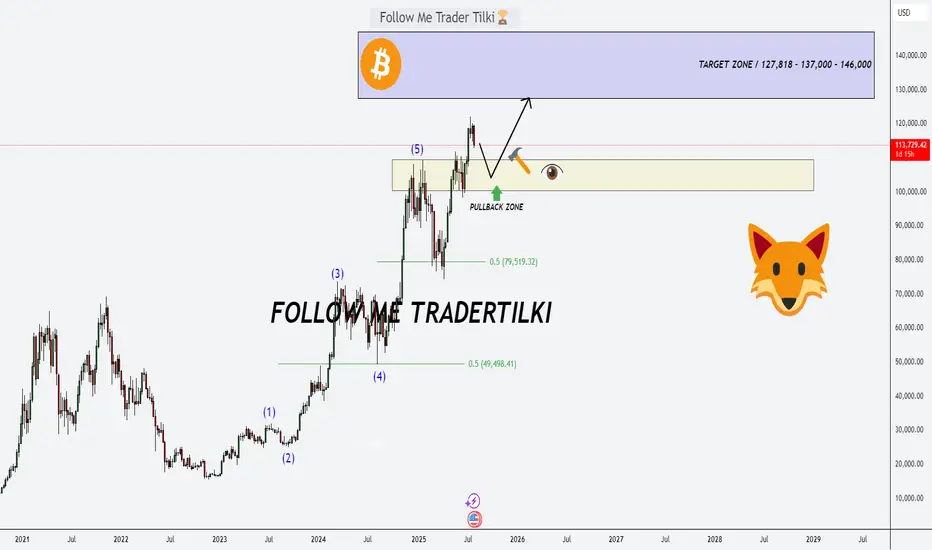
Until recently, Bitcoin had been stuck in a range between 112,331 and 105,344 for quite some time. But that range has now been clearly broken. So, what does this mean? This zone, which used to act as resistance, is now expected to flip and act as support.
According to my weekly trading model, the long-term target levels I’m tracking for Bitcoin are: 127,818 – 137,000 – 146,000.
Since this is a weekly setup, it might take a while for these targets to play out. Even if we see pullbacks to the 112K, 105K, or even 100K levels, I expect to see strong buying pressure from that zone.
I’ll keep sharing regular updates as this setup develops.
To everyone who’s been supporting and appreciating my work—thank you, truly. Your encouragement means the world to me and keeps me motivated to keep showing up. Much love to all of you—I’m grateful we’re in this journey together.
The End of BTC correction? BTC analysis 2/8/2025In my point of view, BTC has completed its correction and is now ready for a strong upward move, potentially targeting the $137,000–$139,000 range, based on the following factors:
1. Confirmation of the Butterfly Harmonic Pattern
The recent reversal occurred within the expected range of the Butterfly harmonic pattern. Typically, the XD leg in a Butterfly harmonic extends to 1.27, but in practice, this can stretch up to 1.414, which is commonly used as a flexible stop-loss zone. After testing the 1.27–1.414 range, a clear 5-wave impulse followed—testing a key trendline and making an attempt to break above the recent high. This sequence, followed by a corrective move, suggests that the broader correction may be complete.
2. Complex WXYXZ Correction Structure
In my previous analysis, I underestimated the duration and depth of the correction. The wave (4) (blue), which is part of the wave (iii), has taken considerable time—likely to allow wave (5) to extend sufficiently to break above the $130,000 level. This would support the assumption that wave (5) (purple) is the extended wave. The overall corrective structure appears highly complex, and can be counted as a W–X–Y–X–Z pattern, supported by the presence of multiple internal corrections within the wave components.
3. 0.618 Fibonacci Retracement of Wave (3)
Wave (4) has now reached the 0.618 Fibonacci retracement level of wave (3), which is significant. Historically, BTC’s corrections rarely retrace beyond the 0.87 level. This deep retracement suggests wave (4) is likely complete—unless price were to fall below that threshold, which would invalidate this assumption.

NASDAQ | BEARISHNASDAQ has retraced after hitting its top.A parabolic downward shift and an obvious bearish trend tend to print a LH.It may form an ABCD pattern and a sell stop order may be placed at the breakout of LL.

Nifty levels - Jul 04, 2025Nifty support and resistance levels are valuable tools for making informed trading decisions, specifically when combined with the analysis of 5-minute timeframe candlesticks and VWAP. By closely monitoring these levels and observing the price movements within this timeframe, traders can enhance the accuracy of their entry and exit points. It is important to bear in mind that support and resistance levels are not fixed, and they can change over time as market conditions evolve.
The dashed lines on the chart indicate the reaction levels, serving as additional points of significance to consider. Furthermore, take note of the response at the levels of the High, Low, and Close values from the day prior.
We hope you find this information beneficial in your trading endeavors.
* If you found the idea appealing, kindly tap the Boost icon located below the chart. We encourage you to share your thoughts and comments regarding it.
Wishing you success in your trading activities!

XRP/USD Breakout Watch: $3.22 Target in SightA key blue trendline on the XRP/USD chart that reflects market sentiment. If price breaks above it with strong volume, we could see a rally toward $3.22.
Support zone: $0.55–$0.60
Bullish case: Improved sentiment, easing tariffs, and regulatory cooling
Strategy: Wait for breakout confirmation before entering
Share your thoughts — are you preparing for a breakout?

BTC Clear Idea if this pattern worksFor now please observe some time if btc breaks down to next target which is arround 110k then btc will definetly move towards 105k becuase that is its daily trendline support

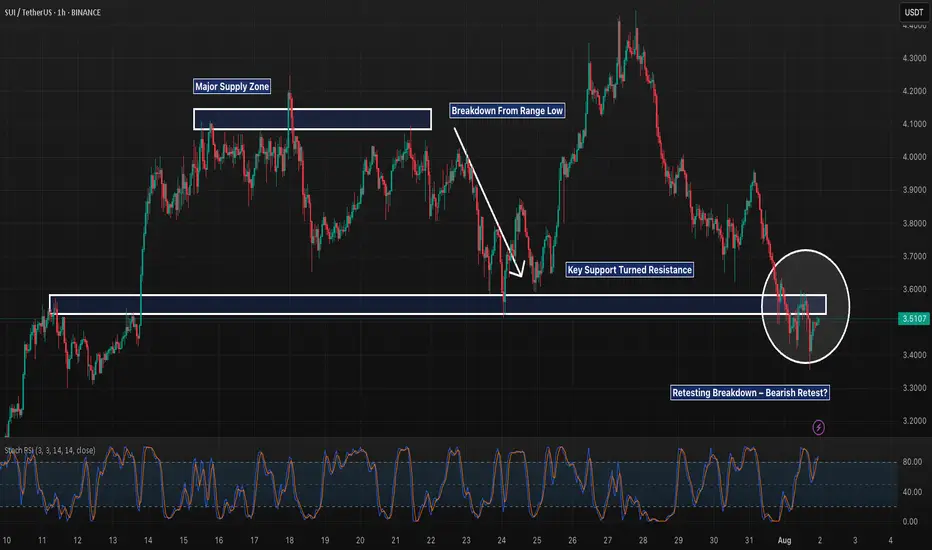
SUI 1H – Breakdown & Retest of Key Support, But Will It Reject?SUI 1H – Breakdown & Retest of Key Support, But Will It Reject or Reclaim?
Description:
SUI just completed a textbook range breakdown after weeks of sideways chop between ~$3.60–$4.10. The prior support floor has now flipped into resistance, and the recent bounce appears to be retesting that structure. If this retest gets rejected, continuation toward lower support zones (potentially $3.30 and below) becomes likely.
However, reclaiming and holding above $3.60 could trap late shorts and fuel a squeeze. Structure still favors bears for now, but it’s decision time.
📌 Breakdown structure
📌 Bearish retest
📌 Eyes on confirmation or invalidation
This is the battle zone — stay sharp.
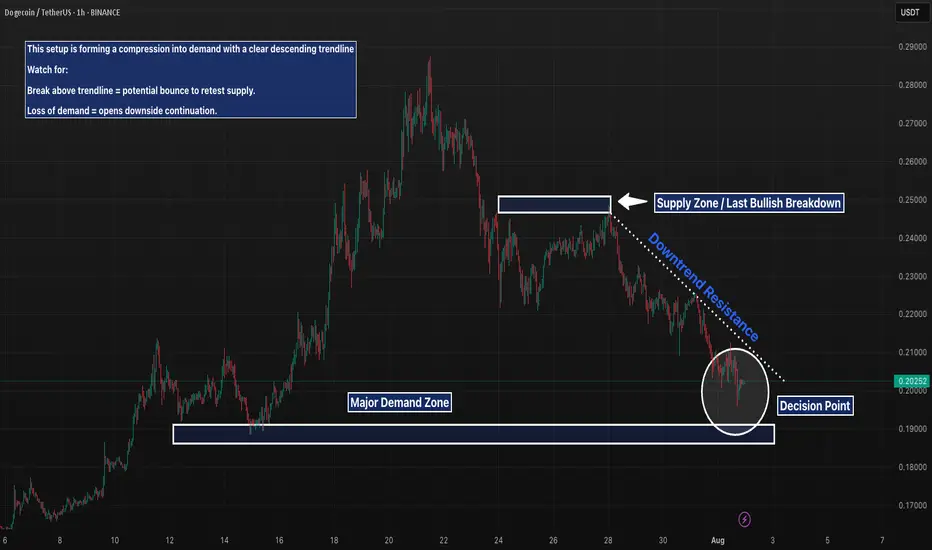
DOGE 1H – Descending Into Demand, But Will Buyers Step Up Again?DOGE is approaching a key inflection point after a clean rejection from the previous supply zone (~0.23) and consistent lower highs. The descending trendline has acted as dynamic resistance, compressing price into a major demand zone that previously triggered a strong rally. If bulls step in here, we could see a breakout and retest of the overhead supply. However, failure to hold this zone opens up potential for a deeper move toward the mid-$0.18s.
📌 Key Levels:
– Resistance: 0.23 (supply zone)
– Support: 0.19 (demand zone)
– Structure: Lower highs into horizontal demand = potential spring or breakdown.
This is a classic make-or-break structure — momentum and volume will reveal the winner.

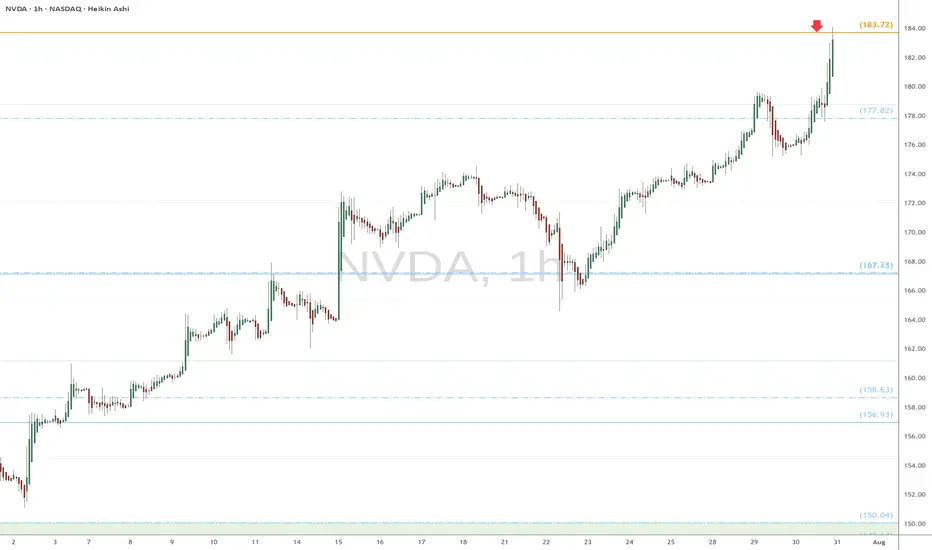
NVDA heads up at $183.72: Golden Genesis fib to mark a TOP?Chips have been flying high since the April lows.
NVDA has just hit a Golden Genesis fib at $183.72
This is a "very high gravity" fib so expect a reaction.
It is PROBABLE that we "orbit" this fib a few times.
It is POSSIBLE that we reject to form a major top.
It is PLAUSIBLE that we Break-n -Retest to continue.\
.
See "Related Publications" for previous EXACT plots ------>>>>>>>>
Such as this post at the last Golden Genesis:
Hit the BOOST and FOLLOW for more such PRECISE and TIMELY charts
============================================================
.
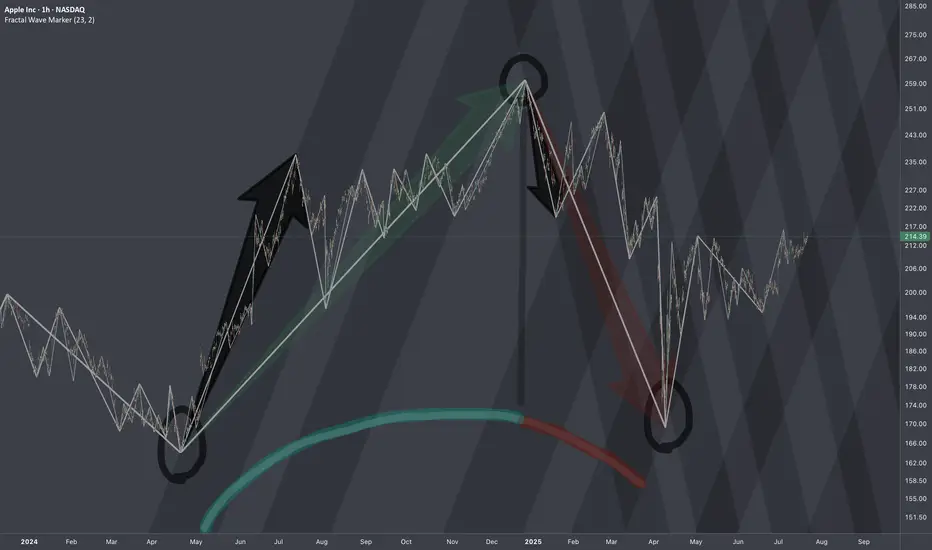
$AAPL: Structure SurgeryResearch Notes
Original Structure:
Altering structure for experimental purposes
Angle of fib channels that rises from cycle low, has been pushed into the past to the top of first major reaction. blue area resembles the change
Reason
The the angle of Fibonacci channels which cover the general decline (from perspective of ATH to end of cycle), are adjusted to the angle of the first bear wave of smaller scale.
Therefore, when it comes to measurements of opposing forces for working out interference pattern, having this symmetric approach of mapping interconnections is fair.
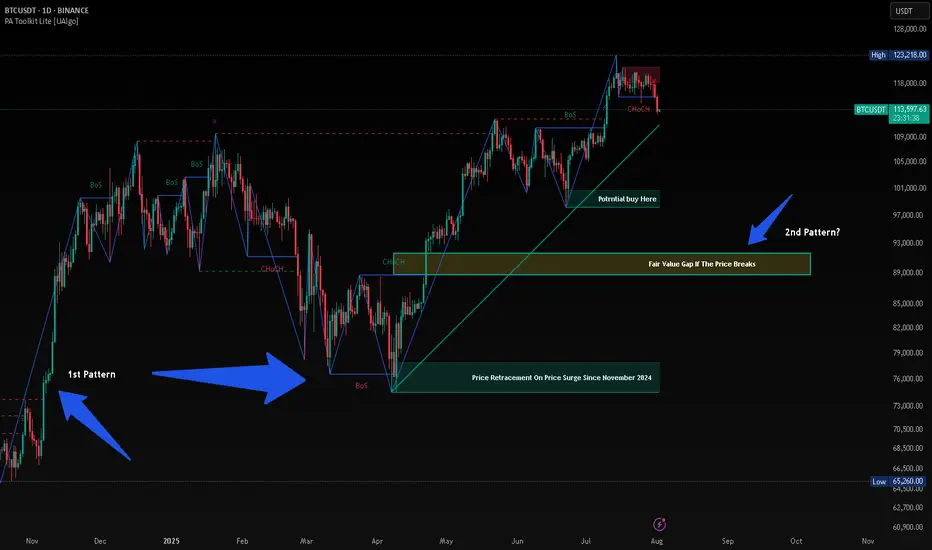
BTC HUNTS LIQUIDITYThis is just my opinion, BTC will hunt liquidity before taking new High. Since November 2024 after President Trump was elected, the price of BTC surge from $74,000 and retrace almost the same price on April 2025 after taking its new High. History will repeat itself and when history failed, there will be a long Bearish at least 90%.

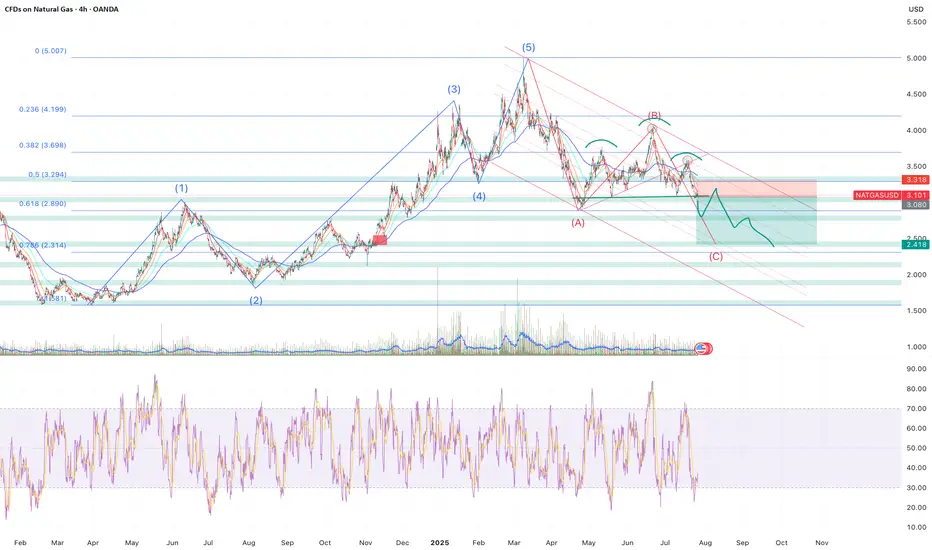
Sell NATGAS into OCT/NOVNatalie has fromed a H&S and has broke through all of the supporting EMAs leading to most of the indicators turning bearish.
My approach for the forseeable is seeling bounces until the winter season approaches.
Of course Natalie is extremely susceptible to trend changes due to economical data and has to be monitored closely. Currenlty I'm a bear.
Only selling once it breaks and retests, where I will once again reasses based on economics such as storage, production, imports and demand.
Target around $2.5 where interestingly a gap (red rectangle) sits from Nov - 24.
Elliot Wave (although not a great fan) kind of aligns as well as the 0.786 fib level which began forming at the beginning of 2024.
Storage | Volatility | Price Outlook
U.S. natural gas markets are stabilizing as volatility trends back toward seasonal norms.
📉 Volatility has dropped from 81% in Q4 2024 to 69% in mid-2025
🏪 Storage is currently at 3,075 Bcf,
🔻 4.7% lower YoY
🔺 5.9% higher than the 5-year average
🚢 LNG exports remain strong—up 22% YoY and 74% above the 5-year average
🔌 Domestic demand is seasonally weaker but steady
➡️ Despite being below last year’s levels, storage surplus vs. the 5-year average acts as a soft ceiling on price.
➡️ Historical analogs suggest a fair value range between $2.50–$3.20/MMBtu in the short term.
📊 Current price action around $3.00–$3.40 looks slightly overheated unless a fresh catalyst emerges (heatwave, export spike, etc.).
🧭 Watching for:
Injection trends over the next few weeks
Cooling demand in power sector
Resistance around $3.40
Support near $2.80

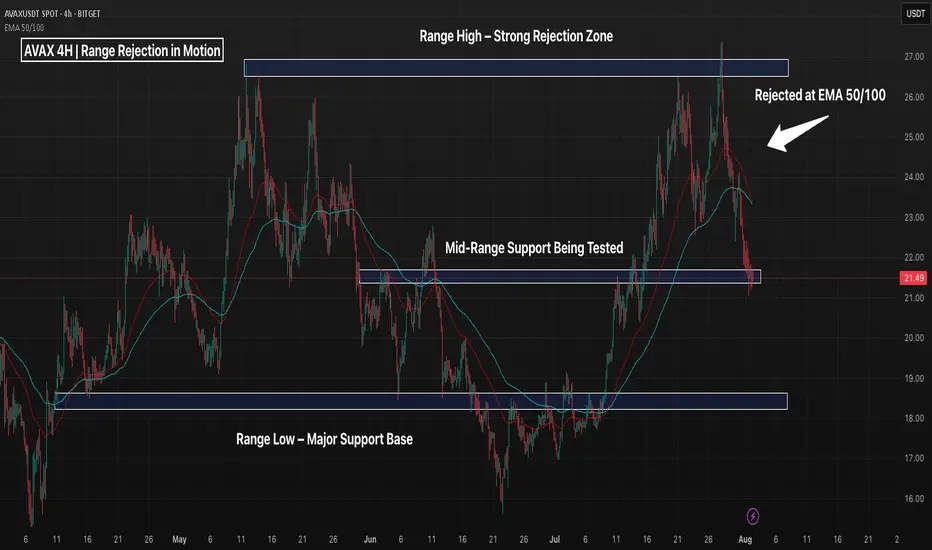
AVAX - Rejected at Range High, Now Testing Mid-Zone SupportAVAX just printed a textbook range rejection from the $26–27 resistance zone, which has capped price action since April. After rejecting the 50/100 EMA cluster, price is now testing mid-range support around $21.50 — a level that has historically offered short-term bounce opportunities or clean breakdown setups.
📌 Key Zones:
Top Resistance (~$26.50–27): Strong sell zone — multiple rejections
Mid-Range (~$21.50): Currently being tested for a possible bounce
Bottom Support (~$18.20–19): Range base with prior reversal history
📉 Reclaiming the EMAs could suggest another trip toward the highs, but failure to hold $21.50 opens the door to a deeper move toward $19 — or even a range breakdown if broader momentum weakens.
This chart highlights the importance of range trading structure — clean rejection up top, bounce attempt in the middle, and final line in the sand at the bottom.
Trade Idea Scenarios:
Bullish: Bounce + reclaim of $23.50 EMAs = long toward $25+
Bearish: Breakdown below $21.50 = short toward $19 or lower
How are you playing this range? 👇
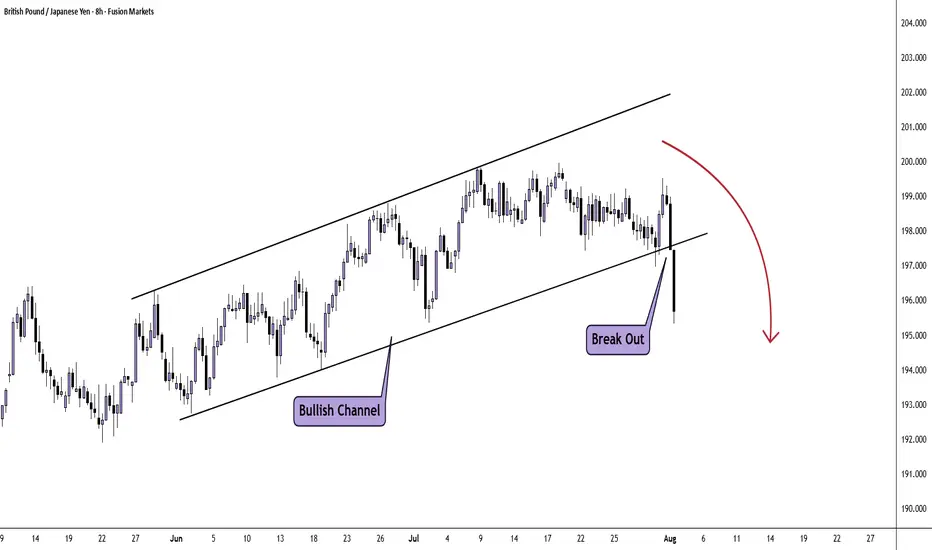
GBP/JPY H8 AnalysisPrice has been bullish since April this year with the most recent price action forming a parallel channel.
On Friday we saw a solid break lower and close below the channel. This could possibly lead to further downside.
Look for a trade that meets your strategy rules.
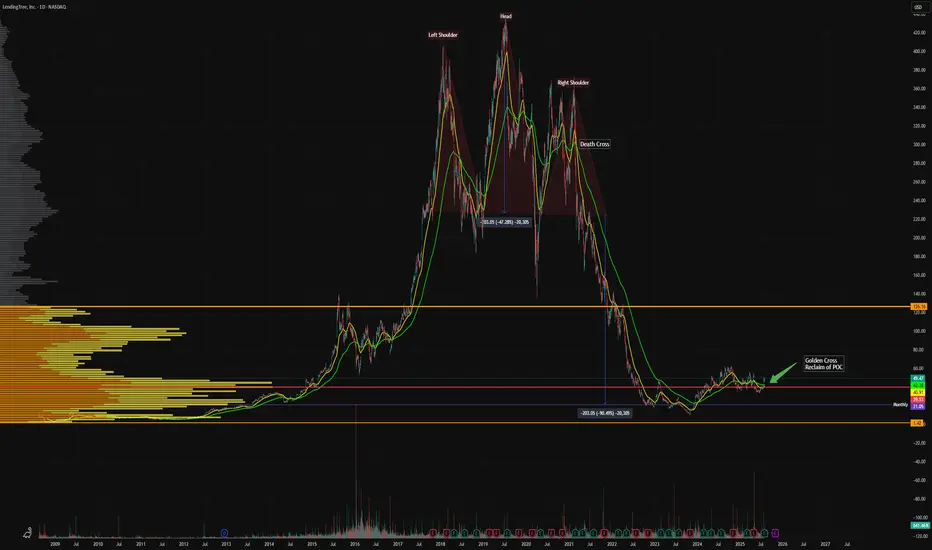
Interest Rate Cutting Cycle - Opportunity?LendingTree is well positioned to benefit from a declining interest rate environment. As the rates fall, consumer appetite for refinancing, mortgages and personal loans typically surge. This is likely to boost TREE's lead generation revenue.
The company's recent revenue pick up in recent quarters indicates early signs of this rebound and the chart has recovered from its Head and Shoulders drop. We have a reclaim of the POC and an imminent death cross.
Trading at a historically low valuation, do you believe TREE can scale quickly in renewed customer demand? It's highly likely IMO. This is high up on my watchlist.
Not financial advice, do what's best for you.