GER4O1. Head of the European Central Bank (ECB)
As of August 2025, Christine Lagarde is the President (head) of the European Central Bank (ECB). She is responsible for leading eurozone monetary policy, representing the ECB at global forums, and setting the tone for financial and economic policy across Europe.
2. Fundamental Drivers of the GER40 (DAX 40)
The GER40, also known as the DAX 40, is Germany's blue-chip stock market index. Its performance is driven by the following key fundamentals in 2025:
Corporate Earnings & Sector Leaders: Major companies like SAP, Siemens, Allianz, and Linde have been driving index gains, contributing a significant portion of the upward momentum due to their market capitalization.
ECB Monetary Policy: Multiple rate cuts by the ECB in 2025 supported German and eurozone equities, lowering yields and easing financing for businesses. Expectations of further rate cuts or stability are closely monitored by the market.
Inflation Dynamics: Falling inflation across the eurozone in 2025 enabled the ECB to move from a restrictive to a more accommodative stance. Latest ECB projections see inflation averaging 2% in 2025 and slightly below target in 2026, allowing monetary loosening to persist.
Energy Prices: Declining natural gas and oil prices provided relief to Germany’s energy-intensive industries, aiding profitability and supporting DAX-listed industrials.
Government Policy & Fiscal Stimulus: Increased defense and infrastructure spending by the new German government under Chancellor Friedrich Merz has boosted selective sectors, including defense (e.g., Rheinmetall).
Global and Domestic Economic Conditions: While the eurozone and German economies have shown resilience with modest GDP growth (ECB forecast: 0.9% growth for 2025), there are headwinds from trade tensions, consumer demand, and sectoral shifts (notably auto and chemicals).
Trade Policy/Geopolitics: Ongoing global trade tensions, new tariffs, and geopolitical uncertainty remain sources of risk and volatility for the index. ECB President Lagarde has repeatedly warned that “trade tariffs are a negative demand shock” and could weigh on German growth prospects.
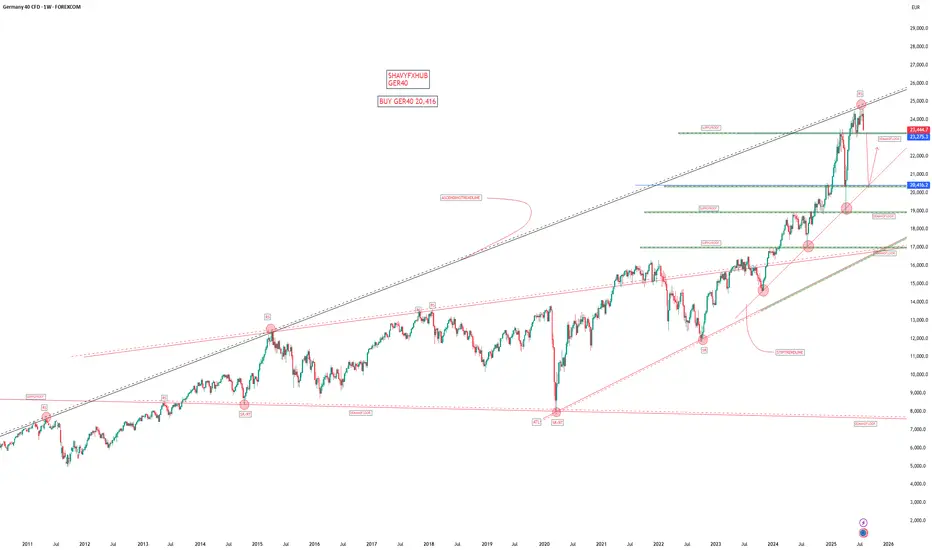
3. Current Outlook for GER40 (August 2025)
The index gained nearly 22% so far in 2025, surpassing 24,000 and even pushing toward record highs around 24,650. AI-based and institutional forecasters project continued bullish momentum, with most calling for stability or gradual increases but noting the potential for a market correction after strong gains.
Rate cuts, lower energy prices, and corporate strength are the main drivers for the recent rally, while persistent trade risks and sectoral weaknesses remain key downside risks.
Despite economic fragility, especially in manufacturing and energy costs, the DAX/GER40 remains resilient thanks to monetary policy support and selective corporate strength.
4. Recent ECB Actions & Commentary
At the July 2025 meeting, Lagarde and the ECB Governing Council kept rates steady after several cuts earlier in the year, citing moderate growth and disinflation as justification for their stance. The ECB remains “cautiously upbeat,” expecting a 2% average inflation rate and slow but positive economic growth.
The ECB noted that further escalation of trade tensions or unexpected inflation swings could prompt new policy responses.
Summary:
The GER40 is currently driven by accommodative ECB policy under Christine Lagarde, robust earnings from key blue-chip companies, lower energy prices, and government fiscal stimulus. Risks include trade uncertainty, sector-specific downturns, and any reversal in global economic momentum. The ECB’s current president, Christine Lagarde, continues to play a central role in shaping the environment for German and eurozone equities.
WATCH MY DEMAND FLOOR
Trend Analysis
BTCUSD looking to SellI'm expecting BTC USD to enter into the break of structure and retest zone that is in f4HRS and and then push down from there with a 1:4RR hitting the next point of interest / area of interest

XRP - FUTURES SIGNALFUTURES SIGNAL
Coin: XRP
Direction: LONG
🟢Input range: 2,9358-2,9219
✔️ТР: 3,0116/3,0606/3,1223
❌SL: 2,8893
We try to carefully open a long position from the order block after the structure is broken on the 15-minute time frame. We enter at a reduced risk

BITCOIN - Price can turn around and start to move upHi guys, this is my overview for BTCUSD, feel free to check it and write your feedback in comments👊
The price reversed its prior downtrend with a decisive breakout from a falling channel.
This breakout triggered a strong upward impulse, which then began to consolidate into a large symmetrical pennant.
However, the price recently failed to hold the lower support trendline of this pennant and broke to the downside.
The asset is currently trading just below this broken trendline, in what appears to be a liquidity grab.
To continue upwards, buyers must now overcome the immediate resistance located at the $116300 level.
I expect that this breakdown was a fakeout, and the price will soon reverse, break through the $116300 resistance, and continue its rally toward the $121000 target.

AUDNZD Technical + Fundamental Align for DownsideToday I want to analyze a short position on the AUDNZD ( OANDA:AUDNZD ) pair, first, let's look at it from a fundamental analysis perspective .
Fundamental View on AUDNZD
Key reasons to short AUDNZD:
Australian weakness:
Recent data show weakening consumer sentiment and declining building approvals. The RBA seems hesitant to hike further, putting pressure on the Aussie.
New Zealand resilience:
The RBNZ maintains a relatively hawkish stance. Inflation is still a concern, and the central bank is committed to keeping rates high, supporting NZD strength.
Monetary policy divergence:
The divergence between RBA’s dovish stance and RBNZ’s hawkish approach supports further downside in AUDNZD.
----------------------
Now let's take a look at AUDNZD from a technical analysis perspective on the 4-hour timeframe .
AUDNZD is currently trading in a Heavy Resistance zone(1.0963 NZD-1.0870 NZD) near the upper line of the Range Channel , Potential Reversal Zone(PRZ) and Yearly Pivot Point .
In terms of Elliott Wave theory , AUDNZD appears to be completing microwave B of microwave Y of the main wave 4 .
I expect AUDNZD to drop to at least 1.0904 NZD(First Target) based on the above explanation .
Second Target: 1.0886 NZD
Note: Stop Loss(SL): 1.0963 NZD
Please respect each other's ideas and express them politely if you agree or disagree.
Australian Dollar/New Zealand Dollar Analyze (AUDNZD), 4-hour time frame.
Be sure to follow the updated ideas.
Do not forget to put a Stop loss for your positions (For every position you want to open).
Please follow your strategy and updates; this is just my Idea, and I will gladly see your ideas in this post.
Please do not forget the ✅' like '✅ button 🙏😊 & Share it with your friends; thanks, and Trade safe.

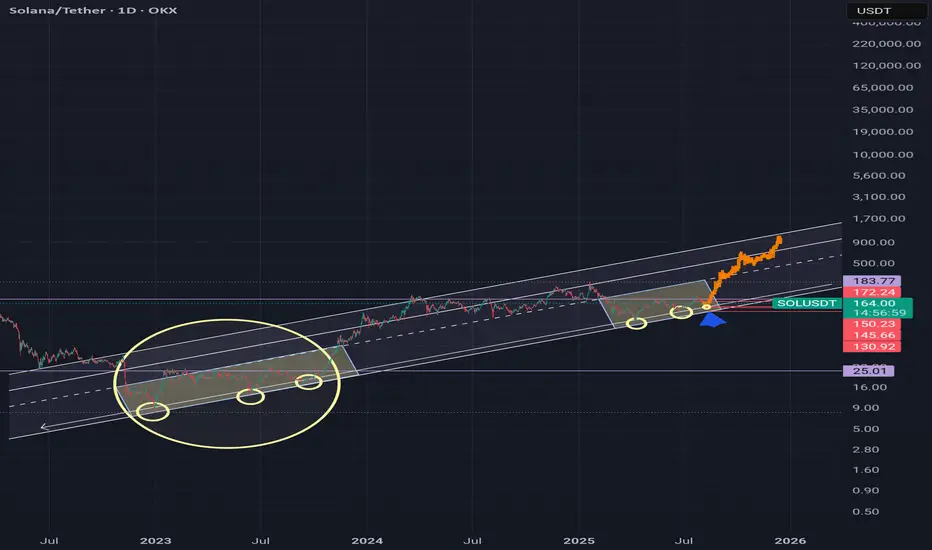
Longterm Uptrend still in a Process!Look at 3 contact below.
Currently price avout to put 3rd touch to lower zone of trend and it marks to $148-$151.
After that upside move will start to gain momentum in my opinion.
Macro view is still bullish roughly above $150.
#BTC Update #14 – Aug 02, 2025#BTC Update #14 – Aug 02, 2025
Unfortunately, Bitcoin has closed below its current channel and now appears to be retesting that level. If this retest confirms, I expect a pullback down to the $110,000 zone. However, if Bitcoin manages to re-enter the channel, its first target will be $118,800. Although it’s a descending channel, moving within it suggests a relatively stable market. Closing below it may not end well and could deepen the retracement. That's why I recommend caution with all coins right now.
Even though it seems like a distant possibility at the moment, don’t forget there’s also an imbalance zone around the $103,500 level. A sharp wick or a significant drop could bring Bitcoin back to revisit that area. The probability is currently low, but it can’t be ruled out completely. I don’t recommend rushing into any long or short positions at this stage.

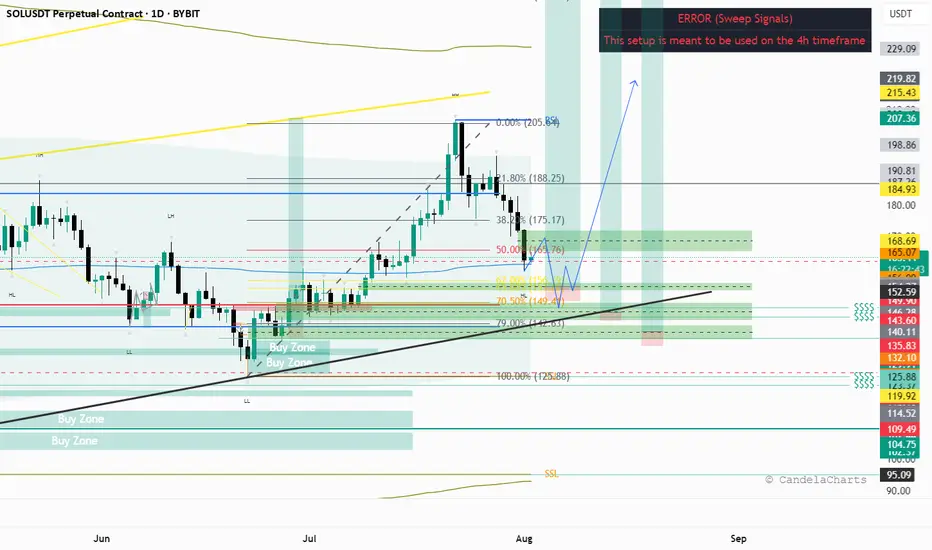
SOL Sol next move idea.
Sol's final leg down before the final leg up for this bullrun. Fill the daily imbalances come to 70 % fib retracement level also a volume POC on a discount area below 50% of the dealing range and the daily trendline.
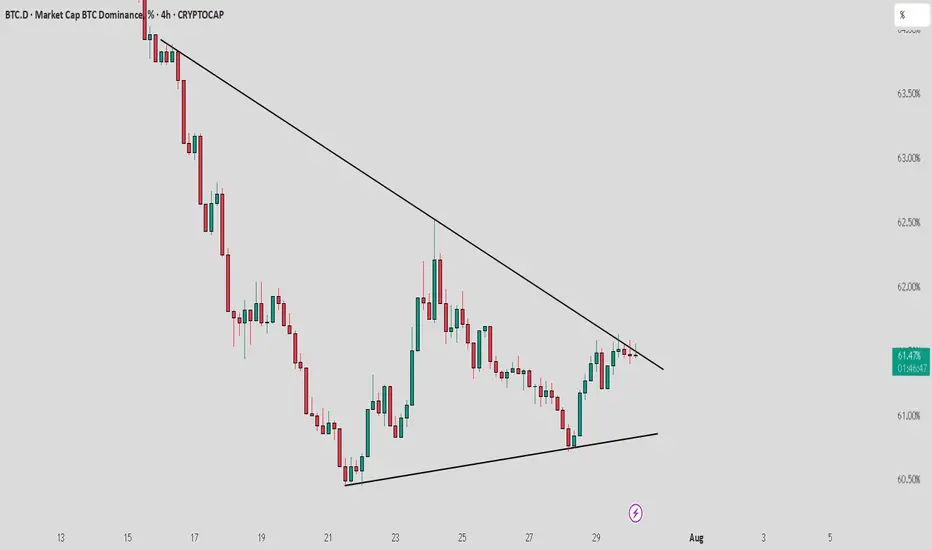
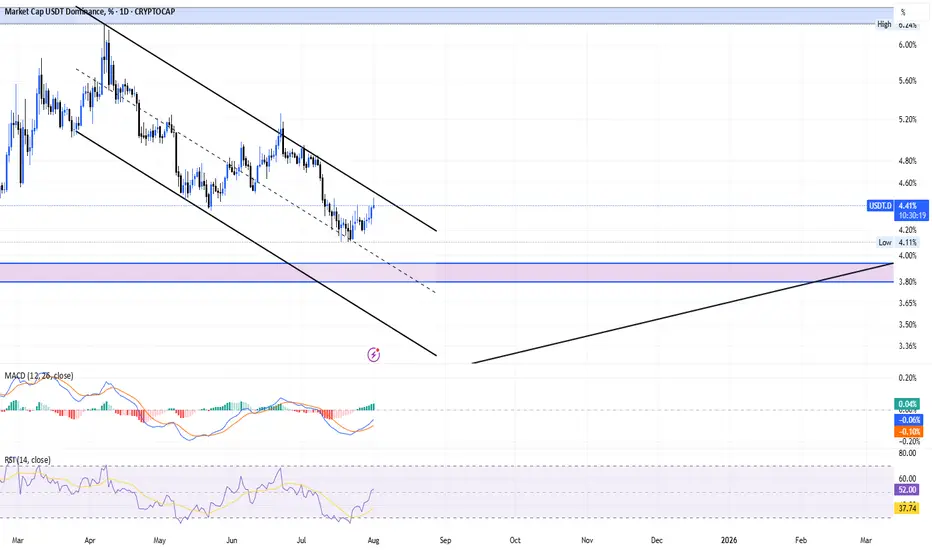
BTCDOM : Near to breakout from trendline resistanceBitcoin dominance is nearing a breakout from trend line resistance. Keep a close watch as a breakout from here could lead to a short-term market correction, negatively affecting altcoins. Stay cautious with your long positions and use proper stop loss strategies.
KEEP A CLOSE WATCH ON IT
XRPUSD 4 Hour BottomXRP has broken out of the weekly wedge leaving a long weekly candle stick close. Price has pulled back indicating it it ready for the next leg higher. Daily candle closed bullish and 4 hour time from has double bottom.

GOLD Short From Resistance! Sell!
Hello, Traders!
GOLD surged up sharply
On Friday and is already
Retesting the horizontal
Resistance of 3377$
From where we will be
Expecting a local pullback
On Monday as Gold
Is locally overbought
Sell!
Comment and subscribe to help us grow!
Check out other forecasts below too!
Disclosure: I am part of Trade Nation's Influencer program and receive a monthly fee for using their TradingView charts in my analysis.

Nifty : Technical levels metAs shared last week the nifty support 24510 , 24850 levels were worked as support exactly.
Now we may see sideways market and range bounded moves.
Sharing fresh levels:
Support : 24460
Resistance: 24660, 24850

EURUSD has broken & hovering near resistance.EURUSD has broken & hovering near resistance. US dollar has started weaking again due to Tariff war.

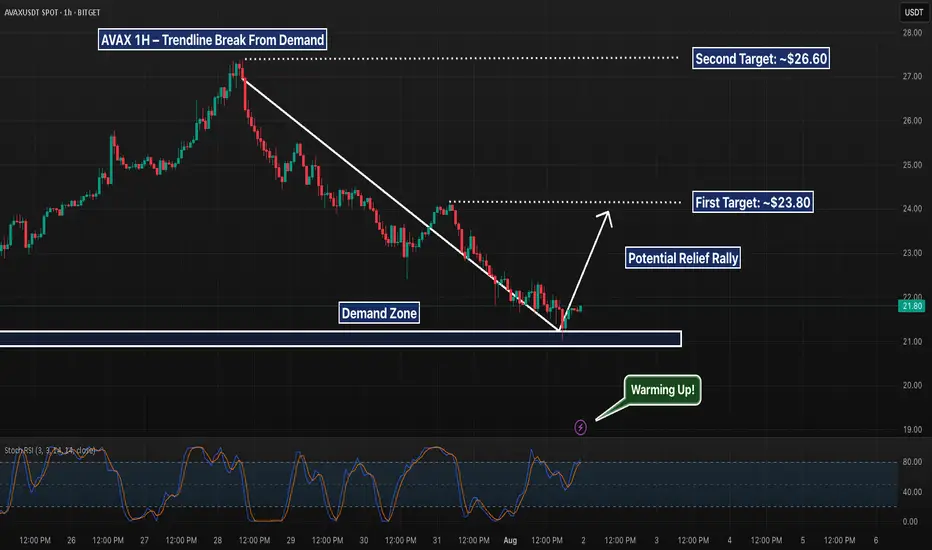
AVAX - Trendline Break From Demand, But Can Bulls Push to $24?AVAX is showing signs of life after rebounding cleanly off a local demand zone near $21 and breaking its recent downtrend line. This structure opens the door to a possible short-term rally — with first resistance sitting near $23.80 and a secondary target at $26.60. However, Stoch RSI is already pushing into overbought, so momentum must sustain or risk another fade.
A retrace to retest the broken trendline and hold would add confluence for longs. If that fails, bulls may get trapped.
📌 Demand bounce
📌 Trendline break
📌 Eyes on follow-through to reclaim higher levels
This is early-stage structure shift — not confirmation yet, but worth watching.
RNDR/USDT at a Critical Turning Point: Golden Pocket as the Key?✨ Overview:
Render Token (RNDR) is currently testing a crucial support zone — the Golden Pocket Fibonacci Retracement between 0.5 (3.616) and 0.618 (3.385). This zone not only represents a significant retracement level but has historically acted as a strong demand area, often serving as a springboard for major price reversals.
---
🧠 Detailed Technical Analysis:
🔸 Support Zone & Golden Pocket
Price has retraced back to the 0.5 – 0.618 Fibonacci zone, a high-probability reversal area.
This zone has acted as a demand base multiple times since February 2025.
How the price reacts here will likely define the next major trend direction.
🔸 Market Structure
The overall structure shows a mid-term downtrend, marked by lower highs and lower lows.
However, the current price action shows slowing bearish momentum, indicating potential hidden accumulation.
A potential double bottom pattern could be forming, hinting at a bullish reversal if confirmed.
---
📈 Bullish Scenario:
1. Strong Rebound from the Golden Pocket
Watch for bullish candlestick patterns (e.g., pin bar, bullish engulfing) near $3.38–$3.61.
Initial resistance levels: $4.16 – $4.72
If broken, mid-term targets could extend to $5.47 – $6.68
2. Double Bottom Confirmation
A confirmed double bottom with a neckline breakout around $4.16 would greatly strengthen bullish momentum.
3. Increased Buying Volume
A spike in volume during the rebound would validate bullish sentiment and potential trend reversal.
---
📉 Bearish Scenario:
1. Breakdown Below the Golden Pocket
If the price breaks below $3.385 with strong volume, we could see a move down toward $2.77, the next significant support.
2. Weak Bounce / Lower High
A failed breakout above $4.16 may indicate a bearish continuation after a temporary relief rally.
---
📌 Summary:
RNDR is currently at a technically sensitive zone. The Golden Pocket between $3.38 and $3.61 is the key area to watch. A strong bullish reaction could signal the start of a trend reversal, while a breakdown could trigger further downside continuation. Traders are advised to wait for clear confirmation via price action before committing to any strong positions.
---
🔖 Key Levels to Watch:
Level Description
3.38 – 3.61 Golden Pocket (Potential Buy Zone)
4.16 Minor Resistance
4.72 Bullish Breakout Trigger
5.47 – 6.68 Mid-Term Reversal Targets
2.77 Strong Support if Breakdown Occurs
---
🧩 Chart Patterns Observed:
Potential Double Bottom – early bullish reversal signal.
Golden Pocket Reaction Setup
Descending Structure – still intact but weakening.
---
🔍 Trade Ideas:
🔄 Wait-and-see approach: Wait for clear bullish confirmation on daily candles.
🎯 Aggressive Long Entry: Around 3.40–3.60 with a tight stop-loss.
⚠️ Short Opportunity: If a strong breakdown below 3.38 occurs with volume confirmation.
#RNDR #RenderToken #RNDRUSDT #CryptoAnalysis #GoldenPocket #FibonacciRetracement #DoubleBottom #PriceAction #SupportResistance #AltcoinSetup #CryptoSignals #TechnicalAnalysis

Nasdaq is retracing to lower channal line.Nasdaq is retracing to lower channal line. This fall is attributed to Tarrif war.

BTC Daily Elliott Wave CountAs mentioned in my analysis on youtube post on Total Market Cap short-term, the daily bullish case is now verified, canceling the bearish case with a break through the daily bearish invalidation level.
This past week price action suggests a move towards the completion of a blue wave x. Make sure to check out my latest analysis on short-term Crypto Total Market Cap.
The link to the chart:
Bullish Count

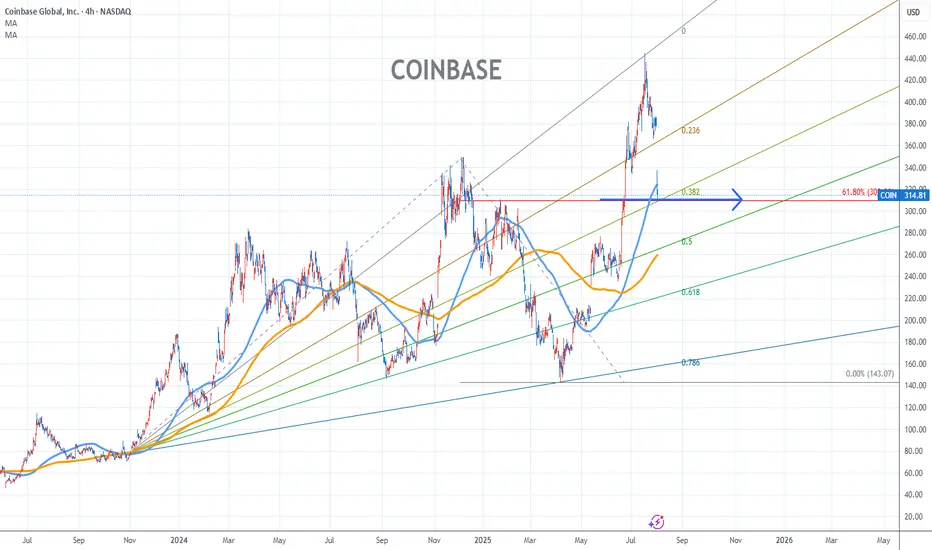
Coinbase Stock Chart Fibonacci Analysis 080125Trading Idea
1) Find a FIBO slingshot
2) Check FIBO 61.80% level
3) Entry Point > 310/61.80%
Chart time frame:C
A) 15 min(1W-3M)
B) 1 hr(3M-6M)
C) 4 hr(6M-1year)
D) 1 day(1-3years)
Stock progress:C
A) Keep rising over 61.80% resistance
B) 61.80% resistance
C) 61.80% support
D) Hit the bottom
E) Hit the top
Stocks rise as they rise from support and fall from resistance. Our goal is to find a low support point and enter. It can be referred to as buying at the pullback point. The pullback point can be found with a Fibonacci extension of 61.80%. This is a step to find entry level. 1) Find a triangle (Fibonacci Speed Fan Line) that connects the high (resistance) and low (support) points of the stock in progress, where it is continuously expressed as a Slingshot, 2) and create a Fibonacci extension level for the first rising wave from the start point of slingshot pattern.
When the current price goes over 61.80% level , that can be a good entry point, especially if the SMA 100 and 200 curves are gathered together at 61.80%, it is a very good entry point.
As a great help, tradingview provides these Fibonacci speed fan lines and extension levels with ease. So if you use the Fibonacci fan line, the extension level, and the SMA 100/200 curve well, you can find an entry point for the stock market. At least you have to enter at this low point to avoid trading failure, and if you are skilled at entering this low point, with fibonacci6180 technique, your reading skill to chart will be greatly improved.
If you want to do day trading, please set the time frame to 5 minutes or 15 minutes, and you will see many of the low point of rising stocks.
If want to prefer long term range trading, you can set the time frame to 1 hr or 1 day.
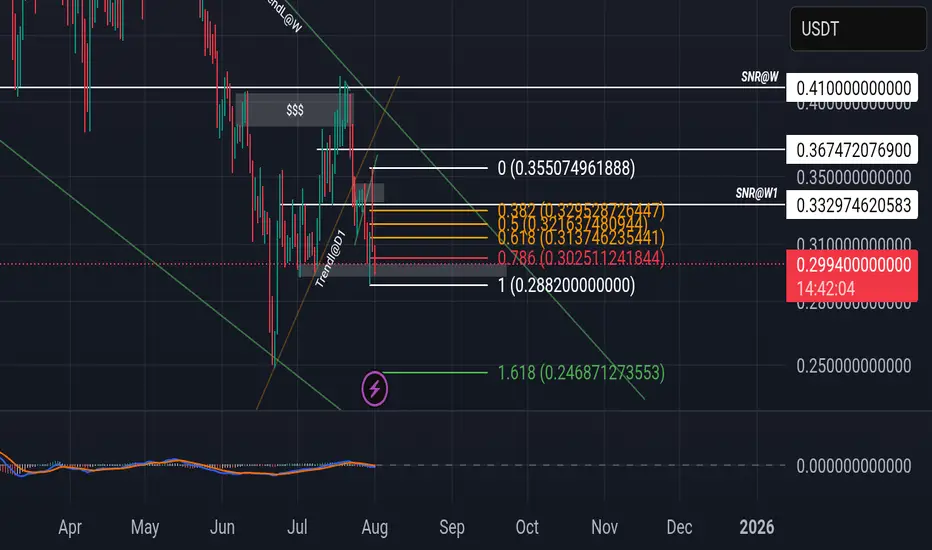
Sonic is creating wedge pattern in higher timeframeOn our current market structure, sonic is creating wedge bullish pattern.
If you check the current price using Fibonacci there's a possibility that it will goes to 0.24 or worst 0.1552 before it will break its current weekly structure.
You can accumulate within the pattern but if you're planning to make position and do long...please avoid that.
Point of interest is 0.24 to make create double bottom on it. If it's break, 0.1552.
A comeback trendI think the downward trend will continue.
As you can see on the chart, if there is no news, the trend continues in a channel.
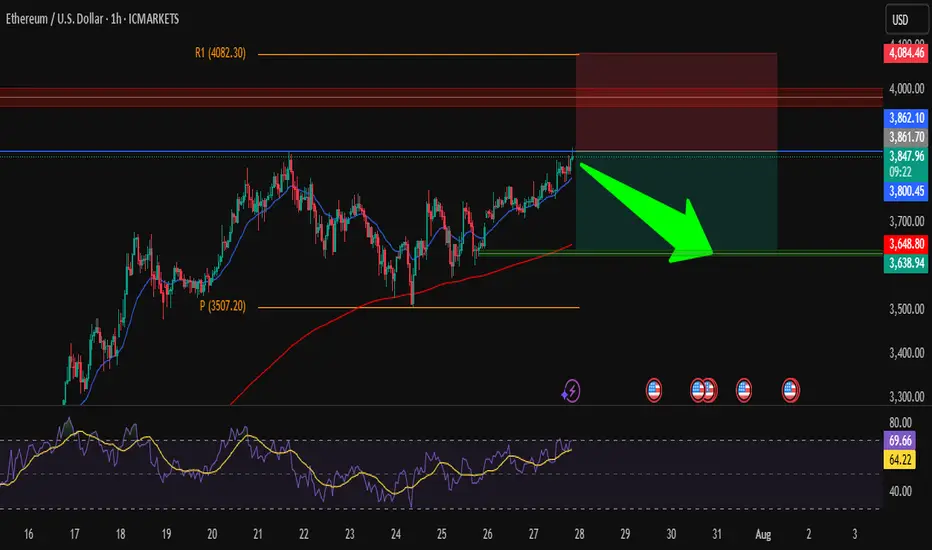
ETH/USD – Short from ResistanceHi traders ! , I opened a short position on ETH/USD as price is hitting a strong resistance zone.
Entry: 3850
SL: 4084.46
TP: 3638.94
📌 Why I took this trade:
Price is testing a strong resistance zone around 3860, RSI is overbought, and we could see a pullback toward the support area around 3640.
Nice risk/reward setup, keeping it simple.
This is just my analysis, not financial advice.
What’s your view — drop or breakout?
BTC | Swing Plan UpdatePrice failed to break out above 1D supply and sharply rejected, losing key 4H demand at $117,300.
HTF demand at $109,000 (1D FVG + BOS + S/R) is the next major area of interest—this is where I’ll look for fresh swing setups if the market flushes further.
No need to rush new positions until a clean setup prints or levels are reclaimed.
Plan:
Wait for price to test $109,000 zone before considering a swing long.
Only consider LTF scalp longs if we reclaim the 4H BOS at $118,300.
Stay flat until high-probability entry, let the market show its hand.

Gold (XAU/USD) in Symmetrical Triangle – Short‑Term Squeeze,Price Structure & Technical Setup
Gold is consolidating within a symmetrical triangle, showing lower highs and higher lows—a classic precursor to breakout in either direction
Fxglory Ltd
+5
TradingView
+5
Babypips.com
+5
TradingView
+2
Babypips.com
+2
TradingView
+2
.
Trendlines converge tightly around $3,326–$3,334, hinting at imminent directional acceleration
Investopedia
+4
TradingView
+4
TradingView
+4
.
🎯 Key Levels & Targets
Scenario Trigger Confirm Area Targets Stop Loss
Bullish Breakout above $3,344–$3,350 $3,369 → $3,396 → $3,422–$3,550 ~$3,340
Bearish Breakdown below ~$3,326–$3,320 $3,320 → $3,300 → $3,297 → $3,255 ~$3,335–$3,340
A breakout above $3,344–$3,350 validated with volume may drive prices toward $3,400+, with extended targets up to $3,550 or higher in bullish conditions
Traders Union
Time Price Research
.
A drop below $3,326–$3,320 risks further decline, targeting $3,300, $3,297, and eventually $3,255 if breakdown momentum builds .
📉 Market Context & Drivers
U.S. dollar strength, easing safe-haven demand, and optimistic trade sentiment are constraining gold’s upside unless breakout forces emerge .
Key upcoming catalysts: FOMC guidance, U.S. macro data (GDP, inflation), and geopolitical developments—their tone could tip the bias direction .
⚙️ Trade Rules & Risk Management
Wait for a confirmed breakout or breakdown—do not trade mid-range.
Confirm break with at least one close outside the triangle and rising volume .
Position sizing: Risk 1–2% per trade, adjust stop-loss to price structure ($8–$15 depending on volatility).
Take profits in stages: scale out at minor milestones (first targets), trail stop for extended targets.
Avoid chasing price within the middle of the triangle—risk/reward is unfavorable.
🧠 Why This Plan?
Follows textbook symmetrical triangle trading methodology: entry on breakout, stop beyond pattern opposite side, projection based on triangle height .
Aligns with broader outlook: bearish unless convincing upside breakout appears, consistent with analyst consensus hedging current bull exhaustion and wait‑and‑see on policy signals .
✅ Summary
Gold is coiling inside a tight triangle range near $3,326–$3,334, with breakout potential identified to either side:
Bullish breakout over $3,344–$3,350 targets up to $3,550 or beyond.
Bearish breakdown under $3,326–$3,320 risks slide towards $3,300–$3,255.
Wait for confirmation, apply disciplined risk controls, and let volume validate the move.
