GOLD Massive Short! SELL!
My dear followers,
This is my opinion on the GOLD next move:
The asset is approaching an important pivot point 3350.4
Bias - Bearish
Safe Stop Loss - 3363.2
Technical Indicators: Supper Trend generates a clear short signal while Pivot Point HL is currently determining the overall Bearish trend of the market.
Goal - 3328.2
About Used Indicators:
For more efficient signals, super-trend is used in combination with other indicators like Pivot Points.
Disclosure: I am part of Trade Nation's Influencer program and receive a monthly fee for using their TradingView charts in my analysis.
———————————
WISH YOU ALL LUCK
Trend Analysis

Beware of gold, false rise and real fall
💡Message Strategy
The global economic uncertainty has intensified recently, and the gold market has performed well. On Monday, the price of gold rose by 0.87%, hitting a bottom of $3247.87 per ounce before rebounding strongly. The upward trend continued in early trading on Tuesday. In the second quarter, the price of gold rose by 5.5%, rising for two consecutive quarters.
The main reason for this round of gold price rise is the weakening of the US dollar. The US dollar index has recorded its worst performance in the first half of the year since the 1970s. Market concerns about the expansion of the US fiscal deficit and uncertainty in trade agreements have weakened the attractiveness of the US dollar.
At the same time, global trade and geopolitical fluctuations, such as the Sino-US rare earth agreement, the progress of US-EU trade negotiations, and the uncertainty of the tariff deadline on July 9, have strengthened the safe-haven properties of gold. This week's focus is on Thursday's US non-farm payrolls report for June. The market expects 110,000 new jobs and an unemployment rate of 4.3%, which will directly affect the direction of the Federal Reserve's monetary policy.
Although the Federal Reserve is cautious about cutting interest rates, the market generally expects that interest rate cuts will be resumed in September, and the annual interest rate cut may reach 66 basis points. Trump's pressure on the Federal Reserve has also increased policy uncertainty.
Gold is driven up by multiple factors, but its future trend still depends on employment, inflation and tariff policies. Investors need to pay close attention to data and policy developments.
📊Technical aspects
Gold hit bottom and rebounded during the early trading session on Monday, and the price stopped after touching the previous low. The price stopped after touching the four-hour resistance position before the European session. The European session was under pressure before breaking through the four-hour resistance. After that, the U.S. session had consecutive positive days, and the price did not fall. Instead, it further broke through the four-hour resistance position, which means that the price still has the performance of testing the daily level resistance area. We will continue to follow the key breakthrough of 3300 on Monday and pay attention to the 3350-3360 area and then look at the pressure.
According to the daily level, after the price broke through the daily support last week, the price continued to rely on the daily resistance to bear pressure. At present, the daily resistance is at the 3360 area resistance. Below this position, gold can continue to be short.
According to the four-hour level, the four-hour key position is the key to our emphasis on short-term trends. Yesterday, the price broke through the four-hour resistance and is expected to adjust further. The current four-hour support is in the 3300 area. The price is short-term bullish above this position. After the subsequent high, it is expected to fall further after breaking the four-hour support again.
From the one-hour level, yesterday's strong closing, today's early trading again directly broke through yesterday's high position, so today's early trading low became the key. The price above this position tends to continue to test the daily resistance of 3360, so we will first look at the rebound, and wait until the price touches the daily resistance of 3350-3360, and then pay attention to further anti-K signals to see pressure.
💰Strategy Package
Short Position:3350-3360,SL:3370,Target: 3315-3300

$AAPL Long TradeAAPL finally broke above the daily cloud yesterday. Also the daily bands are very tight. July tends to be the most bullish month of the year for NASDAQ:AAPL


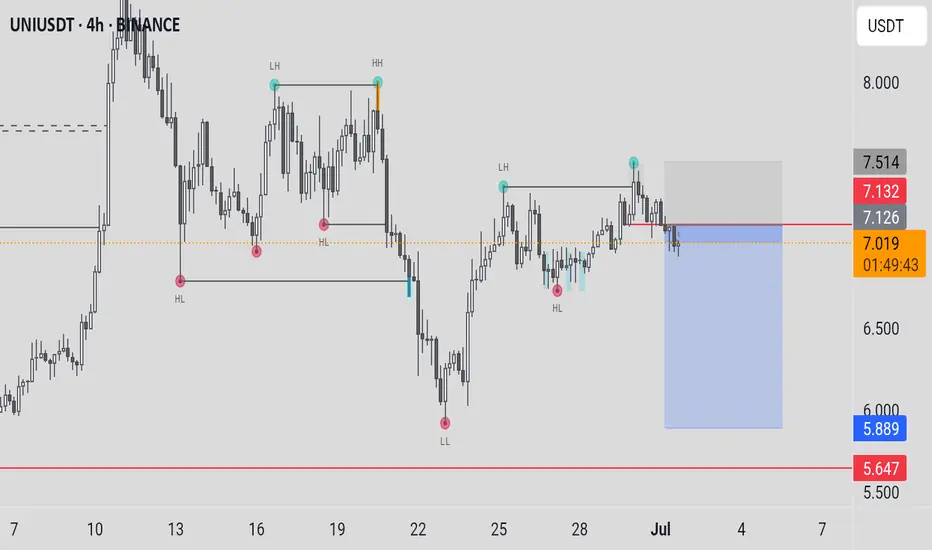
UNIUSDT Cryptocurrency Futures Market Disclaimer 🚨🚨🚨
Trading cryptocurrency futures involves high risks and is not suitable for all investors.
Cryptocurrency prices are highly volatile, which can lead to significant gains or losses in a short period.
Before engaging in crypto futures trading, consider your risk tolerance, experience, and financial situation.
Risk of Loss: You may lose more than your initial capital due to the leveraged nature of futures. You are fully responsible for any losses incurred.
Market Volatility: Crypto prices can fluctuate significantly due to factors such as market sentiment, regulations, or unforeseen events.
Leverage Risk: The use of leverage can amplify profits but also increases the risk of total loss.
Regulatory Uncertainty: Regulations related to cryptocurrencies vary by jurisdiction and may change, affecting the value or legality of trading.
Technical Risks: Platform disruptions, hacking, or technical issues may result in losses.
This information is not financial, investment, or trading advice. Consult a professional financial advisor before making decisions. We are not liable for any losses or damages arising from cryptocurrency futures trading.
Note: Ensure compliance with local regulations regarding cryptocurrency trading in your region.
thanks for like and follow @ydnldn
GOLD - SHORT TO $2,800 (UPDATE)Another beautiful, bearish rejection from our resistance zone on Gold. Our 1st resistance zone of $3,350 is still holding.
If buyers take out this level, another zone to watch out for is the $4,006 - $4,022 zone as there is a lot of pending liquidity sitting around that zone.

EURUSD Expected Growth! BUY!
My dear followers,
This is my opinion on the EURUSD next move:
The asset is approaching an important pivot point 1.1774
Bias -Bullish
Technical Indicators: Supper Trend generates a clear long signal while Pivot Point HL is currently determining the overall Bullish trend of the market.
Goal - 1.1792
About Used Indicators:
For more efficient signals, super-trend is used in combination with other indicators like Pivot Points.
Disclosure: I am part of Trade Nation's Influencer program and receive a monthly fee for using their TradingView charts in my analysis.
———————————
WISH YOU ALL LUCK

US100 POSSIBLE SELL OPPORTUNITY!!We’re going to see a possible sell opportunity on US100 from the current market price. SL 22594 take profit at 22178

Rotation from over valued equities in silver about to happen...I hear many people are selling their silver, thinking $36 is a high. But this is still the stealth accumulation phase. We will see a rotation of trillions into silver, that has a market cap of a few hundred billion, including miners.
In my book, "Silver is Money" we see stocks, bonds and government debt has kept a lid on inflation.
This coming rotation will bring about the biggest monetary change seen in generations.

Bitcoin Faces Impending Drop to Mid-30,000sAs of July 02, 2025, Bitcoin’s price chart, crafted by "RoadToAMillionClub" on TradingView, paints a concerning picture. Currently hovering at $107,831, the cryptocurrency appears to be teetering at the edge of its upper channel, signaling potential trouble ahead. The recent 0.51% dip may be just the beginning of a more significant decline.
The long-term upward trend, marked by a supportive orange line since 2018, has been a beacon for bulls. However, the green trend line projecting a drop toward the mid-30,000s range, around $37,932, suggests a looming correction. This level, a historical support zone, could become the next battleground as selling pressure mounts.
Market indicators point to overextension, with the price hitting a 4-day and 14-day high of $107,831 before the recent pullback. The speculative fervor that drove Bitcoin to these heights seems to be waning, increasing the likelihood of a bearish turn. Investors should brace for volatility, as the cryptocurrency may struggle to maintain its current altitude, potentially sliding toward the mid-30,000s in the coming months.

Tariff shadow and gold's safe-haven game
This week, market sentiment was stirred up and down by Trump's tariff stick. This unconventional president, while firing at Canada and Japan, let the July 9 tariff deadline hang like a knife over the heads of risky assets. If the suspension order is not extended, the market may have to relive the chaos of "Liberation Day" in April - gold will become the "safe-haven spare tire" at this time.
Although the situation in the Middle East has cooled down, gold has stabilized at $3,340 due to the weakness of the US dollar and tariff anxiety. After falling to 3,245 at the beginning of the week, it rebounded quickly, and the bulls were briefly revelry, but the real test will be on Thursday's non-agricultural data - whether it will rush to 3,400 or return to 3,300, it all depends on the face of the US dollar and Trump's next move. If the tariff powder keg is ignited, gold will rise; if it is postponed, this precious metal is afraid to "fall out of favor" again.
Technically, the daily line is long, with short-term support at 3,330-3,336 and resistance at 3,358-3,365. In terms of operation, continue to follow the trend and buy low at night, ambush near 3336-3330, and look at 3400 if it breaks.
The script of gold always switches between "panic" and "greed" - and Trump may be the most competent "director" at the moment.

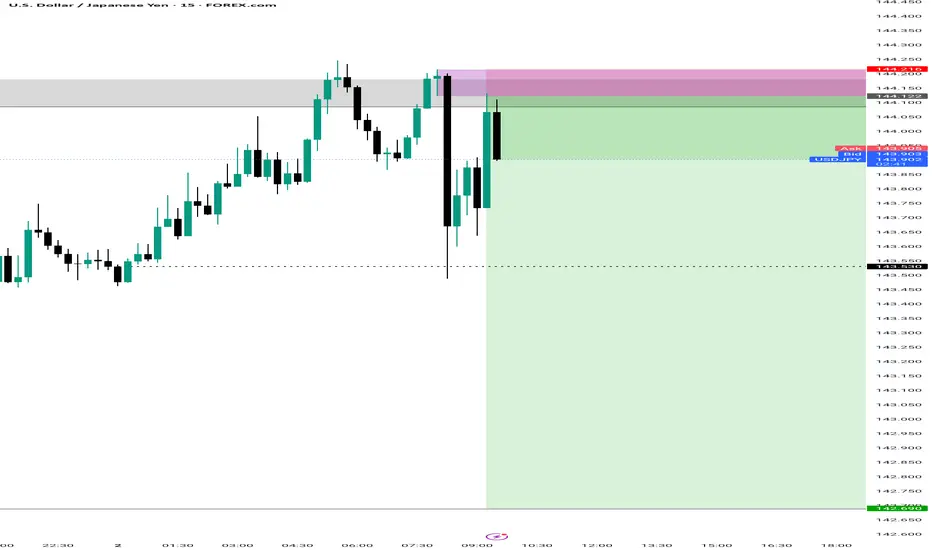
USDCAD LONG DAILY FORECAST Q3 D2 W27 Y25USDCAD LONG DAILY FORECAST Q3 D2 W27 Y25
Professional Risk Managers👋
Welcome back to another FRGNT chart update📈
Diving into some Forex setups using predominantly higher time frame order blocks alongside confirmation breaks of structure.
Let’s see what price action is telling us today! 👀
💡Here are some trade confluences📝
✅Daily Order block identified
✅4H Order Block identified
✅1H Order Block identified
🔑 Remember, to participate in trading comes always with a degree of risk, therefore as professional risk managers it remains vital that we stick to our risk management plan as well as our trading strategies.
📈The rest, we leave to the balance of probabilities.
💡Fail to plan. Plan to fail.
🏆It has always been that simple.
❤️Good luck with your trading journey, I shall see you at the very top.
🎯Trade consistent, FRGNT X

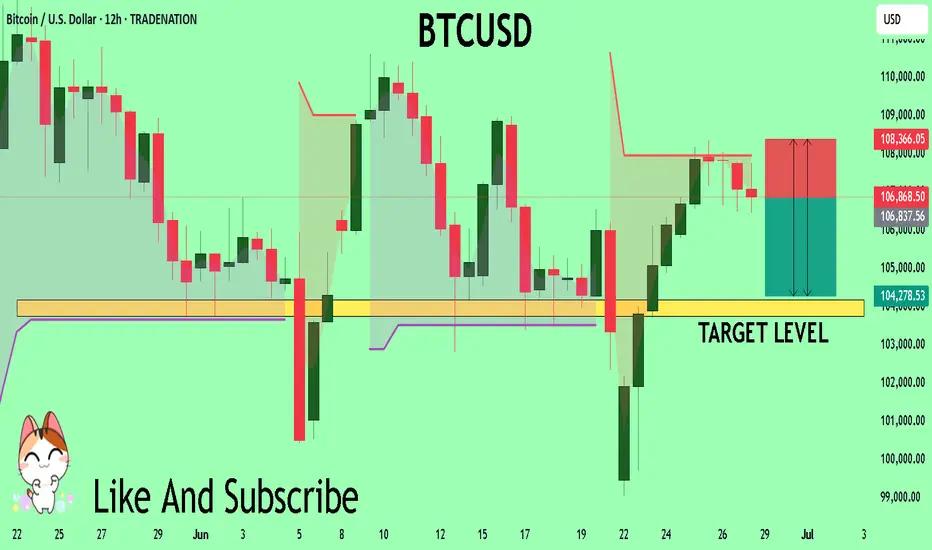
BTC BOUNCESBitcoin just pulled off a clean bounce off support, landing perfectly on the 50-day moving average around $105,800 – a level that’s repeatedly proven its importance. The move came with a solid +2% daily candle, reclaiming lost ground and putting the bulls back in control for now. Price is still trapped under the descending trendline just below $112,000, which has capped every breakout attempt over the past month, but momentum is shifting. As long as BTC stays above that support zone and keeps printing higher lows, the structure looks bullish. A breakout above that trendline would likely send us flying – but fall back below $105,800, and we’re probably retesting $100,700. For now, the bounce looks strong, the trend is intact, and the ball’s back in the bulls’ court.

Wind of Change - VOO ETFPlease watch this interesting article and feel the cool nice breeze blowing along...........
Nice , isn't it ?
As I read this article, I can't help as if a REAL giant fan was blowing at me although I know it is not REAL, just an image in my mind, magnified by the LED image and the sound as well.
And for a moment, I allowed it to play with my mind and instantly, I felt cooler.........
It is the same for reporters/journalists worldwide who made a living covering news and writing sensational news headlines to capture your eyeballs. Although we are not in Israel/Iran war, we too feel the pain and tragedy suffered by the innocent people.
How about the numerous floods happening in China ? I can't help but feel a sense of gratitude for where I am born - Singapore , free from natural disasters.
It is the same as INVESTING/TRADING. If you look at your P&L statement on a daily/hourly basis, it somehow spurs you to take an impulsive action. This is especially if you have lost some money and you wanted to quickly recover your losses. On one hand , you wanted it to go along but afraid the pullback may be too strong and your profits turn to losses again.
I remembered the book I read about - it says yesterday result was history. Whatever had happened , leave it there. Today is a fresh start and if you want to trade, you must have a brave heart and start afresh , look at your available capital (not including what you had lost) and do what you are supposed to do in the moment.
Social media is a double edge sword and every day, there are doomsday porns including marketing gurus telling you that the stock market is overvalued, tariffs this , tariffs that and you should sell. Did you ?
And there are also Asia bulls or rather China bulls that claims US funds are shifting to China and the price is going to the moon. I have often said treat this as entertainment , as reference but do your own due diligence.
A safer and lower risk is to get exposed to the VOO ETF where it is more diversified and you need not worry about a single company performance dragging the rest down.
Position sizing is also important - just because you had made some money (could be luck), it does not mean you should increase your position size (increase in risk) due to your greed. Consistency is the game in trading not BIG IN BIG OUT.

XAU/USDPrice action trading is a methodology where traders make decisions based on the interpretation of actual price movements on a chart, rather than relying primarily on lagging indicators. It involves observing and analyzing candlestick patterns, trend lines, support and resistance levels, and volume to identify potential trading opportunities and manage risk. The focus is on understanding the story the market is telling through its price behavior.

GBPUSD SHORT POSITION I think the price could go down from this range because I think this is a key point.

GBP/AUD Daily AnalysisPrice has found resistance at a price of 2.1000 for a number of days.
Mondays large bearish candle suggests that the price is still finding a ceiling at that price point.
This means that we could see some further selling.
If you agree with this analysis, look for a trading opportunity that meets your strategy rules.

BTCUSD Trading Opportunity! SELL!
My dear subscribers,
This is my opinion on the BTCUSD next move:
The instrument tests an important psychological level 10686
Bias - Bearish
Technical Indicators: Supper Trend gives a precise Bearish signal, while Pivot Point HL predicts price changes and potential reversals in the market.
Target - 10417
My Stop Loss - 10836
About Used Indicators:
On the subsequent day, trading above the pivot point is thought to indicate ongoing bullish sentiment, while trading below the pivot point indicates bearish sentiment.
Disclosure: I am part of Trade Nation's Influencer program and receive a monthly fee for using their TradingView charts in my analysis.
———————————
WISH YOU ALL LUCK
Sugar continue bearish but oversoldFOREXCOM:SUGAR Will continue go bearish but all indicators show that it is oversold. Waiting for the bullish monument and there will be a period of rolling back soon

XAU/USD – Testing 2H/1H Supply Zone | Breakout or Rejection?XAU/USD – Testing 1H/2H Supply Zone | Bullish Continuation or Rejection Ahead
Gold has rallied strongly from the support zone around 3,238–3,255, breaking multiple intraday resistance levels and now approaching a critical 1H/2H Supply Zone near 3,348–3,366.
This area previously acted as a strong sell-off zone, making it a key decision point.
Scenario 1: Bullish Continuation
If price breaks and closes above 3,366 with momentum, we could see further upside toward the next resistance at 3,400 and possibly retest the ATH zone at 3,486. A short consolidation or retest within the zone would confirm strength.
Scenario 2: Rejection from Supply Zone
If the supply holds, a rejection from the zone could lead to a pullback toward:
3,320.48 (minor support)
3,297.08 (support line)
Or deeper retracement to the 3,255–3,238 support zone
Key Technical Levels
Supply Zone: 3,348 – 3,366
Resistance: 3,400 – 3,486 (ATH)
Support Levels: 3,320 – 3,297 – 3,255 – 3,238
Pivot Line: 3,348

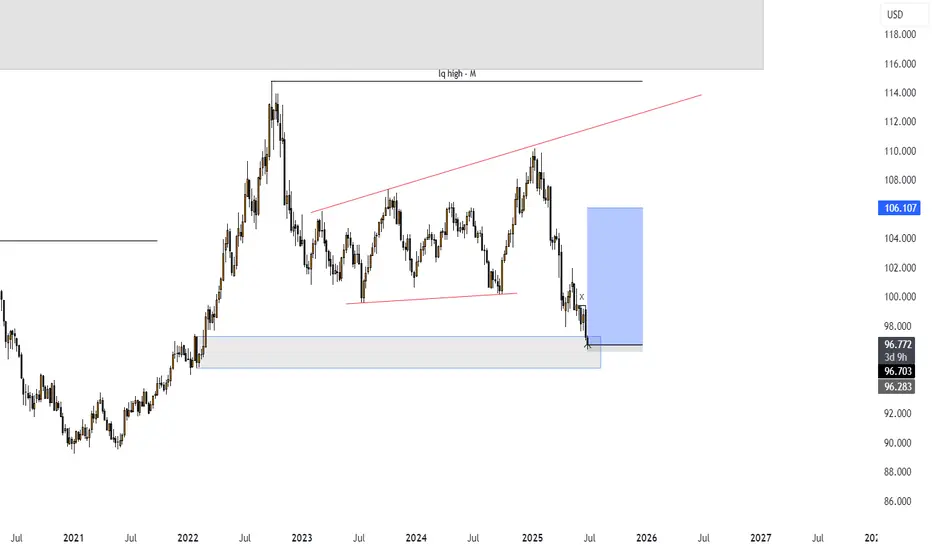
DXY - trade - market structure DXY - trade - market structure , easy setup, clean setup , good probability, if this happen is a big win, use risk and trade managment