FTTUSDT at the Edge! Breakdown or Massive Breakout?📌 Overview: A Rebirth from the Dead Zone
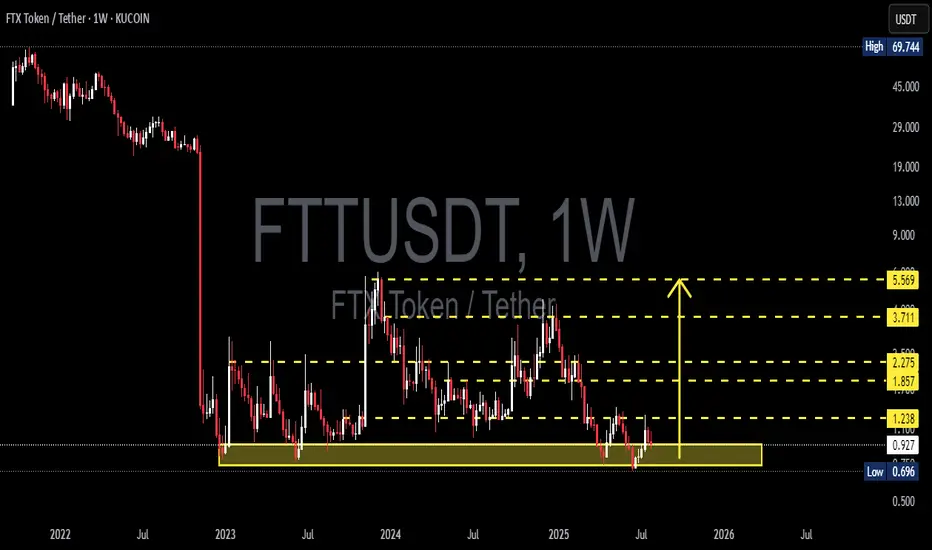
FTT/USDT is currently in one of its most technically compelling phases in the past two years. After suffering a catastrophic 98% crash following the collapse of the FTX ecosystem in 2022, price action now shows signs of long-term accumulation at a historically strong demand zone — potentially forming a solid base for a medium to long-term recovery.
The crucial support zone between $0.70 and $0.90 has been tested multiple times since late 2022 and has consistently held against extreme sell pressure. This suggests the presence of a strong historical demand area. Now that the price is once again reacting bullishly from this zone, the door is opening for a potential technical rebound.
---
🧠 Forming Pattern: Accumulation & Bottoming Structure
1. Base Accumulation Range:
A long period of sideways movement after the major crash.
Indicates exhaustion of selling pressure and possible stealth accumulation by smart money.
2. Potential Double Bottom or Rounded Bottom:
If this rebound holds, a double bottom could be confirmed with a breakout above $1.238.
A rounded bottom formation could signal a major reversal rally if backed by volume and catalysts.
---
🟢 Bullish Scenario (Reversal in Progress):
If buyers hold the current support and push through resistance levels:
🔓 Break above $1.238 = key reversal confirmation.
🚀 Potential bullish targets:
$1.857 – Previous minor resistance.
$2.275 – Former breakout zone.
$3.711 – Key structural level with historical liquidity.
$5.569 – Major psychological and technical target.
Strong confirmation if the breakout is supported by volume and a full-bodied weekly candle.
---
🔴 Bearish Scenario (Further Downside):
If price fails to hold the support zone:
📉 A breakdown below $0.696 would invalidate the bullish setup and could lead to:
New price discovery below $0.50
A potential “death spiral” if sell volume increases rapidly.
This scenario is extreme and would heavily depend on broader market sentiment and the future of the FTX recovery process.
---
🧭 Key Levels & Technical Insights:
Element Details
Strong Demand Zone $0.70 – $0.90 (multi-tested since 2022)
Bullish Trigger Level Break & retest of $1.238 with volume
Reversal Targets $1.857, $2.275, $3.711, and $5.569
Bearish Breakdown Loss of $0.696 = potential for new lows
Early Momentum Current bounce suggests possible start of reversal
---
💡 Final Thoughts:
> "FTT is no longer in a panic phase — it’s in a decision phase: will it rise as a ‘Phoenix Token’ from the ashes of FTX, or fall back into obscurity?"
Given the technical setup and long-term structure, this could be one of the most pivotal moments for FTT. Traders and investors should watch this level closely — the next major move is likely to begin from this very zone.
#FTTUSDT #FTTAnalysis #CryptoReversal #AltcoinWatch #TechnicalAnalysis #SupportResistance #BullishSetup #BearishScenario #DoubleBottom
Trend Analysis
XRP Price Prediction: Is a Breakout to $15 Imminent? XRP Breakout Targets $15 — Analyst Says 'This Is Just The Start': Is XRP Set to Explode?
The cryptocurrency world is once again turning its attention to XRP, the token developed by Ripple Labs, as bullish analysts predict an imminent and explosive rally. After a strong run-up earlier in 2025, XRP has pulled back slightly and is now approaching a critical support zone. Some analysts are now calling for a $15 breakout target, even as the token hovers near $2.80, a level many see as a pivotal point for the next leg of the bull market.
Let's dive into the latest developments, technical analysis, and market sentiment surrounding XRP — and why some believe "this is just the start."
XRP Price Overview: Current Positioning
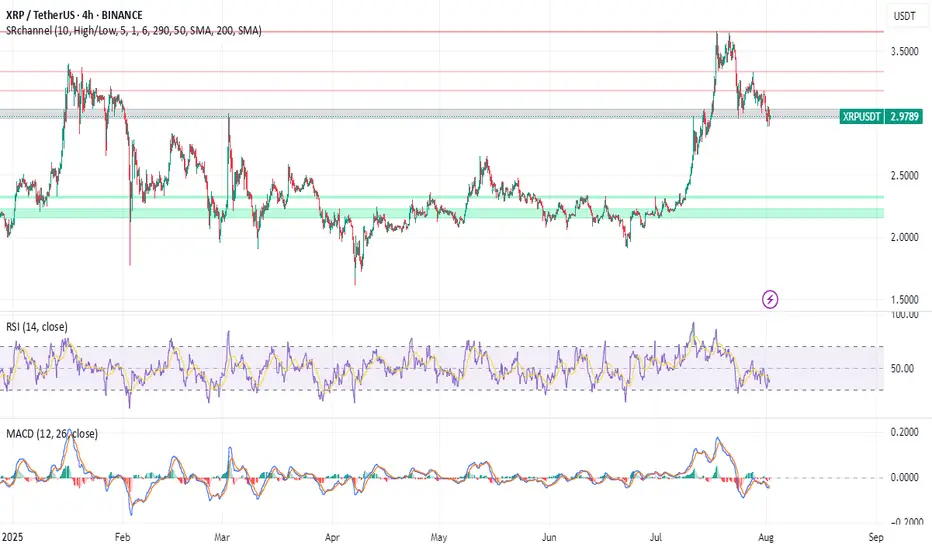
As of early August 2025, XRP is trading around the $2.85 mark, down from its recent high near $3.70. While this pullback may concern short-term traders, technical analysts argue that this retracement is healthy and necessary for the formation of a higher low, a common pattern in bullish market structures.
The key price levels to watch include a support zone between $2.80 and $2.95, resistance at $3.70, downside risk to $2.20 if $2.80 fails, and upside targets of $5 in the short term and $15 in the mid-term.
Why $2.80 Is So Important
The $2.80 support level is emerging as a make-or-break price zone. It aligns with multiple technical indicators including the 0.618 Fibonacci retracement from the previous rally, the Value Area High (VAH) from recent price accumulation zones, and Higher Time Frame (HTF) structure showing consistent support around this level in recent months.
If XRP manages to hold this level and establish a higher low, it could kick off a new bullish wave, potentially targeting $5 in the short term and beyond in the medium term.
Analysts Call for $15 XRP — Is It Possible?
Several key factors support the bull case. Institutional interest continues to grow as Ripple's partnerships with banks and financial institutions support long-term utility. Legal clarity has improved significantly after years of regulatory uncertainty, with the SEC lawsuit largely resolved, removing a major overhang. Technical indicators including bullish divergence on the RSI, MACD bullish crossover, and increasing volume all support upward momentum. Additionally, as Bitcoin stabilizes, funds are flowing into major altcoins, including XRP, as part of the typical altcoin rotation cycle.
August Rally Incoming? Bullish Divergence Signals 20% Upside
Technical analysts have identified a bullish divergence forming on the daily and 4-hour charts — a classic signal that often precedes a strong move upward. This divergence appears as the price makes lower lows while the RSI makes higher lows, suggesting momentum is shifting in favor of the bulls.
If confirmed, this divergence could catalyze a 20% rally in August, potentially pushing XRP back above $3.40 and testing the critical $3.70 resistance. A clean break above this level would likely open the floodgates for further gains.
$3.70: The Gatekeeper to Higher Highs
While there's excitement around the potential for XRP to hit $5 or even $15, the path forward must first go through $3.70. This resistance level has stalled price action multiple times in 2025 and will likely serve as a psychological and technical barrier.
Two scenarios are possible: a break above $3.70 would open the door to $5 and $7 targets quickly, while a rejection at $3.70 could lead to a pullback toward $2.20, especially if $2.80 fails.
Traders Hedge With New XRP Rival: Remittix
As XRP consolidates, some traders are diversifying their holdings into Remittix (RTX), a new cross-border payments token that promises enhanced scalability and compliance tools. RTX has gained traction recently, especially among DeFi-native traders seeking alternatives to XRP's centralized development model.
Remittix highlights include strong tokenomics with a deflationary model and staking rewards, a real-world use case targeting remittance markets in Asia and Africa, and a PayFi Wallet with beta slated for launch in Q3 2025, offering seamless integration with fiat on/off ramps.
While Remittix is gaining momentum, XRP's brand recognition, liquidity, and institutional partnerships still give it a significant edge in the payments space.
XRP Price Forecast: Short-Term and Long-Term Outlook
In the short term over the next 30 days, the bullish scenario involves holding $2.80 support, breaking $3.70, and rallying to $5. The bearish scenario would see XRP lose $2.80, drop to $2.20, and consolidate.
For the mid-term outlook in Q4 2025, if the bullish trend continues and macro conditions remain favorable, XRP could target $7 to $10 by the end of the year. In a full altseason scenario, $15 is not out of reach, according to some analysts.
Key Catalysts That Could Drive XRP Higher
Several catalysts could propel XRP higher. Institutional adoption continues to expand as Ripple's partnerships, especially in the Middle East and Asia-Pacific, lay the groundwork for long-term utility. CBDC integration presents another opportunity as Ripple works with multiple central banks on developing Central Bank Digital Currencies. Any progress here could significantly boost XRP's real-world use.
ETP listings could bring new inflows as XRP may benefit from exchange-traded products in Europe and Asia, especially if more crypto-based ETFs gain traction globally. The macro environment also favors growth, with a dovish Fed, weakening USD, and rising crypto adoption all creating a fertile environment for altcoins like XRP to thrive.
Community Sentiment: Is the XRP Army Ready?
The XRP community, also known as the XRP Army, remains one of the most passionate and active in the crypto space. Social media sentiment has turned increasingly bullish, with hashtags like #XRPToTheMoon and #XRP15 trending on X (formerly Twitter).
However, analysts caution against overexuberance, noting that market cycles can be volatile and unpredictable.
Risks to Watch
While the bullish case is compelling, it's important to consider the risks. Macro-economic shocks from a sudden shift in interest rates or recession fears could impact crypto markets broadly. Regulatory setbacks remain possible — although Ripple has gained legal clarity in the U.S., future regulations in Europe or Asia could cause volatility.
Network risks from any technical issues or security breaches could erode trust and trigger selloffs. Competition from new projects like Remittix, Stellar (XLM), and other payment-focused tokens could eat into XRP's market share.
Final Thoughts: Is XRP Set to Explode?
With XRP hovering near a critical support zone at $2.80, all eyes are on whether bulls can defend this level and push the token back into an uptrend. If successful, the next moves could be explosive, with analysts forecasting $5 in the short term and potentially $15 or higher before the end of 2025.
While risks remain, the technical setup, improving fundamentals, and renewed community optimism all point toward a bullish continuation — if key levels hold.
As always, investors should stay informed, manage risk, and avoid emotional decisions in this fast-moving market.
Summary
XRP currently trades around $2.85 with key support at $2.80 and major resistance at $3.70. Short-term targets point to $5 while mid-term projections suggest $10 to $15 is possible. Downside risk exists to $2.20 if support fails. Bullish catalysts include legal clarity, growing utility, and increasing adoption, while bearish risks encompass macro shocks, competition, and potential regulation.
Disclaimer
This article is for informational purposes only and is not financial advice. Cryptocurrency investments are highly volatile and involve significant risk. Always do your own research (DYOR) and consult with a financial advisor before making investment decisions.
USDCHFUSDCHF is expected to continue its downtrend next week. After a weak recovery attempt, selling pressure remains dominant. Traders should keep an eye on key support zones for potential trading opportunities.

NIKKEI: Strong Bullish Momentum Driven by Favorable IndicatorsData analysis indicates a "Bullish" bias for the NIKKEI, with a strong overall score. This positive outlook is supported by a confluence of factors, including Commitments of Traders (COT) data, retail positioning, seasonality, and trend. While some economic data points show neutrality or slight negativity, the overriding sentiment and key technical factors suggest a continued upward trajectory for the NIKKEI.
Key Supporting Factors (Bullish):
Strong Technicals/Momentum: The "Trend" and "Seasonality" scores of 2 each suggest strong underlying bullish momentum and favorable seasonal patterns for the NIKKEI.
COT & Retail Positioning: Positive scores in "COT" and "Retail Pos" (both 2) often indicate that institutional money and retail traders are aligned in a bullish direction, providing a strong foundation for upward movement.
GDP, SPMI, Retail Sales: These economic indicators, with scores of 1, are contributing positively to the overall bullish bias, indicating healthy economic activity.

Monero dump now back to $298.65Monero limit order short. Checked it late but might still be able to get in.
Sl: $305.39
Limit entry: 303.17 (bybit)
Tp: $298.65
Risk to reward: 1:2

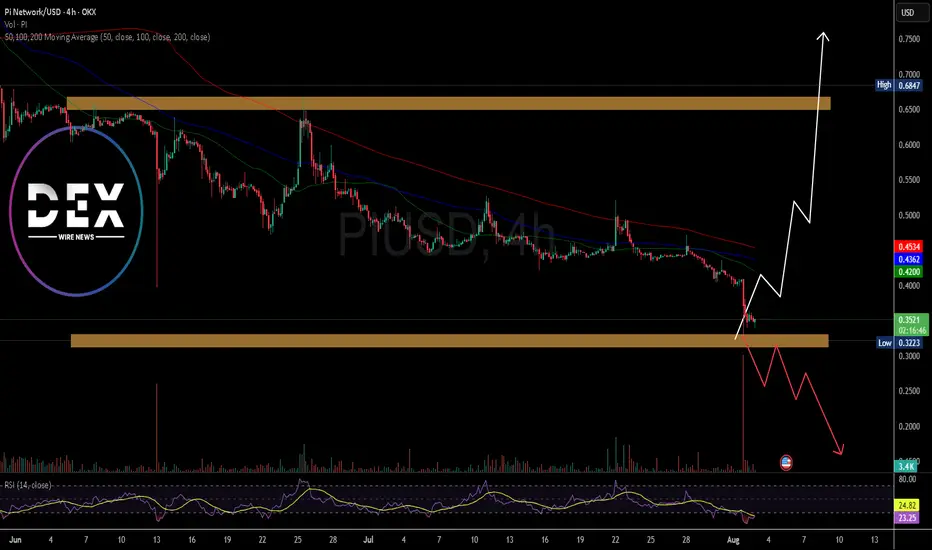
Is There Hope For PI Network? The Price of the notable altcoin NASDAQ:PI network has since seen a downtick of 80.86% since lunching and listing on major CEX like Kucoin, GateIo, OKX, etc. as per data from CMC.
The altcoin has lost the psychological $0.66 resistance zone forming a support or baseline at the $0.33 price range. with increasing selling pressure, NASDAQ:PI might experience further price dip to the $0.20 price point eventually leading to a deja vu to the $0.60 price point.
Possible factor to present price degradation is the dip in CRYPTOCAP:BTC 's price that most coins follow suit, and NASDAQ:PI wasn't an exception.
NASDAQ:PI is currently oversold as hinted by the data from Trading view. the altcoin has an RSI of 20 which entails weak momentum and possible chances of a market turnaround.
What Is Pi Network?
Pi Network is a social cryptocurrency, developer platform, and ecosystem designed for widespread accessibility and real-world utility. It enables users to mine and transact Pi using a mobile-friendly interface while supporting applications built within its blockchain ecosystem.
Pi Price Data
The Pi price today is $0.346618 USD with a 24-hour trading volume of $174,236,091 USD. Pi is down 14.58% in the last 24 hours. The current CoinMarketCap ranking is #38, with a market cap of $2,692,698,184 USD. It has a circulating supply of 7,768,487,700 PI coins and a max. supply of 100,000,000,000 PI coins.
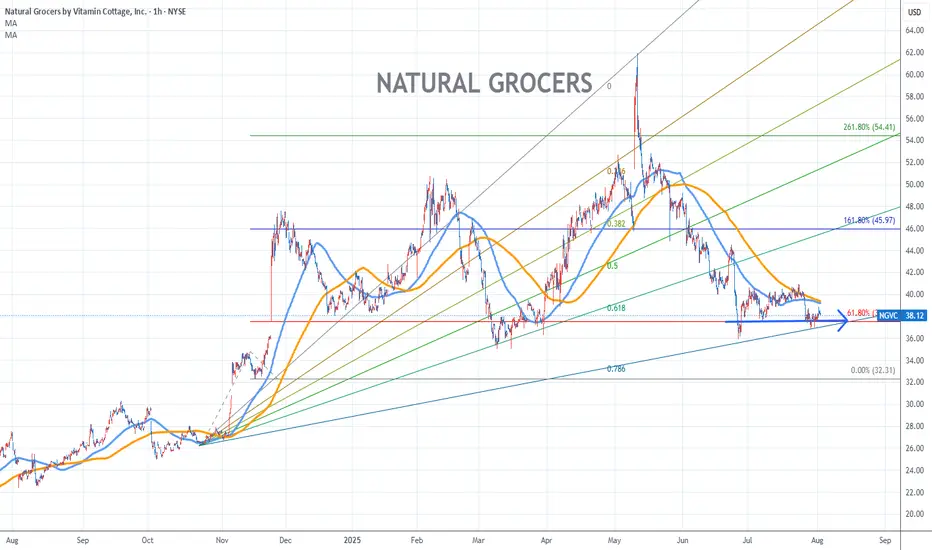
Natural Grocers Stock Chart Fibonacci Analysis 080125Trading Idea
1) Find a FIBO slingshot
2) Check FIBO 61.80% level
3) Entry Point > 38/61.80%
Chart time frame:B
A) 15 min(1W-3M)
B) 1 hr(3M-6M)
C) 4 hr(6M-1year)
D) 1 day(1-3years)
Stock progress:A
A) Keep rising over 61.80% resistance
B) 61.80% resistance
C) 61.80% support
D) Hit the bottom
E) Hit the top
Stocks rise as they rise from support and fall from resistance. Our goal is to find a low support point and enter. It can be referred to as buying at the pullback point. The pullback point can be found with a Fibonacci extension of 61.80%. This is a step to find entry level. 1) Find a triangle (Fibonacci Speed Fan Line) that connects the high (resistance) and low (support) points of the stock in progress, where it is continuously expressed as a Slingshot, 2) and create a Fibonacci extension level for the first rising wave from the start point of slingshot pattern.
When the current price goes over 61.80% level , that can be a good entry point, especially if the SMA 100 and 200 curves are gathered together at 61.80%, it is a very good entry point.
As a great help, tradingview provides these Fibonacci speed fan lines and extension levels with ease. So if you use the Fibonacci fan line, the extension level, and the SMA 100/200 curve well, you can find an entry point for the stock market. At least you have to enter at this low point to avoid trading failure, and if you are skilled at entering this low point, with fibonacci6180 technique, your reading skill to chart will be greatly improved.
If you want to do day trading, please set the time frame to 5 minutes or 15 minutes, and you will see many of the low point of rising stocks.
If want to prefer long term range trading, you can set the time frame to 1 hr or 1 day.
6F EUR/USD Trade Plan (15-Minute Chart)Structure & Fibonacci Setup
Swing low at 1.14994 (Aug 1 15:30) → swing high at 1.15935 (Aug 4 09:30).
Draw 0–100% retracement; project extensions beyond 100% for targets (Murphy, 1999).
Entries
First Scale-In:
Sell 1 contract at the 14.6% retracement (~1.15835).
Full Position:
Sell 10 contracts at the Fib 61.8–161.8% extension confluence (~1.17103).
Profit-Taking Levels
TP 1: Fib 78.6% extension at 1.14141
TP 2: Fib 100% extension at 1.12778
TP 3: Fib 161.8% extension (“risk-off” zone) at 1.10559 (Smith, 2023)
Risk Management
Stop-Loss: Above the 200% extension (~1.17857), just beyond the recent swing high (CME Group, 2025).
Position Sizing: Scale in to control risk; initial 1-lot entry limits drawdown if confluence fails.
Rationale
Anticipate Monday risk-off flows to strengthen USD and push EUR/USD lower.
Multi-leg entries align with high-probability Fib confluence zones and macro USD bias (Murphy, 1999; Smith, 2023).
References
CME Group. (2025). Euro FX Futures contract specifications. Retrieved from www.cmegroup.com
Murphy, J. J. (1999). Technical analysis of the financial markets: A comprehensive guide to trading methods and applications. New York Institute of Finance.
Smith, A. (2023). Risk-off and currency correlations. Journal of FX Markets, 5(2), 45–60.

GBpJpY RETRACEMENT This is a possible retracement
Use a reasonable lot size
Risk only what you can afford
I wish you success

QKCUSDT Forming Bullish PennantQKCUSDT is exhibiting a bullish pennant pattern, a highly regarded continuation formation that signals the potential for another significant upward move following its previous bullish momentum. This pattern typically reflects a brief consolidation period where price action narrows before a breakout occurs in the direction of the prior trend. The tightening range seen in QKC is a positive sign that buyers are holding ground and preparing for the next wave upward.
The trading volume on QKCUSDT has remained consistently healthy, which is a critical component in validating bullish patterns. A breakout above the pennant resistance with a surge in volume could act as the catalyst for a rapid price acceleration. The projected gain of 30% to 40% is aligned with typical outcomes from this pattern, particularly in bullish crypto market conditions.
Market sentiment around QKC is beginning to heat up, with more retail and technical traders identifying its potential. The increasing interest from investors signals rising confidence in the project, supported by improved liquidity and stronger community backing. This adds fundamental strength to the technical setup, further supporting the bullish outlook.
With favorable market structure, good volume, and growing investor attention, QKCUSDT appears to be on the verge of a breakout. Traders watching this setup should keep a close eye on key resistance levels and volume spikes, as these will likely dictate the timing and strength of the next move.
✅ Show your support by hitting the like button and
✅ Leaving a comment below! (What is You opinion about this Coin)
Your feedback and engagement keep me inspired to share more insightful market analysis with you!

NZD-JPY Local Long! Buy!
Hello,Traders!
NZD-JPY is retsting a
Strong horizontal support
Level around 87.044 and
As the pair is locally
Oversold we will be expecting
A local rebound and a move
Up on Monday!
Buy!
Comment and subscribe to help us grow!
Check out other forecasts below too!
Disclosure: I am part of Trade Nation's Influencer program and receive a monthly fee for using their TradingView charts in my analysis.

NZDUSD Bearish towards .5925!1). Wave 5 drop needs a completion lower! 2). Risk is selling off! 3). Volume is falling! 4). Price appears to be heading towards lower market sentiment! 5). Trump is imposing more Tariffs, which is likely causing deeper corrections!

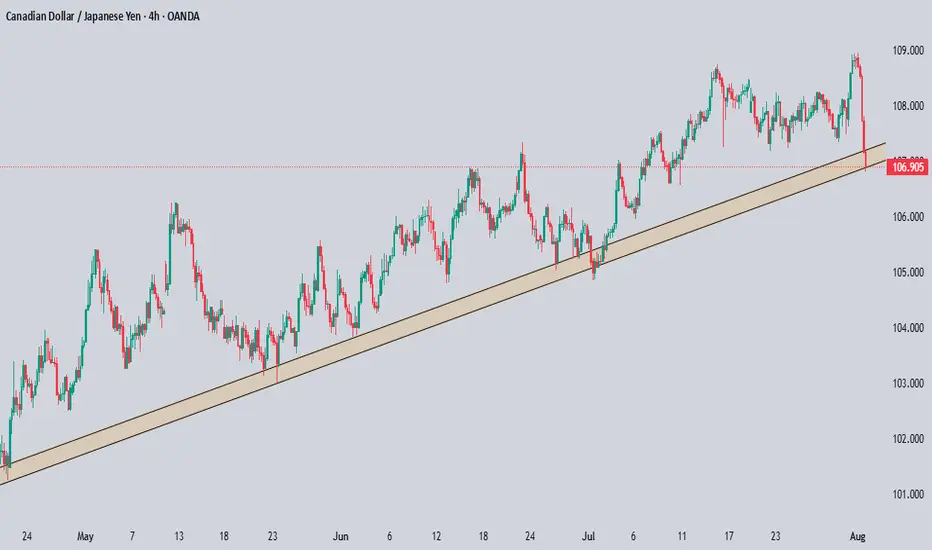
CADJPY Technical & Order Flow AnalysisOur analysis is based on a multi-timeframe top-down approach and fundamental analysis.
Based on our assessment, the price is expected to return to the monthly level.
DISCLAIMER: This analysis may change at any time without notice and is solely intended to assist traders in making independent investment decisions. Please note that this is a prediction, and I have no obligation to act on it, nor should you.
Please support our analysis with a boost or comment!
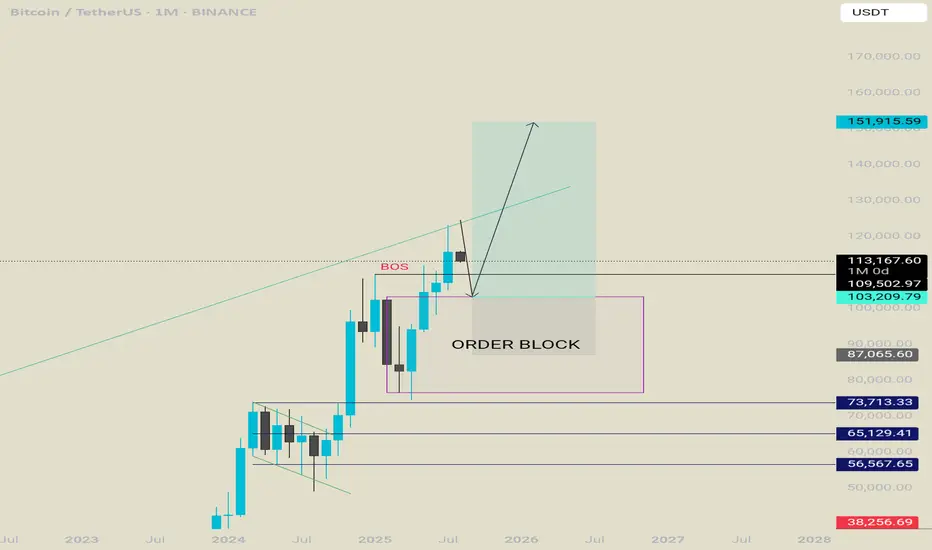
Bitcoin projection for the rest of the year. Bullish.We are in a retracement phase , i think btc will retrace deep enough to convince people that bull run is over . Once that happens it will flip to the upside and leave everyone shocked.
A retrace towards 108k-104k is possible.
Once they get tapped btc will start a new run towards a new all time high where everything will get to an end and a new besr market will start. Until then lets enjoy the rest of the year.
SOLANA BULLISH MEGAPHONE PATTERN LOADING! solana continues to move step by step towards higher levels within the bullish megaphone pattern, which will make movements towards ATH and more inevitable in the coming period

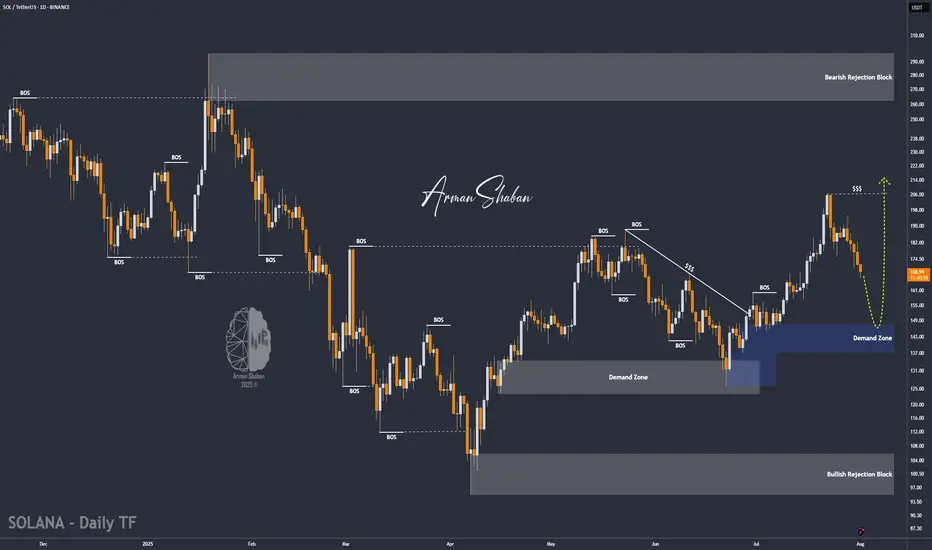
SOL/USDT | NFP Volatility Could Trigger Drop Toward $154!By analyzing the Solana chart on the daily timeframe, we can see that the price is currently trading around $169. If it fails to hold above the $168 level, a deeper drop could follow. With the upcoming NFP data release, increased volatility is expected across the markets. If Solana begins to decline, the potential correction targets are $163, $157, and $154. Watch the $145–$154 zone closely for a possible bullish reaction and buy opportunity.
Please support me with your likes and comments to motivate me to share more analysis with you and share your opinion about the possible trend of this chart with me !
Best Regards , Arman Shaban
Eur/Audin this pair we can buy save i dont see sell signals , any way be cearful use money management

USDCHF SHORT IDEA FULL BREAKDOWNUSD/CHF is flashing a strong bearish signal from both a macro and sentiment perspective.
✅ Bearish USD Drivers:
FOMC Pivot Watch: July meeting minutes hinted at potential rate cuts before year-end due to inflation moderating and soft jobs data.
Rising Swiss Franc Demand: CHF is benefiting from safe haven flows amid escalating tensions in Eastern Europe and shaky U.S. equity markets.
Swiss CPI Stable: Inflation is in check, allowing SNB to maintain their policy stance without pressure.
Institutional traders are reducing their exposure to the U.S. dollar, while retail traders are net long USDCHF — a classic contrarian bearish signal. Seasonality also favors Swiss Franc strength in August. On the macro side, U.S. data is underwhelming: job growth has slowed, services PMI is soft, and inflation metrics (CPI, PCE) are cooling. This has increased expectations for a Fed rate cut later in the year. Meanwhile, the Swiss National Bank remains stable with no urgency to ease policy. Combined with global risk-off sentiment, capital is flowing into CHF, giving it an added edge over the dollar.

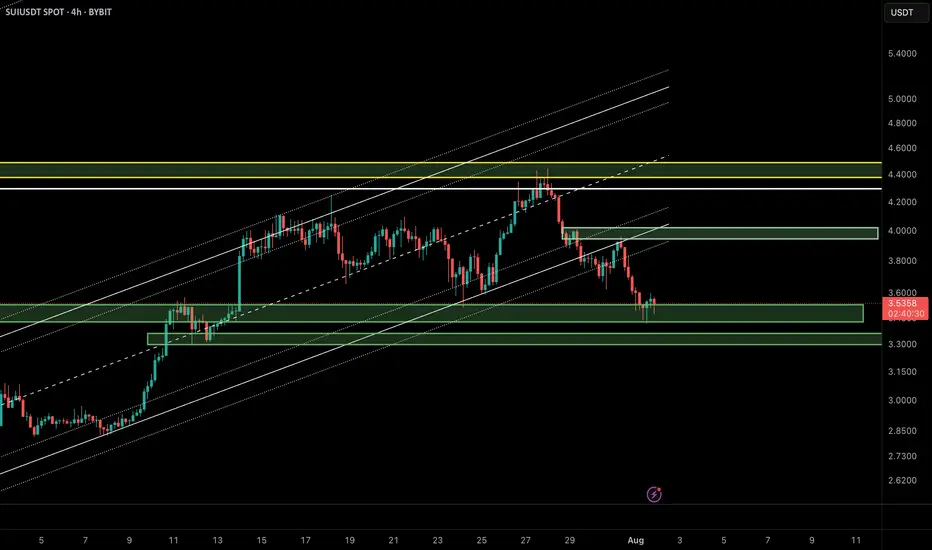
SUI/USDT Update – Bounce Setup from Demand Zone?In the previous analysis, we highlighted a short opportunity near $4.20, which played out perfectly. Now, SUI has reached a key demand zone around $3.40–$3.55, overlapping with the lower boundary of the ascending channel and a previously defined bullish order block.
🔹 Market Structure:
After breaking the bullish structure, price is now revisiting a major liquidity zone between $3.40 and $3.55.
🔹 Price Behavior:
Wicks to the downside suggest buy-side absorption and potential for short-term reversal.
🔹 Possible Scenario:
If the $3.40 zone holds, we could see a corrective move up to the supply zone around $3.90–$4.00.
📌 Key Levels:
• Support: $3.40–$3.55
• Resistance: $3.90–$4.00
❗️If the $3.40 support fails, bullish momentum will likely be invalidated in the short term.
🧠 Pro Tip (SMC-based):
When a demand zone aligns with liquidity sweep and channel support, it often becomes a high-probability area for institutional re-entries. Wait for a clear confirmation like BOS or bullish engulfing candle before entering.
⸻
🔗 Like, share, and follow for more Smart Money & Elliott Wave-based insights!
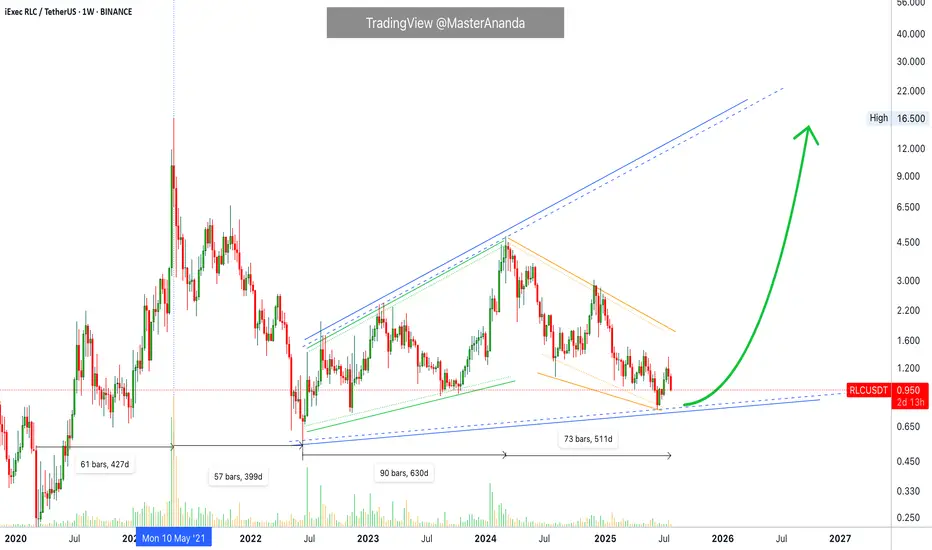
iExec RLC · Trading at Bottom with a Bullish BiasiExec RLC (RLCUSDT) is still trading at bottom prices but the overall market conditions are good. Good for the future because the market moves in waves alternating always between rising and falling.
RLCUSDT went bearish between May 2021 and June 2022, 399 days. Then it went bullish from June 2022 to March 2024, 630 days. Then it went bearish again between March 2024 and present day, August 2025. More than 510 days.
While RLCUSDT has been bearish more than a year, the action is still happening as a long-term higher low. That is, prices today and at the lowest—16-June 2025—are still higher compared to the low in June 2022.
Of course before being bearish in 2022 the market was bullish between March 2020 and May 2021, 427 days. Here we can clearly see the fluctuations between bear and bull, uptrends and downtrends.
The last uptrend came in 2021 and we are due a new one. Crypto grows every four years and market conditions are perfect for the next run. The market has been mixed, sideways and neutral for years on end, the long-term higher low is a single of strength. After the current retrace is over, you can prepare for a major bullish wave.
Namaste.
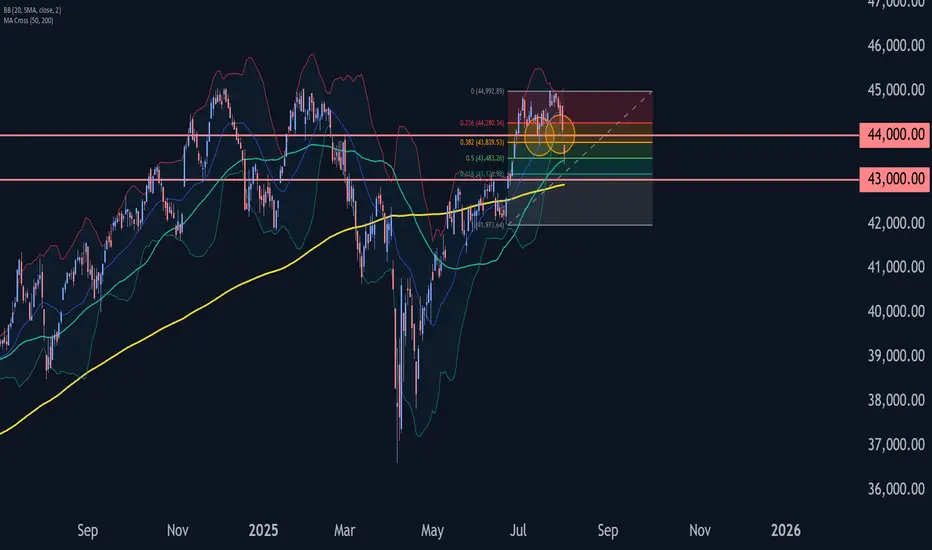
Dow Jones Wave Analysis – 1 August 2025
- Dow Jones broke the support zone
- Likely to fall to support level 43000.00
The Dow Jones index broke the support zone between the support level 44000.00 and the 38.2% Fibonacci correction of the upward impulse from June.
The breakout of this support zone accelerated the active short-term correction iv.
Dow Jones index can be expected to fall to the next support level at 43000.00 (target for the completion of the active correction iv and the former resistance from May and June).
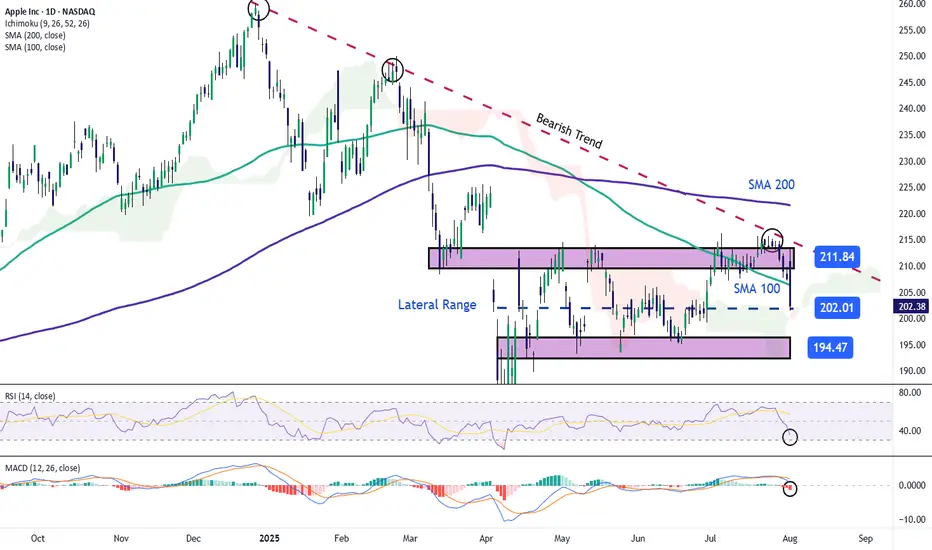
Apple Stock Falls Despite Strong EarningsApple stock is down more than 4% in the final session of the week, following the company’s earnings release yesterday. Apple reported earnings per share of $1.57, beating expectations of $1.43, while total revenue reached $94.04 billion, surpassing the $89.53 billion forecasted by the market.
However, despite the strong results, the stock is once again facing a notable short-term bearish bias as investor concerns grow. The primary issue is the perception that Apple is falling behind in the race for artificial intelligence, especially compared to its main competitors. In addition, shortly after the earnings announcement, it was noted that the company may face challenges in sustaining growth throughout the remainder of 2025, which has fueled additional downward pressure on the stock.
Sideways Range Emerges
In recent weeks, Apple’s price action has consolidated within a clear lateral range, with resistance around $211 and support near $194. So far, price fluctuations have not been strong enough to break this structure, and the latest bearish candlestick has reinforced the validity of the channel. For now, this sideways range remains the most relevant technical formation to watch in the upcoming sessions.
Technical Indicators
RSI:
The RSI line is falling rapidly and is now approaching the oversold zone at the 30 level. If the indicator reaches that threshold, it could suggest a technical imbalance, opening the door to a short-term bullish correction.
MACD:
The MACD histogram has moved into negative territory in recent sessions, suggesting a clear dominance of bearish momentum in the moving average structure. If this persists, selling pressure may continue to build in the near term.
Key Levels to Watch:
$211 – Main Resistance: Upper boundary of the current range. A breakout above this level could trigger a stronger bullish trend.
$200 – Psychological Support: Round number zone, a breakdown here could activate an immediate bearish bias for the next sessions.
$194 – Key Support: Corresponds to recent weekly lows. A move below this level would likely confirm a more extended bearish trend.
Written by Julian Pineda, CFA – Market Analyst
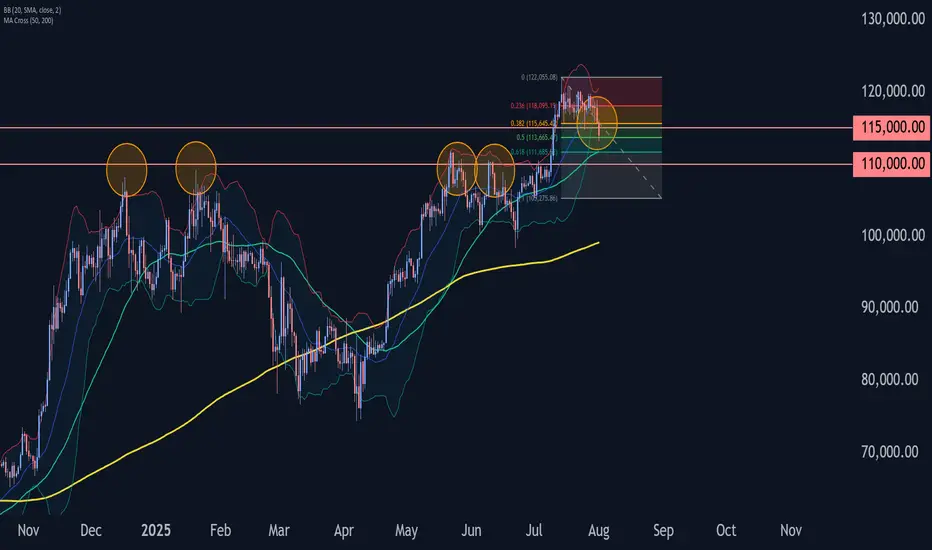
Bitcoin Wave Analysis – 1 August 2025- Bitcoin broke the pivotal support level 115000.00
- Likely to fall to support level 110000.00
Bitcoin cryptocurrency recently broke below the pivotal support level 115000.00, coinciding with the 50% Fibonacci correction of the sharp upward impulse from the start of July.
The breakout of the support level 115000.00 strengthened the bearish pressure on Bitcoin.
Given the bearish sentiment seen across the cryptocurrency markets today, Bitcoin can be expected to fall to the next support level at 110000.00 (former resistance from May and June).