GBP_NZD BEARISH BIAS|SHORT|
✅GBP_NZD has retested
A resistance level of 2.2500
And we are seeing a bearish reaction
With the price going down so we are
Bearish biased now and we will be
Expecting the pair to go further down
SHORT🔥
✅Like and subscribe to never miss a new idea!✅
Disclosure: I am part of Trade Nation's Influencer program and receive a monthly fee for using their TradingView charts in my analysis.
Trend Analysis

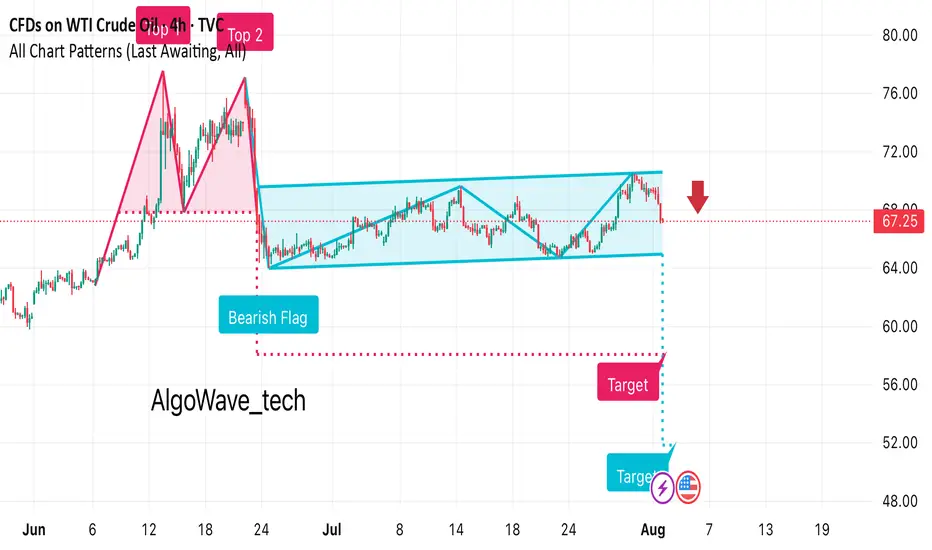
It looks like this chart for WTI Crude Oil is showing a bearish • Previous Move: There’s a strong downward leg before the flag formation, indicating bearish momentum.
• Flag Pattern: Price consolidates in an upward-sloping channel after the drop.
• Breakout: The chart suggests a bearish breakout below the channel, marked with a red arrow at around $67.25.
• Target Projection: The measured move target appears to be around the $53–54 range, based on the flagpole height.
Retail Trap at Resistance📣 Team, get this…
CRV printed 5 green candles, triggered a golden cross, and suddenly every YouTube thumbnail said “TO THE MOON.” 🌝 That’s exactly the kind of retail trap we love to fade. This ain’t DeFi summer, it’s just overheated spaghetti. 🍝
🔥 TRADE SETUP
Bias: Short
Strategy: Retail Trap at Resistance
Entry: $0.98 – $1.03
SL: $1.10
TPs: $0.78, $0.65, $0.50
Why?
– RSI 83 + MACD maxed out = overcooked
– LTF CHoCH after sweeping $1.03
– Positive funding across exchanges → ripe for short squeeze reversal
– Retail buying golden cross = premium exit liquidity
Candle Craft | Signal. Structure. Execution.

META: Testing Alternative Interconnection TypeResearch Notes
Given expression like this:
Fractal Corridors can be used for horizontal perspective of the same pattern manifestation. Alternative frames of reference exposes how historic swings of various magnitude in some way wire the following price dynamics. www.tradingview.com helps to seek a matching commonality in angles of trends which gives a hint how structure evolves in multi-scale perspective.
I use both when it comes to working with complex waves and making interconnections through fibonacci ratios.
To define emerging wave's limits (probable amplitude), I'll test classic rule of Support/Resistance shift in fibs. (When resistance becomes support or vice versa)
By theory it means a trendline can also shift like that.
In our case this can be applied as:
Fibocnacci Structure:

**#XAUUSD H5 Higher Timeframe Analysis**
📊 **#XAUUSD H5 Higher Timeframe Analysis**
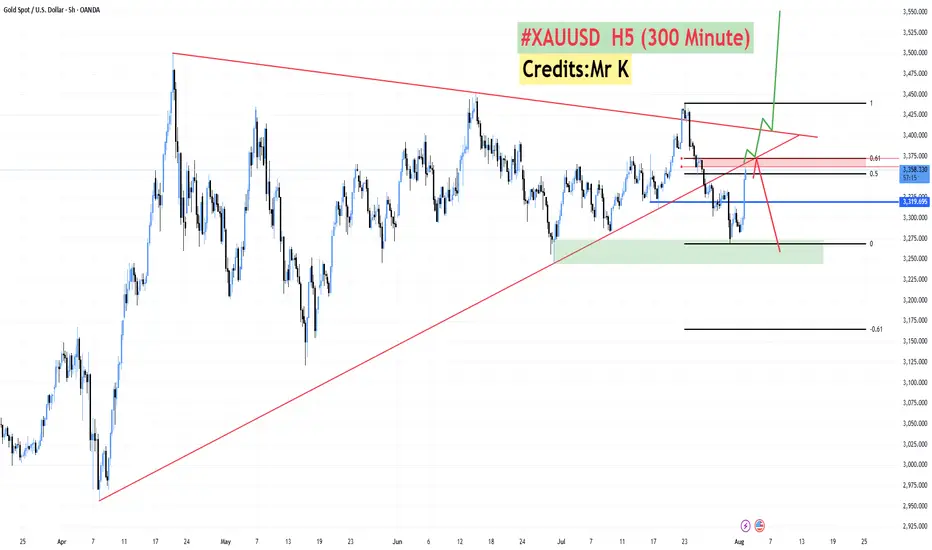
What we witnessed today was a **tremendous recovery in Gold 🟡** after **3–4 consecutive bearish sessions 📉**.
📅 **Today’s candle** has **completely flipped the weekly structure**, turning a fully **bearish weekly candle into a bullish one 📈** — thanks to the **NFP data** that came in **favor of Gold and against the Dollar 💵❌**.
🔍 However, price is now approaching a **critical confluence zone**:
* 🧭 A **long-running trendline** (since April)
* 🔴 An **H4 Bearish Order Block**
* 📐 The **Fibonacci Golden Zone (0.50–0.618)** at **3362–3372**
📌 **From this level, we have two possible scenarios:**
1️⃣ **Sharp Rejection 🔻:**
Price may **reverse sharply** from the 3362–3372 zone and **resume the bearish trend**.
2️⃣ **Breakout & Trap Theory 🔺:**
If price **sustains above this zone**, it may signal that the recent **3–4 day drop was a fake breakdown**, designed to **trap sellers** and grab liquidity for a **further upside move**.
✅ **Confirmation will come if we get an H4–H6 bullish candle close above the trendline** and back inside the **buying zone of 3375–3390**.
🔓 **A breakout above the triangle pattern** will likely lead to a **strong bullish continuation 📈🚀**.
Bitcoin Could Accept bearish TrendBitcoin is currently testing a key resistance zone between 120,000 and 121,000. While price action is attempting to break higher, market conditions suggest the possibility of a false breakout rather than a sustained bullish continuation.
BTC has approached a significant resistance band, and early signs of exhaustion are visible. Unless the price decisively holds above 121,000, any breakout may lack conviction. Given the broader unresolved downtrend, a corrective move remains likely.
If the breakout fails to sustain, we anticipate a pullback toward the 117,000 to 115,000 range. This would align with a retest of previous support zones and continuation of the short-term bearish structure.
Ps: Support with like and comments for better analysis Thanks.

How to seize the key turning points in the gold market?The market is ever-changing, and following the trend is the best strategy. When the trend emerges, jump in; don't buy against it, or you'll suffer. Remember not to act on impulse when trading. The market is a haven for all kinds of resistance, so don't hold onto positions. I'm sure many people have experienced this: the more you hold onto positions, the more panic you become, leading to ever-increasing losses, poor sleep, and missed opportunities. If you share these concerns, why not try following Tian Haoyang's lead and see if it can open your eyes? I'm always here for you if you need help, but how can I help you if you don't even offer a hand?
Gold did not fall below 3280 during the day on Friday and started to fluctuate in the range of 3280-3300. The non-farm payroll data was bullish, and it directly broke through the pressure of 3315, and then broke through the important pressure of 3335 again. As of now, it has reached a high near 3355. The non-farm payroll data market has almost been exhausted. Next, we will focus on the technical form adjustment. At present, you can consider light shorting in the area near 3355-3370. After all, chasing long is risky, and the technical side needs to be adjusted. If your current operation is not ideal, I hope I can help you avoid detours in your investment. Welcome to communicate with me.
Based on the 4-hour chart, short-term resistance is near 3355-3365, with a focus on the key resistance level of 3370-3375. Short-term buy orders should be taken if a rebound continues. I'll provide detailed trading strategies at the bottom of the page, so stay tuned.
Gold operation strategy: Short gold in batches when gold rebounds to 3355-3370, with the target being the area around 3340-3335. Continue to hold if it breaks through.

EURO long: The "What If?" tradeHello traders
The Euro is showing signs of bottoming out at the weekly support levels against
USD, JPY, CAD and AUD.
MOST IMPORTANT:
USD:
While King Dollar is clearly reigning after the FOMC indication not to expect rate cuts any time soon and solid economic data, the "What If" factor is NFP tomorrow and to a minor extent month end settling. If the NFP print comes in significantly lower than expectations, the Euro may pop higher. If the print is above expectations, still take a moment to check where the most jobs are. if it is in hospitality and leisure, it is probably summer hiring.
JPY: The BoJ kept rates unchanged.
CAD: The loonie is under siege with Trump's renewed 35% tariffs announced today. However, IF Russian sanctions against oil sales come to fruition, the CAD may strengthen. Watch Oil prices.
AUD: CPI came in below expectations. PPI has just printed lower too.
The Euro Zone's unemployment rate ticked down and German CPI ticked higher. The impact of tariffs seems to be priced in for the moment.
The biggest "What If" ?
The decision of the Federal Appeals Court if the International Trade Court verdict is upheld. In that case, it is all but guaranteed that it will reach the Supreme Court. IF the Supreme Court declares it unlawful, the USD MAY drop like a lead balloon.
The risk assets in these charts are all at right around the weekly 20 SMA.
www.tradingview.com
Just some food for thought. Let me know what your thoughts are.

SEI | Full AnalysisHere is the top-down analysis for Sei as requested 🫡
Weekly Timeframe:
We have a potential large structure forming on the weekly chart that will be activated once we break the ATH. Its target zone lies between $1.8 and $2.2.
My sell targets for SEI this cycle are:
TP1: $0.73
TP2: $1.14
TP3: $1.83
These are my sell targets based on my technical analysis. However, I won’t rely on them alone — I also follow several on-chain indicators. Once retail euphoria kicks in and my indicators trigger, I’ll start selling accordingly.
Daily chart:
On the daily, we have a sequence that has already been activated and almost reached its target zone. That’s why the B–C correction level remains a valid buy zone, which I’ll also use for additional long entries.
This would be the second attempt from a B–C correction level, as we’ve already tapped it once (where I went long) and I’ll be entering again here.
Target zone for this sequence: $0.39–$0.44
Local Price action:
On the lower timeframe, we’ve just completed a bearish structure that perfectly overlaps with the B–C correction level. This increases the probability of this setup significantly, as both sides (bulls and bears) want the same thing here: bulls are buying the market, while bears are covering shorts and taking profits.
-----
Thats the my full Analysis for SEI, hope it was helpful if you want me to do another analysis for any other pair just comment down below.
Also, if anyone is interested in how my trading system works, let me know and I’ll post some educational content about it.
Thanks for reading❤️

CARRY TRADE RISK IT IS SHOWING CRACKSThe chart posted in my work on TSXV:USS yen I have NOT CHANGED THE WAVE STRUCTURE AT ALL take notice of my statement CRASH COMING

DOLLAR INDEXDepartments Responsible for Each Economic Report
Indicator Responsible Department/Source
Average Hourly Earnings m/m U.S. Bureau of Labor Statistics (BLS), part of the Department of Labor
Non-Farm Employment Change BLS (Establishment Survey)
Unemployment Rate BLS (Household Survey)
Final Manufacturing PMI S&P Global/Markit (private company)
ISM Manufacturing PMI Institute for Supply Management (ISM, private sector)
ISM Manufacturing Prices Institute for Supply Management (ISM)
Revised University of Michigan (UoM) Consumer Sentiment University of Michigan (private/public university)
Construction Spending m/m U.S. Census Bureau, Department of Commerce
Revised UoM Inflation Expectations University of Michigan
How the Federal Reserve Interprets “Greater Than” or “Lower Than” Forecast
1. Average Hourly Earnings,
2.Non-Farm Payrolls,
3. Unemployment Rate
Higher than forecast (stronger labor market):
Tight labor markets (higher wages, more jobs, lower unemployment) suggest inflationary pressure.
The Fed may view this as a signal to keep rates higher for longer, as wage and job growth could fuel inflation.
Lower than forecast (weaker labor market):
Signals cooling in employment and wage growth, reducing upward pressure on inflation.
The Fed may see this as justification to consider easing policy or at least pausing further rate hikes.
2. Manufacturing PMIs (ISM, S&P)
Above 50: Signals expansion in manufacturing; below 50 indicates contraction.
Higher than forecast: Points to stronger economic momentum; the Fed may see upside risks to inflation.
Lower than forecast: Indicates weaker manufacturing activity; a possible sign of slowing demand, which could support rate cuts or dovish policy if persistent.
3. ISM Manufacturing Prices
Higher than forecast: Suggests inflationary pressures in manufacturing input costs; Fed interprets this as a reason for vigilance on inflation.
Lower than forecast: Implies easing input price pressures, supporting a dovish outlook if inflation remains subdued.
4. University of Michigan Consumer Sentiment & Inflation Expectations
Stronger than forecast sentiment: Consumers are more optimistic, often a sign of solid spending potential. May amplify inflation if this leads to greater demand.
Higher inflation expectations: If consumers expect higher future inflation, this can become self-fulfilling and the Fed may maintain tighter policy.
Weaker sentiment/lower inflation expectations: Reduces inflation risk, gives the Fed more flexibility to ease if needed.
5. Construction Spending
Higher than forecast: Indicates resilient investment and demand in the real economy.
Lower than forecast: Suggests cooling real estate and infrastructure spending; may support a dovish Fed outlook if sustained.
Summary Table
Data Surprises Interpretation for Fed Policy
Higher-than-forecast More hawkish; raises risk of persistent inflation
Lower-than-forecast More dovish; reduces pressure to hold rates higher
The Fed looks at the overall pattern across these data. Persistent upside surprises heighten concerns about inflation, supporting tighter policy. Downside surprises suggest cooling economic momentum and may encourage future rate cuts or pauses. The relative impact depends on which indicators surprise and the broader economic context.
#DXY #DOLLAR

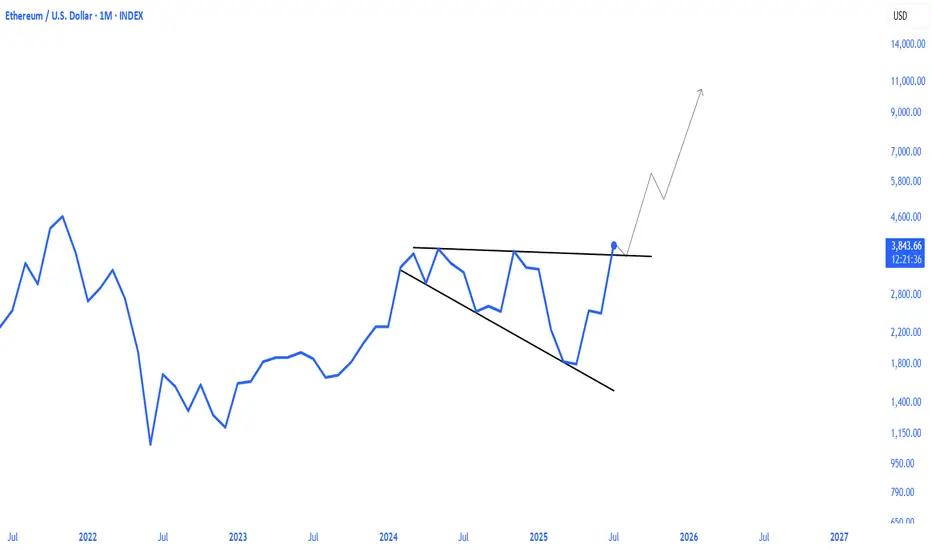
ethereum breakout bullish megaphone pattern ETHEREUM broke the bulish megaphone pattern in the 1M timeframe. it will continue to rise after the retest phase that will occur with the monthly closing today.
SPY: I think dollar milkshake is brewing, buying for long term📉 SPY Daily Breakdown – Aug 1, 2025 | VolanX Observations
🧠 Bot failed today, but the market taught more than any trade could have. Sitting out gave me the clarity to reassess structure and edge.
🔍 Market Structure Update:
Gap Down from Premium Zone: Today’s price action rejected the weak high and created a clean daily gap — signaling potential distribution at the top.
ORB (15-min) marked and ready: Likely to be retested on Monday. If price rallies into this zone and rejects, that’s where I’ll look for short entries.
Friday Bearish Close Rule: Statistically, when Friday closes red with strong momentum, Monday tends to follow — especially after a gap-down open.
🧭 Big Picture Outlook:
Liquidity Zones Below:
600 → First institutional reaction zone.
580 → Deeper demand and equilibrium area from previous consolidation.
Dollar Milkshake Brewing: Strong USD thesis could pressure equities short-term. This aligns with potential flow into defensives and out of high beta.
Long-Term Bias: Watching for deep discounts. If price moves into high-value demand zones, I’ll accumulate for the long haul — buying fear when it's priced in.
📌 What I’m Watching Next Week:
Monday open – will we see Gap & Go or a Gap Fill + Fade?
Reaction to ORB zone.
Volatility behavior and volume footprint in the first 90 minutes.
🔻 No trades today due to a bot error, but ironically, that gave me better vision. Sometimes, the best trades are the ones you don’t take.
VolanX Protocol engaged. Standing by.

$PNUT TO 2.5$ THIS RALLY?🚨 $PNUT breakout from falling wedge confirmed ❗
Target at $0.34 is done for a 70% move off the breakout✅
Now retesting the breakout zone: $0.21–$0.23
Breakout remains intact. Consolidation expected before the next explosive leg. 📈
Local breakout above $0.33 → reopens pathway to:
→ $0.50 → $0.68 → $1.00 → $1.33 → $2.00 → $2.50

USDCHF TRADE IDEA We also had a pullback to our Fibonacci level from usdchf and we're going to the downside. Let's see how the market does it's thing

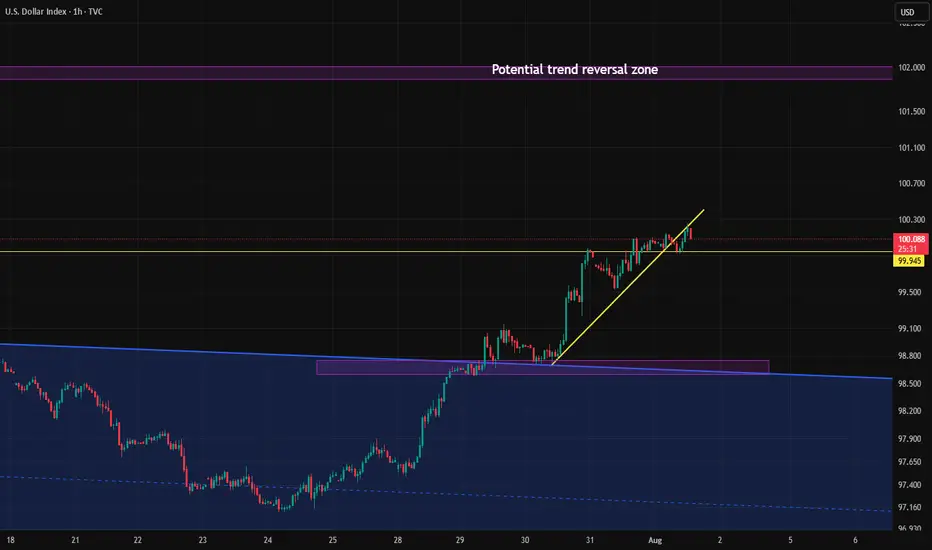
Candle close above 100 after 2 months.If the Dollar Index manages to close above the 100 level today, following the important news release, there's a chance the upward move could continue toward the key 101 zone next week.
However, unless it breaks above the 101 level with strong momentum, the overall trend in the higher timeframes still remains bearish.
The Low Is In: Why the S&P 500 Just Confirmed a Bullish Reversal🔥 The Low Is In: Why the S&P 500 Just Confirmed a Major Bullish Reversal 🔥
The market just gave us a gift.
After weeks of drifting lower and sentiment turning cautious, the S&P 500 has touched — and bounced — off a critical rising trendline for the third time since May 2025. That third touch isn't just a technical coincidence… it's often the launchpad for a new impulsive leg higher.
📈 The Power of the 3rd Touch: Trendline Validation Complete
Look at the chart. This isn’t guesswork. Since May, the S&P 500 has been respecting a well-defined ascending trendline, one that connects multiple higher lows during this bull run.
The first touch was the May liftoff after the April consolidation.
The second came in June — a clean retest and bounce.
Now, as of early August, the third touch has held once again, exactly where the bulls needed it most.
This isn’t a random line on a chart. This is institutional flow stepping in to defend structure.
And when a rising trendline holds for a third time after a strong uptrend? That’s a classic continuation signal.
📉 RSI Washout + Structural Support = Perfect Storm for a Bottom
The RSI printed a dramatic dip to ~32, a level that screams “oversold” on the 4-hour timeframe. But notice the context — it happened right at structural support.
This is not weakness. This is accumulation.
Big players shake out weak hands on low timeframes… right before they send it.
🧠 Sentiment Is Offside… Again
Let’s not forget: this retrace came after a huge run-up since March. People expected a deeper correction. Bears started getting loud again.
That’s how bull markets trap you — by convincing you it’s over right before the next leg higher.
And with macro tailwinds (liquidity expansion, fiscal spend, tariff rollbacks), earnings season beats, and global capital rotation into U.S. equities, this setup is ripe for a violent upside squeeze.
🚀 8,700 in Sight: My End-of-Year Price Target Is Very Much in Play
Today’s close around 6,220 means the S&P 500 would need to rally ~40% to hit my target of 8,700 by year-end.
Sounds crazy? Not if you’ve seen what happens during parabolic melt-ups.
This isn’t just hope:
📊 Strong breadth under the surface
🏛️ Dovish policy pivot now expected in Q4
💸 Retail and institutional capital both re-engaging
📉 Bond yields are starting to roll over, supporting equity valuations
When bull markets enter their euphoria phase, they don’t stop at “reasonable” targets. They blast through them.
💡 The Setup Is Textbook — Now It’s About Execution
✅ Trendline defended
✅ RSI reset
✅ Sentiment shaken out
✅ Structure intact
The technicals just aligned with the macro. The low is in — and the runway to 8,700 is wide open.
Strap in. Q4 could be one for the history books.

USD/MXN Bounces Back Ahead of August 2024 LowUSD/MXN appears to be bouncing back ahead of the August 2024 low (18.4291) as it extends the advance from the July low (18.5116), with the exchange rate trading above the 50-Day SMA (18.8993) for the first time since April.
USD/MXN trades to a fresh weekly high (18.9810) following the failed attempt to push below the 18.5090 (23.6% Fibonacci retracement) to 18.6330 (50% Fibonacci retracement) zone, with a move above 19.3720 (38.2% Fibonacci retracement) bringing the June high (19.4441) on the radar.
A move/close above 19.6280 (23.6% Fibonacci extension) opens up the May high (19.7820), but lack of momentum to hold above 18.7780 (50% Fibonacci retracement) may push USD/MXN back toward the July low (18.5116).
--- Written by David Song, Senior Strategist at FOREX.com

GOLD TRADING PLAN – Triangle Squeeze, All Eyes on NFP【XAU/USD】GOLD TRADING PLAN – Triangle Squeeze, All Eyes on NFP
Gold continues to trade within a large symmetrical triangle, tightening toward the end of its range. However, current candle structure shows clear bullish momentum, indicating the potential for a strong upside breakout.
🔍 Today’s Key Focus: Non-Farm Payrolls (NFP)
Market expectations are pointing to weaker-than-expected US economic data, which could trigger strong FOMO-buying for gold if confirmed. A poor NFP report would likely weaken the USD, supporting bullish continuation.
🔑 Strategy and Key Technical Levels:
Watch for a confirmed breakout above the descending trendline to trigger Wave 3 of the bullish structure.
CP ZONE + OBS BUY ZONE triggered yesterday already yielded 160+ pips profit.
Strategy: Prefer buy-the-dip entries. SELL setups only valid on strong resistance rejection. Avoid counter-trend trades near breakout zones.
🟩 BUY ZONE:
Entry: 3276 – 3274
Stop Loss: 3270
Take Profits:
3280, 3284, 3290, 3294, 3300, 3305, 3310, 3320, 3330, 3340, 3350
🟥 SELL ZONE:
Entry: 3339 – 3341
Stop Loss: 3345
Take Profits:
3335, 3330, 3325, 3320, 3315, 3310, 3305

AAPL: Symmetrical Triangle Breakdown with S-2 in FocusAAPL has now broken below a well-defined symmetrical triangle structure, as well as the ~$208 S-1 support area I’ve highlighted.
I’m watching the $194.91 zone (S-2), which served as a key support and pivot earlier this year. If price heads into that area, I’ll be looking for confirmation and stabilization before initiating a position.
If the setup aligns, I plan to trade it via Sep/Oct put sales around the $170/$175 strikes -- targeting levels I’d be comfortable owning if assigned, and collecting premium if not.
Not stepping in early here… just tracking structure, respecting price action, and planning around risk-defined entries. We’ll see how this one plays out. Stay tuned.

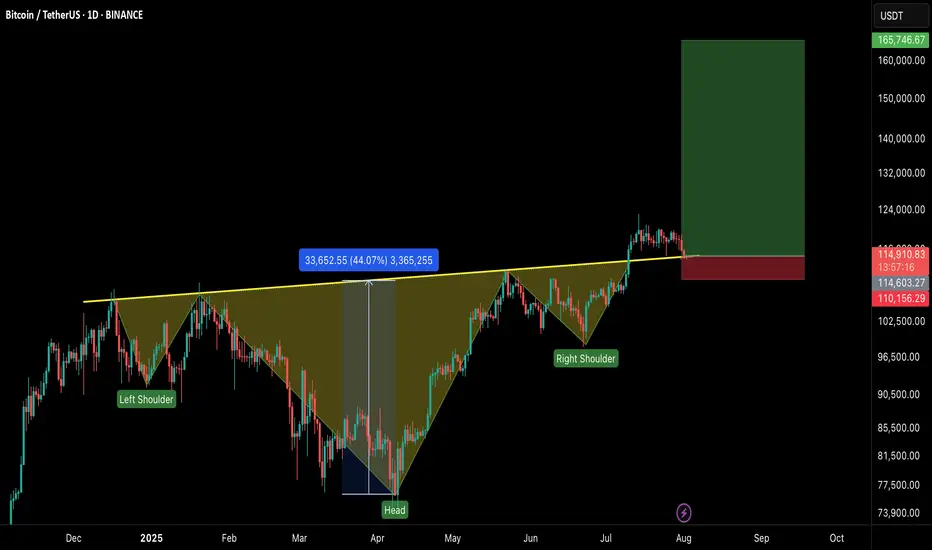
#BTCUSDT – Healthy Correction, Not the End!Bitcoin is currently experiencing a healthy pullback after an impressive run, testing the neckline of the Inverse Head & Shoulders breakout on the 1D timeframe.
🔹 Current Market View:
BTC is retesting the neckline of the IHS pattern, which now acts as a strong support zone.
Price is holding near $113K–$115K, which is crucial for maintaining bullish momentum.
This dip is a healthy correction, flushing out over-leveraged positions and preparing for the next leg up.
🔹 Key Levels:
Support Zone: $113,000 – $115,000
Immediate Resistance: $120,000 – $122,500
Breakout Target: $165,000+ on the next bullish wave
🔹 Market Sentiment:
Holding above the neckline keeps the bullish structure intact.
If the support holds, we can expect continuation to new highs once buying pressure returns.
A daily close below $112K would signal caution and delay the next rally.
💡 Tip: Don’t panic on these red candles. Healthy corrections are part of a sustainable uptrend.
Head & Shoulders on EUR/USD daily!We're currently observing a significant Head & Shoulders pattern forming on the EUR/USD daily chart, with the price just breaking below the neckline on the right shoulder.
Applying standard Head & Shoulders trading principles, we measure the distance from the head's peak to the neckline and project that same range downward from the breakdown point. Based on this, the estimated target price (TP) for the trade lands around $1.135. The stop-loss will be positioned just above the right shoulder to manage risk effectively.
We'll be watching closely to see how this setup unfolds. 🍻

USDJPY: Breaking Out With Macro Backing 🟢 USDJPY | Breakout Opportunity Above Resistance
Timeframe: 1H
Bias: Bullish
Type: Break and Retest
📊 Technical Setup
USDJPY is currently consolidating at a key 4H resistance zone (147.75–147.90). A clean breakout and retest of this area will confirm bullish continuation.
• Entry: Above 147.90 (after confirmed candle close + retest)
• SL: Below 147.30
• TP: 148.90 / 149.60
• RR: ~1:2.5
• Indicators: RSI showing strong upside momentum, holding above 50
🧠 Fundamentals + Macro Confluence
• USD Strength: Strong macro & delayed rate cuts support USD upside
• JPY Weakness: BOJ remains dovish; risk-on sentiment weighing on JPY
• COT + Conditional Score: USD score increased to 17, JPY dropped to 8
• Risk Sentiment: VIX at 14.2 = RISK ON → bearish JPY bias
🧭 Gameplan
“Wait for confirmation above resistance before entering”
🔔 Set alerts around 147.90 and monitor lower timeframes for retest and bullish candle structure.
