GBPCHF TRADE IDEA We were in on a continuation trade to the downside on GBPCHF.
Price moved back to our Fibonacci level and pulled back down south.
Trend Analysis

Pattern targetIn the previous analysis, we spotted a head and shoulders pattern and mentioned that if it gets activated, it will hit the pattern target — and that’s exactly what happened.
A clean and beautiful setup.
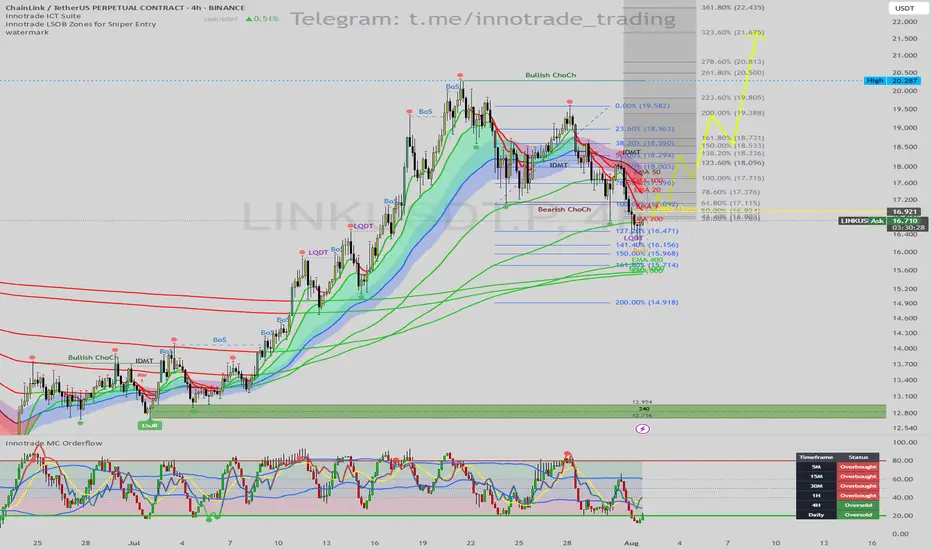
LINK/USDT: A+ Long Setup at Key Support with Daily OversoldHello traders,
I am monitoring a high-probability long setup on LINK/USDT on the 4H timeframe. The chart is presenting a classic reversal scenario where multiple technical factors are aligning perfectly, suggesting the recent corrective move may be over.
1. Trend & Context (The "Why")
After a strong uptrend, LINK experienced a necessary pullback, confirmed by a Bearish Change of Character (ChoCh). The price has now reached a critical zone where we can anticipate a bullish resumption.
Here are the key confluences for this setup:
Major Dynamic Support: The price is finding strong support directly on the EMA 200, a significant long-term moving average that often marks the end of a correction in a larger uptrend.
Price Action Signal (Liquidity Sweep): The most recent candle performed a perfect Liquidity Sweep (LQDT), wicking below the prior low to take out stop losses before quickly reclaiming the level. This is a classic institutional pattern that often precedes a strong move up.
Momentum Confirmation (MC Orderflow): The momentum oscillator provides the final, high-conviction confirmation:
The MC Orderflow is deep in the OVERSOLD territory, indicating that selling pressure is completely exhausted.
CRITICAL MTF CONFLUENCE : The Multi-Timeframe Cycle Table is showing that both the 4H and Daily timeframes are "Oversold". This HTF alignment is extremely powerful and significantly validates the strength of the reversal signal from this support level.
2. Entry, Stop Loss, and Targets (The "How")
The confluence of these signals provides a clear trade plan with an excellent risk-to-reward profile.
Entry: An entry around the current price ($16.70 - $16.90) is optimal, directly at the EMA 200 support.
Stop Loss (SL): $16.25. This places the stop loss safely below the low of the liquidity sweep wick, providing a clear invalidation point for the trade.
Take Profit (TP) Targets:
TP1: $18.20 (Targeting the cluster of short-term EMAs and the recent consolidation zone).
TP2: $19.50 (The next major swing high resistance).
TP3: $20.28 (The major high of the range, a full trend-reversal target).
Conclusion
This trade presents a textbook "A+" setup. The synergy between a key price action pattern (liquidity sweep) at a major technical level (EMA 200), combined with validated momentum exhaustion on both the 4H and Daily timeframes, creates a very high-probability environment for a significant bullish move.
Disclaimer: This is not financial advice. This analysis is for educational purposes only. Always conduct your own research and manage your risk appropriately.
New targets for Reddit RDDT In this video I recap the previous reddit analysis where we looked for the long which is playing out really well .
I also look at the current price action and simulate what I think could be a target for the stock moving forward using Fib expansion tools as well as levels below for price to draw back too.
Welcome any questions below the chart . Thanks for viewing

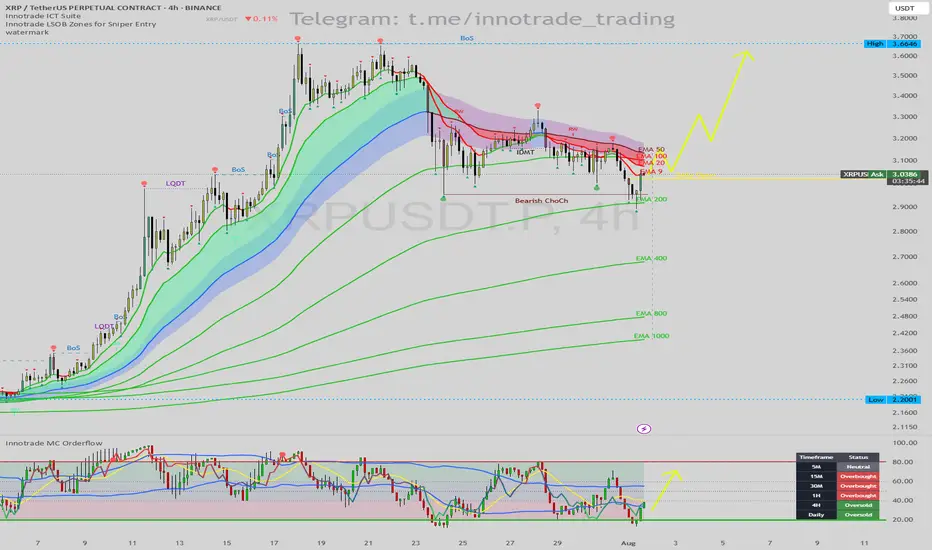
XRP/USDT: Bullish Reversal Setup at EMA 200 & Daily OversoldHello traders,
I'm seeing a compelling long setup forming on the XRP/USDT 4H chart. While the immediate trend has been bearish, multiple key indicators are now signaling that a significant bounce or reversal is highly probable.
1. Trend & Context (The "Why")
After a strong uptrend, the price has experienced a pullback, confirmed by a Bearish Change of Character (ChoCh). However, the price has now reached a critical support level where we can look for long opportunities.
Key Price Action Support: The price is currently finding support directly on the EMA 200. This is a major long-term moving average that frequently acts as a strong floor for price during a pullback.
Momentum Exhaustion Signal: The Innotrade MC Orderflow oscillator is giving a powerful confirmation for a potential bottom:
The oscillator is deep in the OVERSOLD zone (below 20), indicating that selling pressure is exhausted.
CRITICAL MTF CONFLUENCE: The Multi-Timeframe Cycle Table is the key to this trade. It shows that both the 4H and Daily timeframes are "Oversold". When higher timeframes like the Daily show exhaustion, it significantly increases the probability of a strong reversal on lower timeframes.
2. Entry, Stop Loss, and Targets (The "How")
This setup provides a clear, high-probability trade plan with a good risk-to-reward ratio.
Entry: An entry around the current price ($3.03 - $3.05) is viable as we are at the EMA 200 support. For a more conservative entry, wait for the MC Orderflow oscillator to cross back above its yellow MA.
Stop Loss (SL): $2.89. This places the stop loss safely below the recent swing low and the EMA 200. A break below this level would invalidate the bullish thesis.
Take Profit (TP) Targets:
TP1: $3.25 (Targeting the cluster of short-term EMAs and the recent swing highs).
TP2: $3.40 (The next logical area of resistance from the previous price structure).
TP3: $3.66 (The major swing high, a longer-term target if the bullish trend resumes).
Conclusion
This trade idea presents a strong case for a long position. The combination of a major technical support level (EMA 200) with a confirmed multi-timeframe momentum exhaustion signal (Daily Oversold) creates a high-probability environment for a bullish reversal.
Disclaimer: This is not financial advice. This analysis is for educational purposes only. Always conduct your own research and manage your risk appropriately.
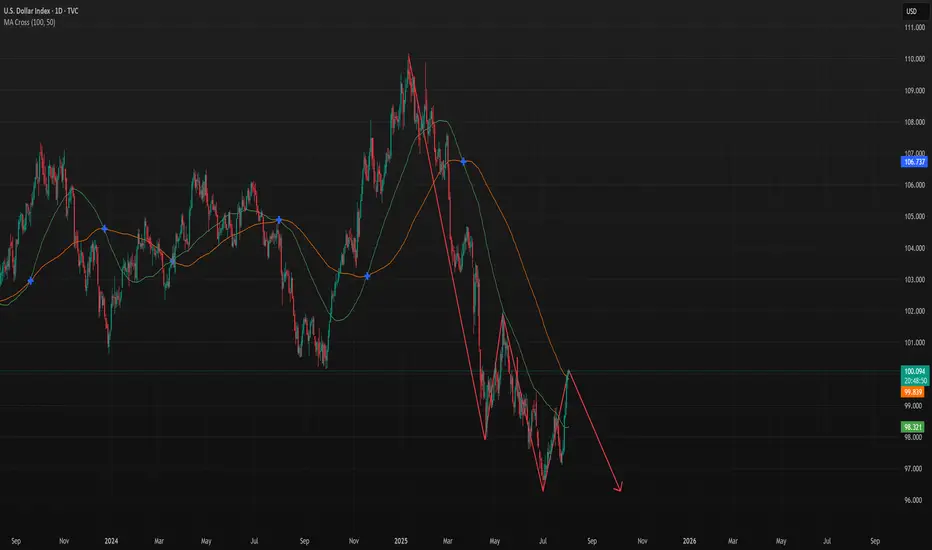
DXY - Possible Down Swing to continue furtherTVC:DXY
CMCMARKETS:USDCAD
OANDA:NZDUSD
CMCMARKETS:EURUSD
We may have a further down swing pattern forming let's continue to see if it passes the resistance area.
HTL – BUY SIGNAL (3rd strike) | 01 AUGUST 2025 HTL – BUY SIGNAL (3rd strike)) | 01 AUGUST 2025
The stock previously made a high of Rs. 63.20 and entered a pullback (marked light pink), which ended at a major support level (marked dark blue). After breaking out of this pullback, HTL began a new uptrend leg. Although it recently dipped below the light blue uptrend channel, the move appears to be a spring before an excess line (marked black), indicating potential for a strong upward reversal.

OM (SPOT)BINANCE:OMUSDT
#OM/ USDT
Entry range (0.2360- 0.2460)
SL 4H close below 0.02287
T1 0.32
_______________________________________________________
Golden Advices.
********************
* collect the coin slowly in the entry range.
* Please calculate your losses before the entry.
* Do not enter any trade you find it not suitable for you.
* No FOMO - No Rush , it is a long journey.

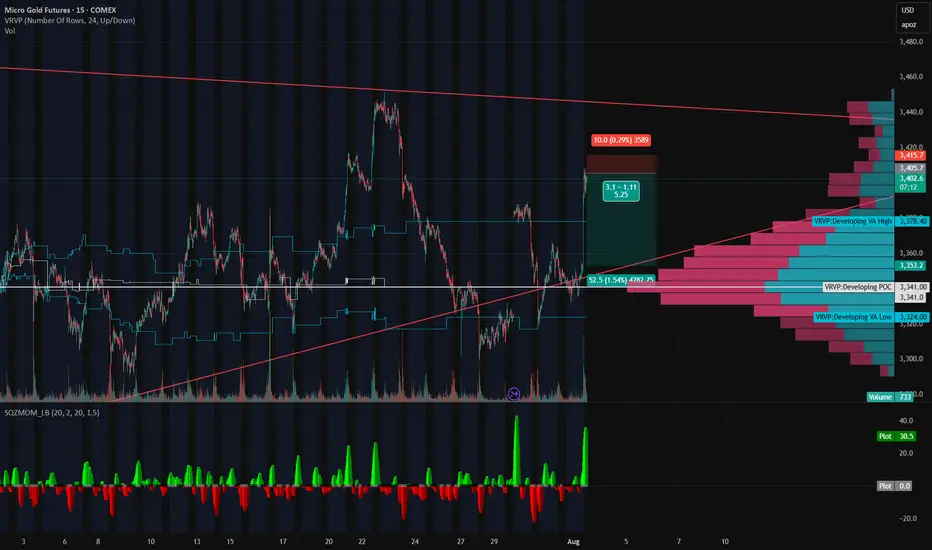
Gold’s on a Roller Coaster — and We’re Riding It Down🎢 Gold’s on a Roller Coaster — and We’re Riding It Down 🎢
Gold just snapped up like it saw Trump tweet “TARIFFS ARE BACK” — but the move smells like a knee-jerk algo pump, not real conviction. We just rejected right into a thin-volume imbalance zone and tagged the underside of a long-standing trendline.
📉 Short Setup Locked In:
💥 Entry: 3405
🛑 Stop: 3415
🎯 Target: 3353
💰 R:R ≈ 5:1
🔍 Why I'm In This Trade:
That rip? Total headline panic, not structural strength.
Low volume shelf above, with a massive POC magnet below at 3353.
We tapped the Developing VAH (3414) and got rejected — classic trap setup.
SQZMOM showing the energy is already fizzling. Green flash, no follow-through.
🧠 The Narrative:
Gold’s trying to price in volatility from every angle — Trump talk, tariffs, macro chaos — but under the hood, this pop looks unsustainable. If this is just a liquidity grab, we could see a flush back into the meat of value fast.
Grab your helmets — this roller coaster might just be heading downhill 🎢📉
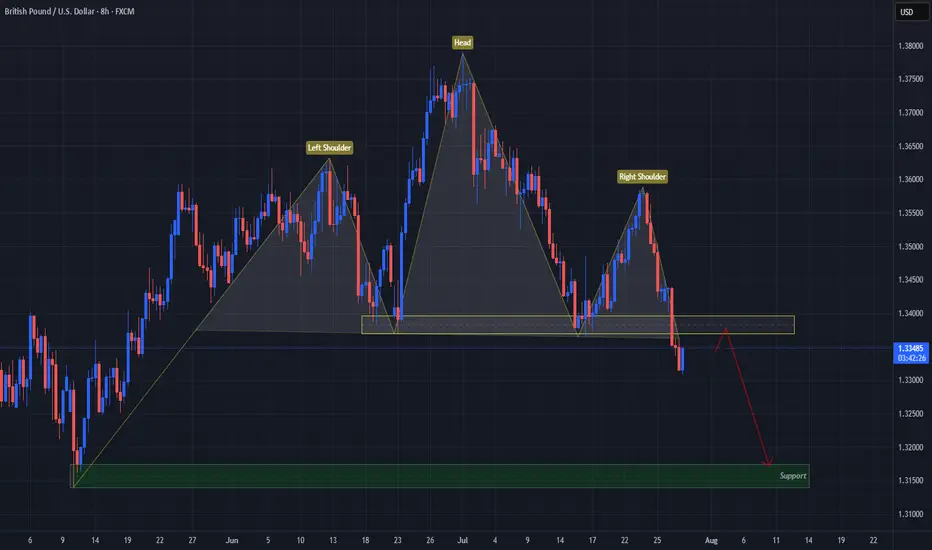
USD Turns GBP On Its "Head"FX:GBPUSD has formed a Head & Shoulders Pattern!
Price has already broken down below the "Neckline" to Confirm that Pattern.
Currently, Price is working its way back up to retest the Breakout and if the level is strong enough and holds, we could see Price follow through with its reversal to lower prices!
If the retest is successful, the May 12th Lows of 1.31741 - 1.31394 could be a good Support level to set as a Price Target.
Now we wait for a Retest!
Quantum's TSLA & NVDA Trades 8/1/25Simply breaking down what I look at going into the trading day. Premarket watchlist was short but nailed TSLA short for 150% and could have made double that on TSLA and NVDA longs. Due to hitting my daily goals I had to walk away to avoid overtrading but what an amazing day.

Buy HBARHBAR is the native cryptocurrency of the Hedera network, a high-performance, enterprise-grade public blockchain alternative that uses a unique consensus algorithm called Hashgraph.
Governed by a 39-member global Governing Council, including:Google, IBM, Boeing, Dell, Ubisoft, Deutsche Telekom. These members run nodes and vote on governance, making the network decentralized, but enterprise-friendly.
HBAR still in the box formed since January 2021 but it has potential to break-out. Actually, the first leg-up has started and curently price is consolidating before the second legup. with potential to break out the box.
Trade setup is as in chart Target is estimated based on market cap of 11B.

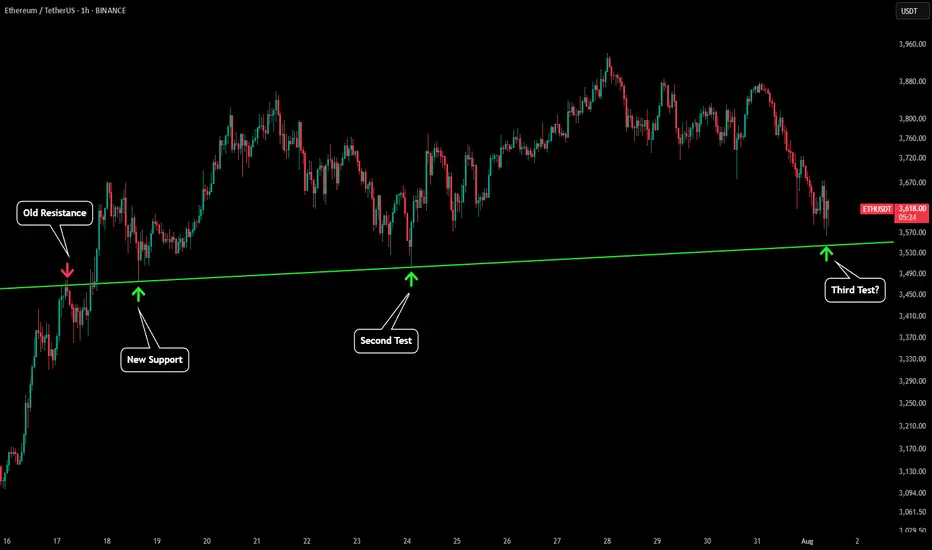
ETH - Still Respecting Important LinesPlease refer to our previous post:
Eth looks to be going for a third test of our green trendline. This would price around $3,550 which is also the 1D 21 MA. Therefore continuing to close daily candles above that price level will keep the uptrend in tact.
$BTC needs a massive diaper change....BTC is crossing key technical points, pointing clearly in an bearish trend. The trend will likely accelerate and potentially aggressively. I have been through several turns, not financial advise and always do your due diligence, but for those who are up: sell and and don't get emotional about BTC, unless there is a clean / clear support levels. Crypto bros will be eating rice and beans very soon and still be trying to FOMO crypto. This could be way worse than FTX!
Stay safe and for signal support levels use UltraAlgo to avoid wasting time trying to find support / resistance levels.....best of luck!

CIRCLE Stablecoin Revolution Circle is more than a crypto firm—it’s building infrastructure for a regulated digital dollar economy. With transparent reserves, global licenses, deep financial integrations, and robust blockchain functionality, USDC is rapidly positioning itself as a cornerstone of future finance.
I see a longer term potential for a great investment opportunity given the coming banking revolution involving stable coins.
For a lower risk entry, after a nearly 40% decrease in less than a week, the stock price is currently supported at the VWAP from the original IPO release.
Should the trend continue higher, I would prefer to see a bounce here on the stock.

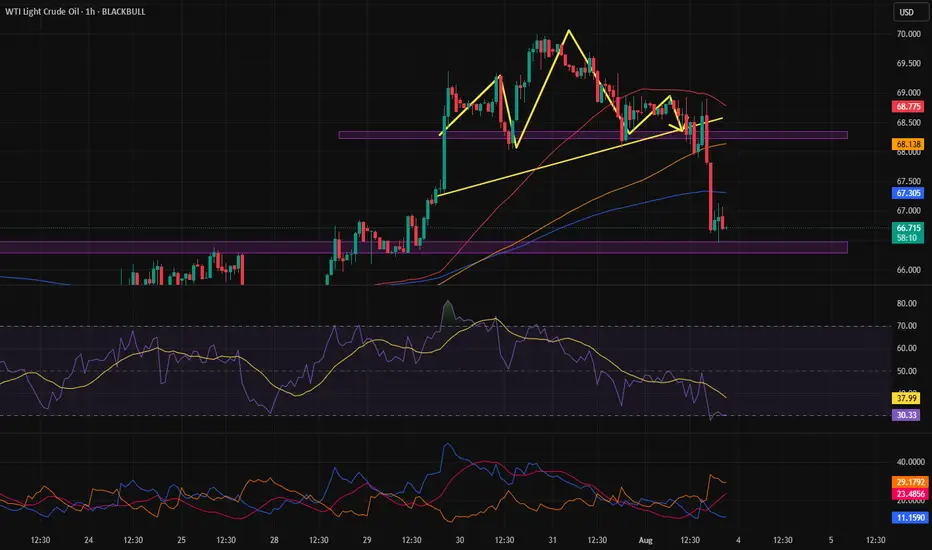
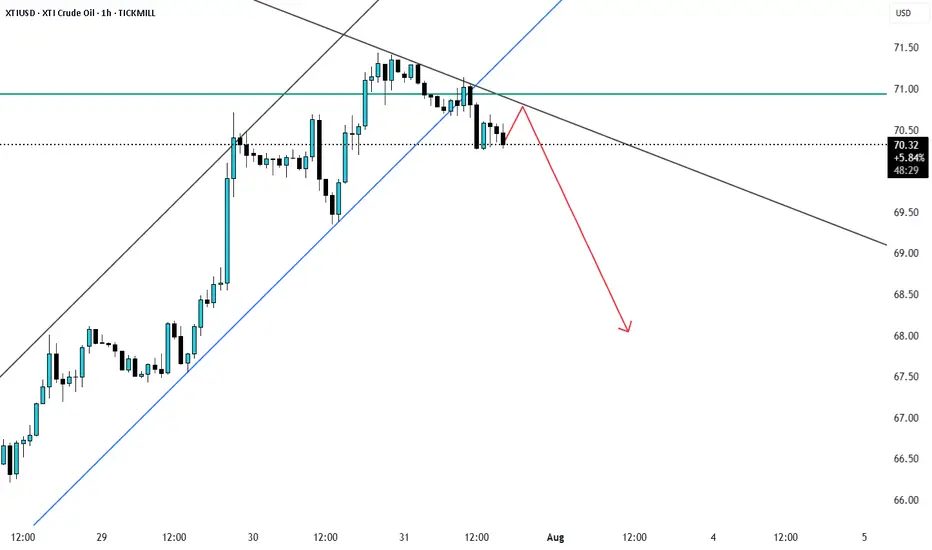
XTIUSD rejection from fib 0.5 XTIUSd recently pulled back to fib0.5 level and is currently looks to be reversering as support trendline broke and price may reject from here.
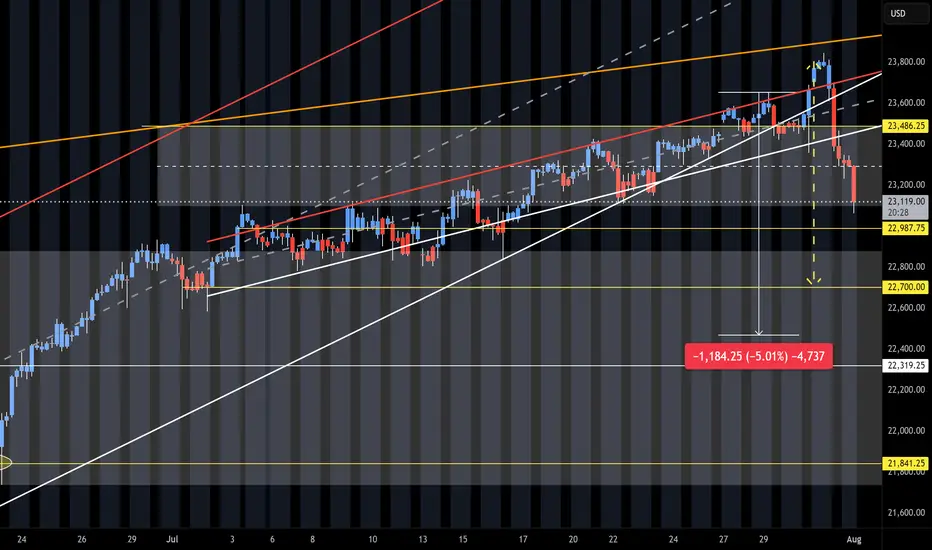
NQ Short (08-01-25)The 5% pull back is playing out. We had the heavy selling after the O/N Pump/Dump into the selling of the Reg Session and Outside Day Reversal. Up for weeks and down in hours. Next break down will have to be the failure of the long standing Friday into Monday Long Play. We did get the reg session selling and now O/N selling. Looking for the trifecta and failed F-M move. Long Trap is active. Just watch the timely Tweets and Tricks at KL's.
USOIL Is Bearish! Short!
Please, check our technical outlook for USOIL.
Time Frame: 9h
Current Trend: Bearish
Sentiment: Overbought (based on 7-period RSI)
Forecast: Bearish
The market is approaching a significant resistance area 69.178.
Due to the fact that we see a positive bearish reaction from the underlined area, I strongly believe that sellers will manage to push the price all the way down to 66.684 level.
P.S
The term oversold refers to a condition where an asset has traded lower in price and has the potential for a price bounce.
Overbought refers to market scenarios where the instrument is traded considerably higher than its fair value. Overvaluation is caused by market sentiments when there is positive news.
Disclosure: I am part of Trade Nation's Influencer program and receive a monthly fee for using their TradingView charts in my analysis.
Like and subscribe and comment my ideas if you enjoy them!

Gold you now totaly buy trend for next 3 to 5 days Gold you now totaly buy trend for next 3 to 5 days
If you want learn more fell free contrect me .

CHFJPY On The Rise! BUY!
My dear friends,
My technical analysis for CHFJPY is below:
The market is trading on 183.63 pivot level.
Bias - Bullish
Technical Indicators: Both Super Trend & Pivot HL indicate a highly probable Bullish continuation.
Target - 184.54
Recommended Stop Loss - 183.16
About Used Indicators:
A pivot point is a technical analysis indicator, or calculations, used to determine the overall trend of the market over different time frames.
Disclosure: I am part of Trade Nation's Influencer program and receive a monthly fee for using their TradingView charts in my analysis.
———————————
WISH YOU ALL LUCK

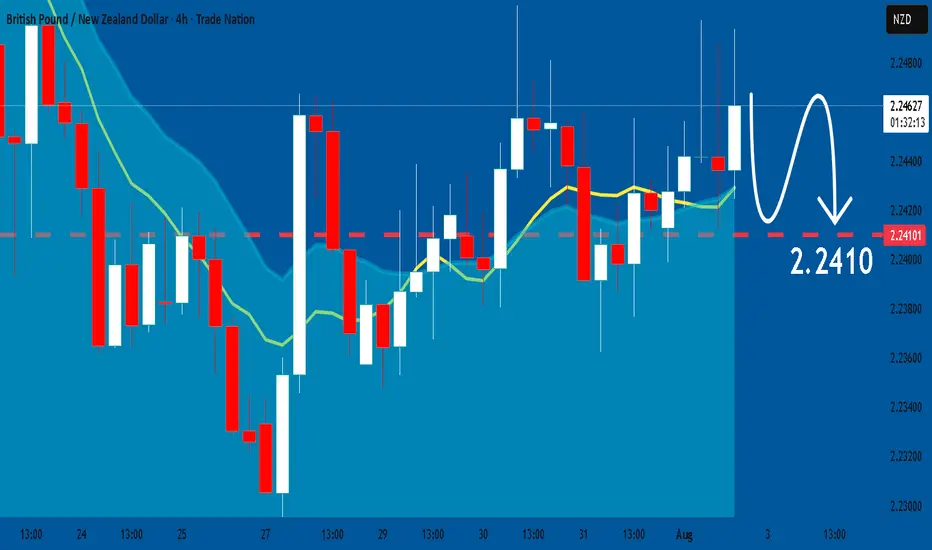
GBPNZD: Will Keep Falling! Here is Why:
The charts are full of distraction, disturbance and are a graveyard of fear and greed which shall not cloud our judgement on the current state of affairs in the GBPNZD pair price action which suggests a high likelihood of a coming move down.
Disclosure: I am part of Trade Nation's Influencer program and receive a monthly fee for using their TradingView charts in my analysis.
❤️ Please, support our work with like & comment! ❤️
SP500 → Countertrend correction before growthFX:SPX500 is correcting against an upward trend. In the second half of the week, the market received fairly positive fundamentals during the reporting period.
S&P 500 futures found support after strong reports from Meta and Microsoft, which exceeded earnings expectations and forecasts thanks to AI. The rise in futures supported demand for the “Magnificent Seven” despite Powell's hawkish comments. The focus is on Apple and Amazon reports in the evening, which could strengthen the tech rally. On Friday, we are seeing a countertrend correction in which the market is testing the 6288 zone of interest.
Support levels: 6288.4, 6262.6
Resistance levels: 6342, 6371
Most likely, the market will form a false breakout of support during the correction. If the bulls keep the index above the key level, we can expect continued growth in the short and medium term.
Best regards, R. Linda!

Ethereum (ETH): Might Be Good Zone to Bounce From ETC caught our attention with a local retest of the support zone, which, after a breakout, was a natural movement for the coin!
Now that we have been having that retest, we are looking closely for any signs of recovery, which would give us an opportunity to long from here.
While we see a smaller recovery happening, we need that proper MBS to take place above the support zone, so keep your eyes on it.
As long as we are above the EMAs, this is the game plan we are going to look for!
Swallow Academy
