$BTC Is Bullish: Bull Flag + Liquidity sweep + RSI DivI see higher targets for bitcoin. right now Bitcoin is forming a bullish flag, two times it has targeted short stops, and on the 4H timeframe we also have an RSI divergence.
Trend Analysis

EURUSD - correction ahead of timeWell, well - EUR used the NFP data to start the correction ahead of time. It used the FR 161.8 of the recent correction as support. And it did it in a impressive time...
Now we are heading into Resistance cluster created by the April High and July Low (as wee and FR 38.8 of the whole movement form the July High. Yet the upper level of the cluster is created by the FR 61.8 of the recent impulse, and 1:1 with the recent correction and June High. The second one seems to me as stronger and more probably. However, price may be in hurry again and complete the correction ahead of time... Again.
Just my humble opinion...

01.08.25 Morning ForecastPairs on Watch -
FX:EURJPY
FX:EURGBP
A short overview of the instruments I am looking at for today, multi-timeframe analysis down to what I will be looking at for an entry. Enjoy!

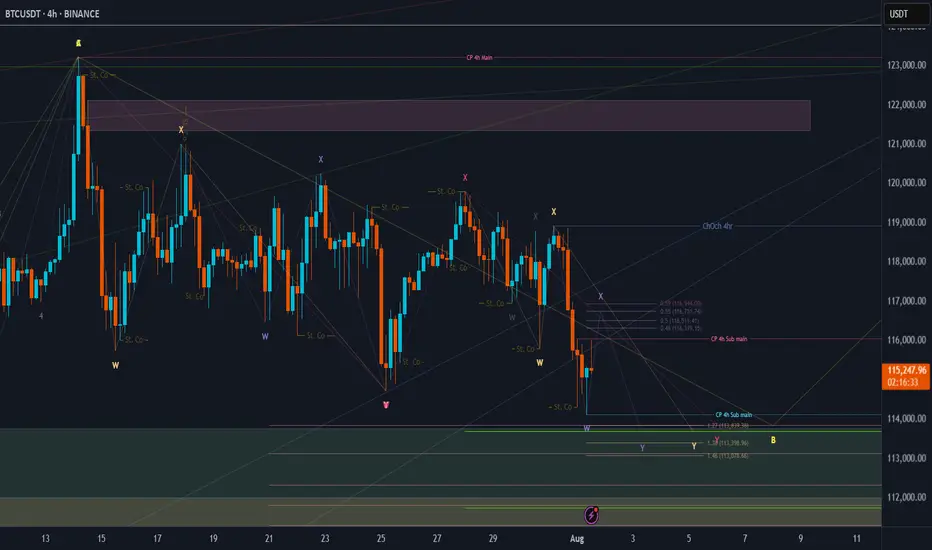
BTC Price Prediction and Elliott Wave AnalysisHello friends,
>> Thank you for joining me in my analysis. We have finished the pink X wave directly, then we have gone to the final pink Y wave, which consists of wxy in orange counting. Now we are moving into the final Orange Y wave.
>> our confirmations:
* 4Hr TF: Breaking 118990 for the next hours, we will end the whole Yellow B "correction" wave successfully. .
Keep liking and supporting me to continue. See you soon!
Thanks, Bros
Lingrid | TONUSDT Potential Long From the KEY ZoneThe price perfectly fulfilled my last idea . OKX:TONUSDT is pulling back from a fake breakout above 3.590 but holding within the boundaries of an upward channel. The price is approaching strong confluence support near 3.250, where both the trendline and horizontal zone align. A rebound from this level could launch a new bullish leg toward the resistance zone. Buyers will look for confirmation at the bounce area to aim for 3.590 and beyond.
📌 Key Levels
Buy zone: 3.250 – 3.300
Sell trigger: Break below 3.250
Target: 3.590 – 3.700
Buy trigger: Bullish engulfing or breakout from local consolidation near 3.300
💡 Risks
Loss of support at 3.250 trendline
Bearish pressure from broader market sentiment
Another fakeout or choppy move around 3.300–3.400 zone
If this idea resonates with you or you have your own opinion, traders, hit the comments. I’m excited to read your thoughts!

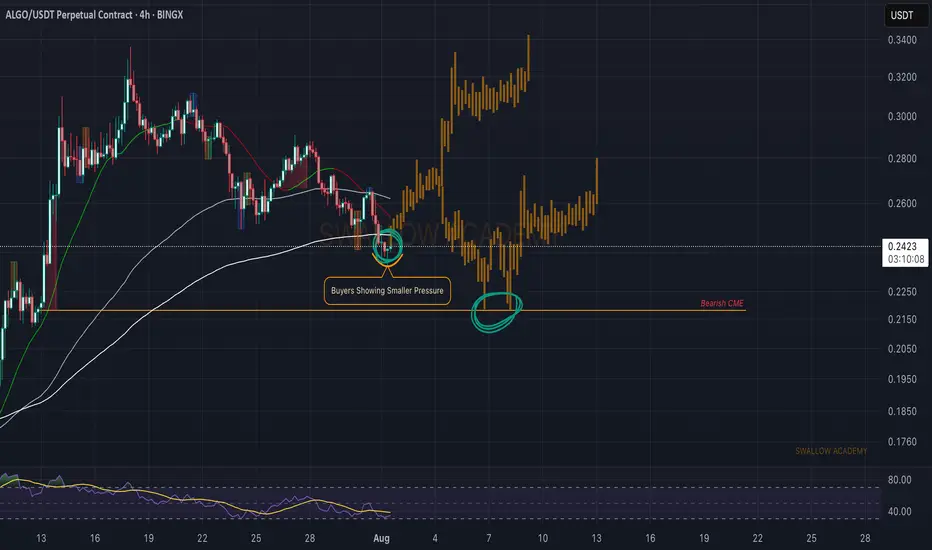
Algorand (ALGO): Seeing Signs of RecoveryAlgorand has made a market structure break (MSB) on smaller timeframes, which is indicating a potential trend switch here.
Now in the current timeframe we are looking for a break of that 200 EMA, as once we see the buyers take full control over it, we will look for buyside movement so eyes on it!
If for any reason we see further movement to lower zones, and we break local low on small timeframes, we are going to aim for that bearish CME, but for now, we are bullish.
Swallow Academy
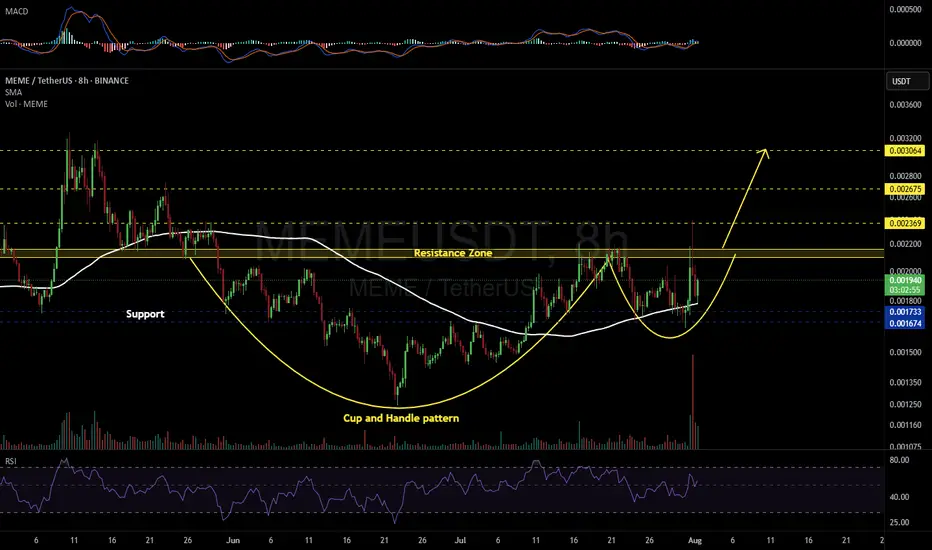
MEMEUSDT 8H#MEME has formed a Cup and Handle pattern on the 8H timeframe. It has bounced nicely off the SMA100, and volume is showing signs of strong accumulation.
📌 Consider entering this coin only after a solid breakout above the resistance zone.
If the breakout occurs, the potential targets are:
🎯 $0.002369
🎯 $0.002675
🎯 $0.003064
⚠️ As always, use a tight stop-loss and apply proper risk management.
[SeoVereign] BITCOIN BULLISH Outlook – August 1, 2025We are the SeoVereign Trading Team.
With sharp insight and precise analysis, we regularly share trading ideas on Bitcoin and other major assets—always guided by structure, sentiment, and momentum.
🔔 Follow us to never miss a market update.
🚀 Boosts provide strong motivation and drive to the SeoVereign team.
--------------------------------------------------------------------------------------------------------
Hello.
This is SeoVereign.
My fundamental view on Bitcoin, as mentioned in the previous idea, is that I am anticipating an overall downward trend. In the mid- to long-term, I believe the downward pressure will gradually increase, and this is partially confirmed by various indicators and the overall market sentiment.
However, before we fully enter this downward phase, I have been judging that one more upward wave is likely to remain. I have focused my strategy on capturing this upward segment, and I have recently reached a point where I can specifically predict the development of that particular wave.
If this upward move unfolds successfully, I plan to set my take-profit range conservatively. The reason is simple: I still believe there is a high possibility that the market will shift back into a downtrend afterward. The core of this strategy is to minimize risk while realizing profits as efficiently as possible toward the tail end of the wave.
The relevant pattern and structure have been marked in detail on the chart, so please refer to it for a clearer understanding.
In summary, I view this rise as a limited rebound that could represent the last opportunity before a downturn, and I believe this idea marks the beginning of that move.
I will continue to monitor the movement and update this idea with additional evidence. Thank you.

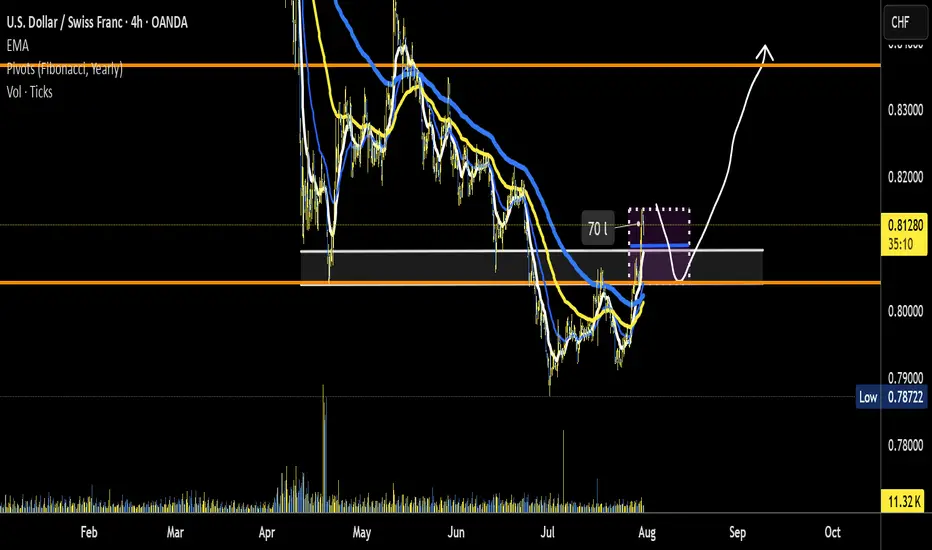
USD/CHF potential trend reversalNothing concrete yet. is the down trend over? Road Map idea correct? look for price action to confirm potential setup.
* if trend reversal is in then a major leg up for a stronger US$
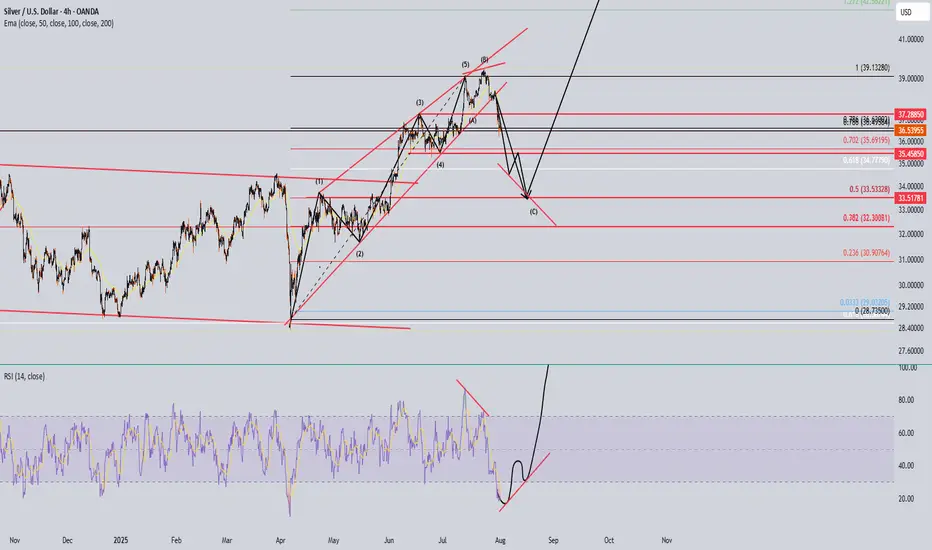
Wait SIlverLook at the RSI to form something like this in combine with the last 2 waves down. Then hopefully that power move to the 600?? Macro on the monthly its forming a cup and handle. If plays out silver will be super pricy
SPX to 6600+ by Aug 5This leg up in SPX is not over yet. Target at upper bound of the channel around 6.6K+ by Aug 5.

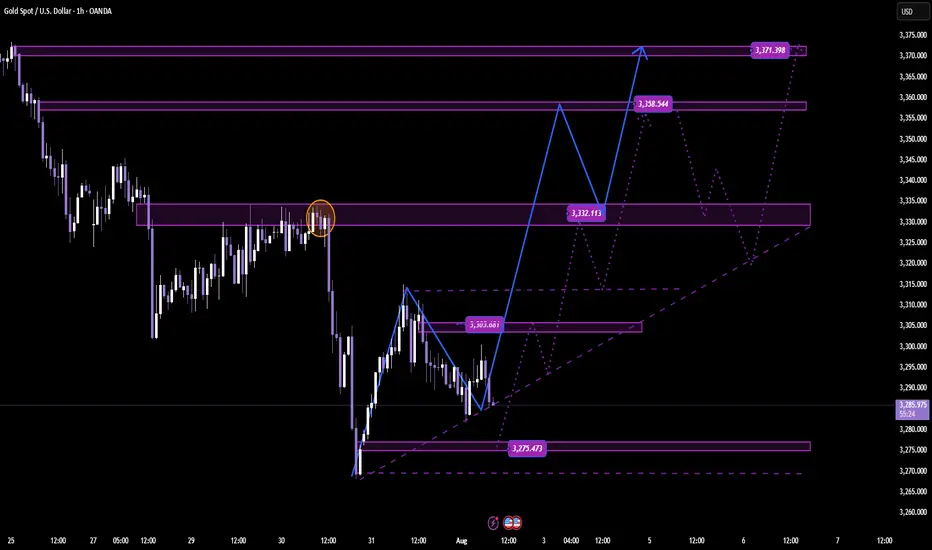
DAILY SCALPING PLAN | CLINTON SMC STYLE✅ XAU/USD - DAILY SCALPING PLAN | CLINTON SMC STYLE
📆 Date: August 1st, 2025
📍 Strategy: Smart Money Concepts (SMC)
🔑 Focus: Liquidity Sweep | Order Block | BOS | Premium/Discount Model
🔍 Market Overview
Gold (XAU/USD) is currently in a manipulation phase after a strong move down from a premium supply zone. The market has swept key liquidity and is preparing for a high-probability move in both directions based on Smart Money footprints.
Current structure suggests:
Bullish intent forming from a discount demand zone.
Liquidity resting above recent highs – perfect for short-term scalps and intraday swings.
🟢 BUY SETUP – DISCOUNT DEMAND REACTION
🎯 Entry: 3275
🛡️ Stop Loss: 3268
🎯 Take Profits:
TP1: 3285
TP2: 3295
TP3: 3305
TP4: 3315
TP5: 3325
TP6: 3335
Reasoning:
This is a clean bullish OB resting beneath a CHoCH and BOS zone. Price may wick into this area as Smart Money reloads after sweeping early long positions. If held, expect sharp upside expansion toward previous liquidity highs.
🔴 SELL SETUP – PREMIUM SUPPLY REJECTION
🎯 Entry: 3356
🛡️ Stop Loss: 3362
🎯 Take Profits:
TP1: 3350
TP2: 3345
TP3: 3340
TP4: 3330
TP5: 3320
Reasoning:
This level is a key supply block where price previously distributed. If price expands into this zone, it’s likely to act as a liquidity magnet for Smart Money to offload longs and enter short-term shorts. Expect reaction.
🧠 SMC Insights
Internal BOS & CHoCH signal early signs of accumulation.
Price respects the premium vs. discount framework with clear liquidity targets.
SMC traders understand that price doesn’t move randomly – it targets liquidity, mitigates OBs, and respects structure.
🔔 Note:
Always wait for clear confirmation (rejection wick, engulfing pattern, or M15 structure shift) before execution. Entries without confirmation are riskier in current volatility.
📌 Follow @ClintonScalper for daily SMC scalping plans & deep institutional insight.
🔁 Like, comment & share if you find this helpful!
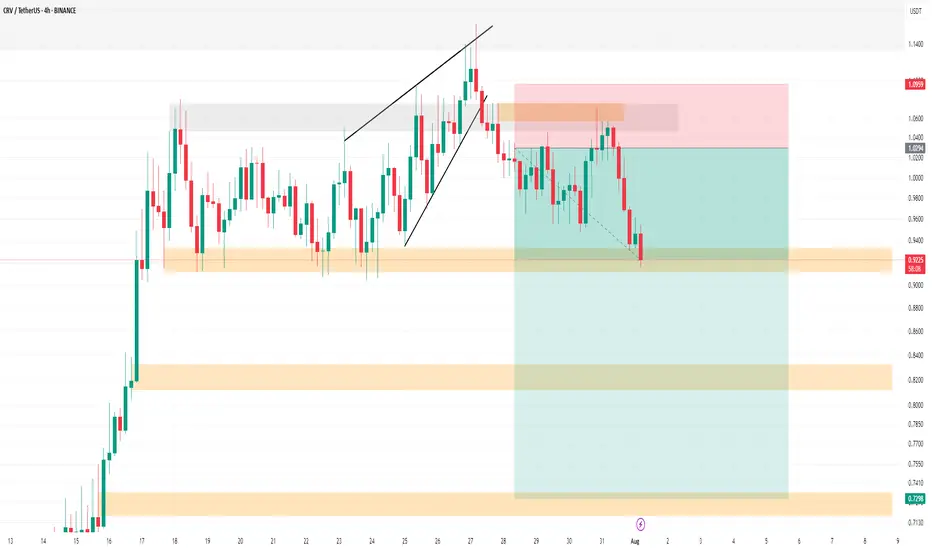
CRV SHORT Update Hello.
CRV Update
💁♂️ TP1 🔥
You can see this analysis in the analyses I posted before. It has now reached its first target. Please don't forget to like, share, and boost so that I can analyze it for you with more enthusiasm. Thank you. 💖😍
✅ TP1: 0.93$ Accessible (done)🔥
TP2: 0.82$ Possible
TP3: 0.73$ Possible
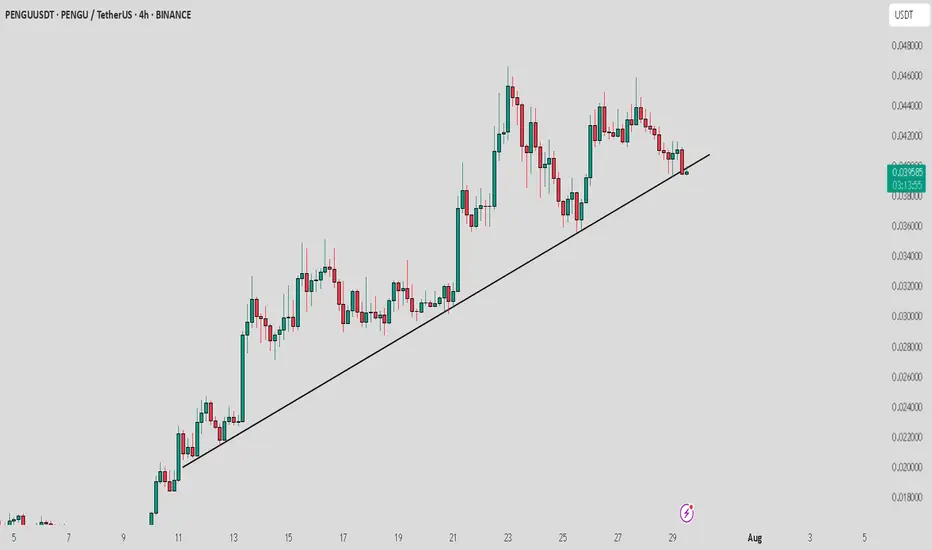
PENGU / USDT : Breaking down from Trendline supportPENGU/USDT is breaking down from the trend line support, but the retest is still in progress. Watch for rejection at key levels.
Pro Tip: Wait for confirmation of rejection before entering the trade and always apply proper risk management to safeguard your position.
Understanding SMT Divergence In Trading1. Definition and Importance
SMT (Smart Money Technique) Divergence refers to a trading concept that involves identifying discrepancies between the price movement of correlated markets or instruments.
These discrepancies can signal potential market reversals or price manipulation. Specifically, it focuses on the divergence between price movements and indicators (like volume, momentum, or oscillators) in markets that typically move in sync.
In SMT Divergence, traders look for situations where two or more correlated instruments (like
Forex pairs, indices, or bonds) are moving in opposite directions. This "divergence" signals that
there may be a shift in market sentiment, liquidity manipulation, or an opportunity for price
correction.
The importance of SMT Divergence lies in its ability to detect hidden market dynamics that are
often manipulated by institutional players. By understanding these divergences, traders can
gain insights into potential market moves and position themselves accordingly.
2. The Relationship Between Correlated Markets
Understanding these relationships is crucial for identifying SMT Divergence:
Forex Pairs : Many Forex pairs have direct correlations. For example, EUR/USD and USD/JPY are often correlated in the sense that when the USD strengthens, both pairs may exhibit price movement in the same direction (EUR/USD decreases, USD/JPY increases). SMT
Divergence occurs when these pairs move in opposite directions, indicating that something
unusual is happening in the market (e.g., liquidity manipulation or market anticipation).
Indices : Stock market indices (like the S&P 500 or Dow Jones) and related instruments like futures or ETFs can show correlation. A divergence in these indices might indicate potential
trends or reversals, signaling that institutions are positioning themselves for a move in one
direction, and the market is showing resistance.
Bonds : The relationship between bond yields and currency pairs, for instance, can also show correlations. When bond yields move in one direction, certain currency pairs should
generally follow suit. Divergence in this relationship can reveal clues about market
intentions, such as shifts in interest rates or macroeconomic sentiment.
Commodities and Stocks : Commodities like oil and gold can often correlate with indices or specific stocks. For example, if oil prices rise and an energy sector index doesn’t move in the
same direction, this could be a sign of market inefficiencies or institutional positioning.
3. SMT Types
3.1. Bullish SMT Divergence
Bullish SMT (Smart Money Technique) Divergence occurs when one correlated asset forms a
higher low while another makes a lower low. This indicates that one market is showing hidden
strength, suggesting a potential reversal to the upside.
How to Spot Higher Lows in One Asset While the Other Makes Lower Lows:
1. Identify Two Correlated Markets – Choose two assets that typically move together, such as EUR/USD and GBP/USD or NASDAQ and S&P 500.
2. Look for Divergence – Observe when one asset makes a new lower low, while the other fails to do so, instead of forming a higher low.
3. Volume & Price Action Confirmation – Institutions may absorb liquidity in the weaker asset while the stronger one holds its ground.
4. Validate with Market Context – Look at macroeconomic conditions, liquidity pools, and institutional activity to confirm the setup.
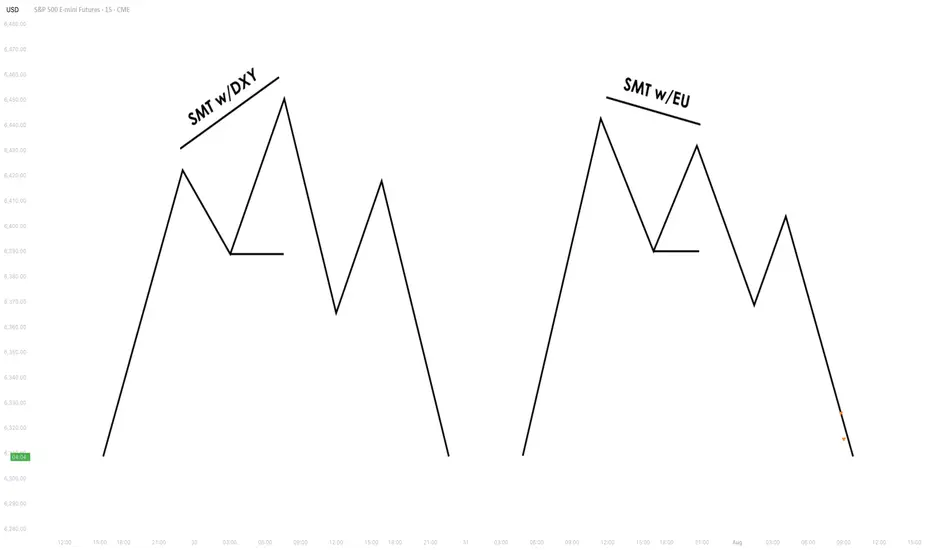
3.2. Bearish SMT Divergence
Bearish SMT Divergence occurs when one correlated asset forms a lower high while another
makes a higher high. This signals hidden weakness, indicating that the market may be setting
up for a bearish reversal.
How to Spot Lower Highs in One Asset While the Other Makes Higher Highs:
1. Find Two Correlated Markets – Common pairs include NASDAQ vs. S&P 500 or EUR/USD vs. GBP/USD.
2. Identify the Divergence – One asset makes a higher high, while the other fails to follow and forms a lower high instead.
3. Liquidity & Volume Analysis – Smart money may be using the stronger asset to attract buyers before reversing.
4. Confirm with Institutional Order Flow – Watch for liquidity grabs and imbalance zones.
3.3. Intermarket SMT
Definition : Divergence between assets from different markets, such as Forex vs. Commodities, Stocks vs. Bonds, or Indices vs. the U.S. Dollar.
Examples :
EUR/USD vs. DXY (U.S. Dollar Index) – If EUR/USD forms a higher low while DXY makes a
higher high, this suggests USD weakness and potential EUR/USD strength.
NASDAQ vs. S&P 500 – If NASDAQ makes a higher high but S&P 500 doesn’t, it can indicate
a weakening stock market rally.
Strength & Validity :
High validity because institutions hedge positions across different markets.
3.4. Intramarket SMT
Definition : Divergence within the same market (e.g., multiple Forex pairs or stock indices).
Examples :
EUR/USD vs. GBP/USD – If EUR/USD makes a lower low but GBP/USD doesn’t, it could
indicate bullish strength.
Dow Jones vs. S&P 500 vs. NASDAQ – If NASDAQ is making new highs while the Dow lags, it
may signal weakness in the broader stock market.
Strength & Validity :
Still valid but needs additional confirmation (liquidity sweeps, volume analysis).
4. SMT Divergence vs. RSI Divergence
Why SMT Is Superior to Traditional RSI Divergences
1. RSI Measures Momentum, Not Liquidity – RSI divergence is based on momentum shifts,
which institutions can easily manipulate with fake breakouts or engineered price moves.
2. SMT Focuses on Market Structure & Liquidity – SMT divergence detects institutional
positioning by comparing correlated assets, making it harder to manipulate.
3. RSI Can Remain Overbought/Oversold for Long Periods – Markets can continue trending
despite RSI divergence, while SMT divergence often provides stronger reversal signals.
How Smart Money Manipulates Classic Divergence Traders
Liquidity Sweeps – Institutions use RSI divergence to lure retail traders into premature
reversals before executing stop hunts.
False RSI Signals – In trending markets, RSI divergences often fail, while SMT divergence
provides a more contextual view of smart money positioning.
5. Using TradingView for SMT Analysis
To effectively analyze SMT divergence, traders should monitor at least two correlated assets
simultaneously.
TradingView makes this easy by allowing multiple chart layouts. Steps to Set Up Multiple Charts in TradingView:
a. Open TradingView and click on the “Select Layout” button.
b. Choose a two-chart or four-chart layout to compare correlated assets.
c. Sync timeframes across all charts for consistency.
d. Adjust scaling to ensure price action is easily comparable.
Best Pairs to Compare for SMT Analysis:
Forex : EUR/USD vs. GBP/USD, USD/JPY vs. DXY
Indices : NASDAQ vs. S&P 500, Dow Jones vs. S&P 500
Commodities & FX : Gold (XAU/USD) vs. USD/JPY
Bonds & Equities : 10-Year Treasury Yield vs. S&P 500
6. Key Takeaways
SMT divergence reveals institutional intent by showing liquidity accumulation or
distribution through correlated assets.
Bullish SMT occurs when one asset makes a lower low while the other does not, signaling a
potential reversal up.
Bearish SMT occurs when one asset makes a higher high while the other does not, signaling
a potential reversal down.
Best markets for SMT analysis include Forex pairs, indices, commodities, and bonds, where
correlations are strongest.
SMT is most effective near key liquidity levels, such as session highs/lows, order blocks, and
fair value gaps.
SMT is more reliable during high-impact news events, London & New York sessions, and
quarterly shifts, where institutional activity is highest.
SMT is superior to RSI divergence because it reflects real liquidity dynamics, whereas RSI
can produce false signals.
Combining SMT with market structure shifts like BOS and CHoCH increases trade accuracy
and reliability.
Risk management in SMT trading requires stop-loss placement beyond liquidity grabs and a
minimum 2:1 risk-reward ratio.
Mastering SMT helps traders avoid liquidity traps, improve precision, and align with smart
money moves.
SMT divergence is the footprint of smart money—where one market whispers the truth while the other follows the herd.
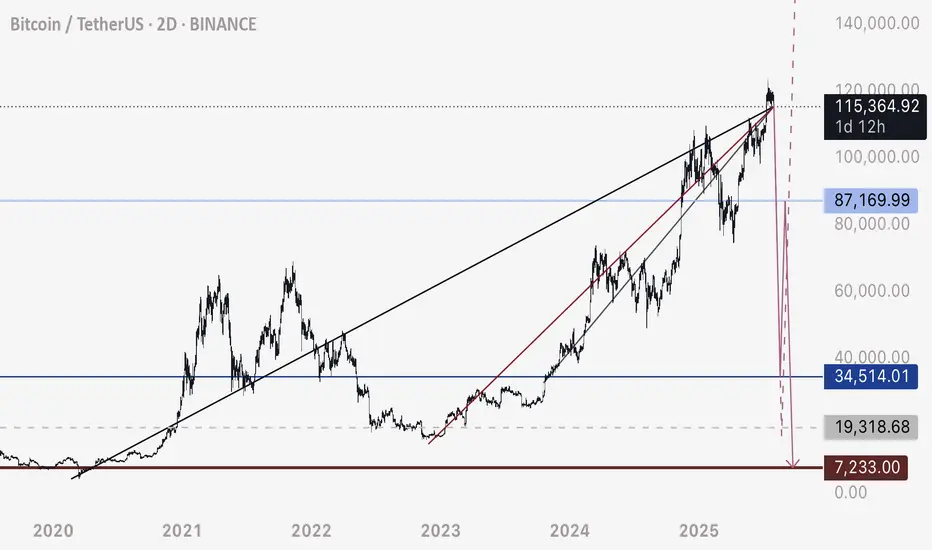
BTC - Not the End of the DropRather the beginning. Bitcoin has fallen below this bearish intersection. Anticipating price to fall rapidly on one of these two pathways to the Uber low liquidity levels.
DXY is retesting a major bearish breakdown - this is the conduit that will justify a flash crash of this magnitude prior to a 3-5 year bull run.
Happy trading.
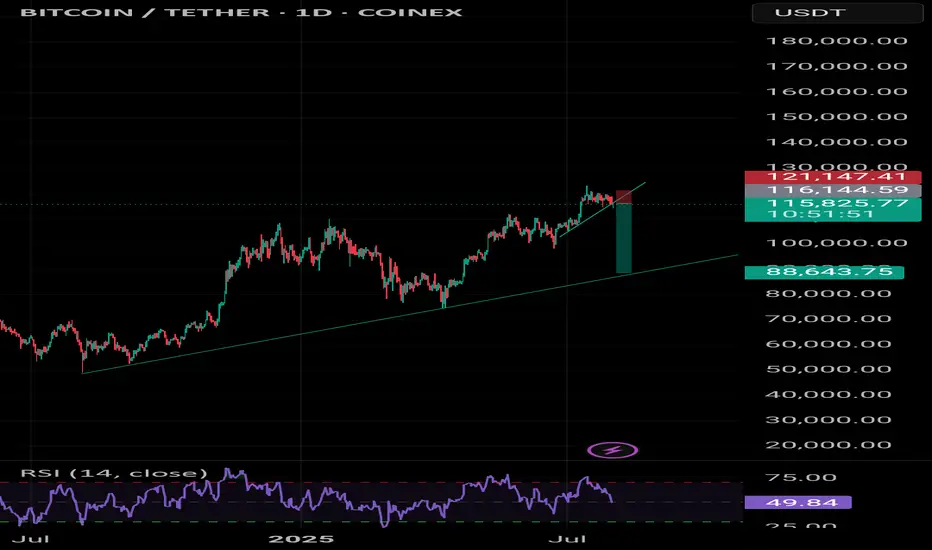
Bitcoin Go 89kBe prepared for a market correction. BIT has a negative divergence on the weekly timeframe.
USD/JPYThis is a trade setup for USD/JPY, based on volume and trend analysis.
Entry Price: 150.360
Stop-Loss (SL): 150.740
Take-Profit (TP): 149.963
The trade is intended to be executed instantly at the mentioned price, in alignment with both volume behavior and the current trend direction.
Disclaimer: This setup is shared purely for backtesting purposes and to document trade ideas. It is not financial advice. Always perform your own analysis before making any trading decisions.

Gold Slips After Powell Speech Below 3320 Bearish Pressure BuildGOLD Overview
Market Context:
Gold declined from the 3333 level, as anticipated in yesterday’s analysis, ahead of Fed Chair Powell’s speech. Powell reiterated that it is still too early for rate cuts, citing persistently high inflation, which supported the U.S. dollar and pressured gold.
Technical Outlook:
As long as gold trades below the 3320–3310 zone, the bearish momentum is expected to continue, with the next target at 3285. A confirmed break and stability below 3285 could open the way toward 3255.
To regain bullish traction, the price must stabilize above 3320.
Support Levels: 3285 • 3255
Resistance Levels: 3333 • 3349

Link targeting 30$In my view after a deeper retracement to 0.618 fibonacci level , about 16.3$, Link bullish trend will resume to target 30.4$

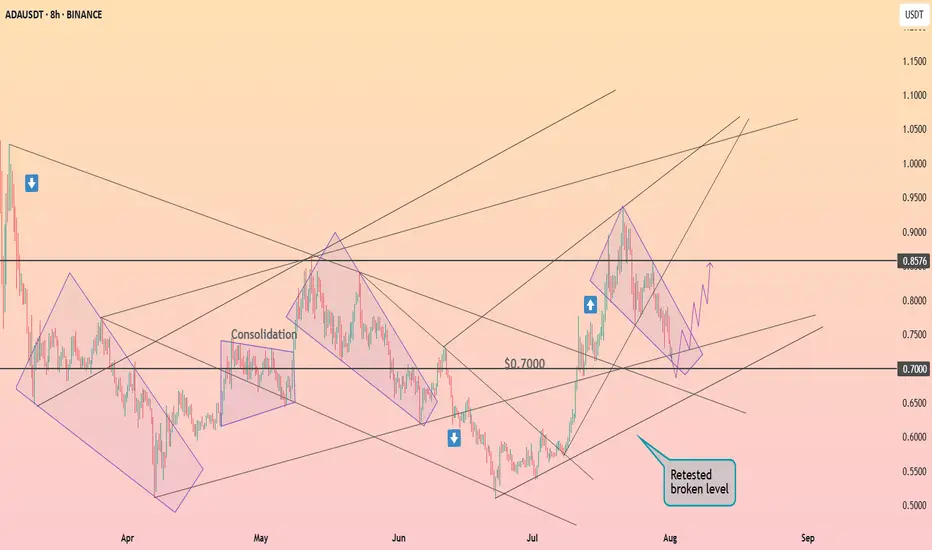
Cardano is forming the falling wedge ┆ HolderStatBINANCE:ADAUSDT is testing the $0.70 level after a clean breakout from previous consolidation. The current retracement channel indicates a controlled pullback, likely to flip into bullish continuation if $0.70 holds. Watch for a move toward $0.8576 once the pattern breaks upward.
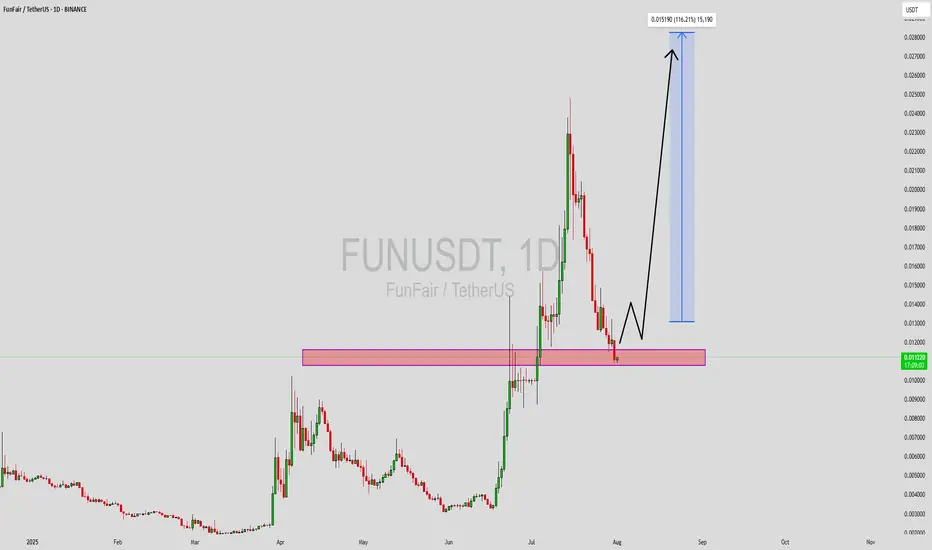
FUNUSDT Forming Bullish ReversalFUNUSDT is currently forming a bullish reversal pattern, signaling a potential shift in market momentum after a prolonged consolidation. This pattern, combined with a steady increase in trading volume, suggests growing investor interest and the possibility of an upcoming trend reversal. The structure aligns well with historical price action, where FUN has previously bounced from similar technical setups, making this an attractive chart for swing traders and medium-term investors.
The volume profile shows accumulation behavior, typically seen before major breakouts. This reflects the confidence of larger market participants entering at lower levels. If FUNUSDT confirms the breakout above resistance zones, the next leg up could lead to a potential price surge of 140% to 150% from current levels. Given its relatively low market cap and recent technical developments, the upside potential remains significant if momentum sustains.
What adds to the bullish thesis is the overall pattern integrity supported by clear trendline reactions and support zone validation. FUN has also maintained a healthy base formation, which often precedes explosive upward moves. A close above key resistance with volume confirmation would likely attract more traders and potentially push FUN into price discovery territory.
Keep this altcoin on your watchlist as it presents a high-reward setup supported by solid technical foundations and increasing trader sentiment.
✅ Show your support by hitting the like button and
✅ Leaving a comment below! (What is You opinion about this Coin)
Your feedback and engagement keep me inspired to share more insightful market analysis with you!
AUDCAD; Heikin Ashi Trade IdeaIn this video, I’ll be sharing my analysis of AUDCAD, using FXAN's proprietary algo indicators with my unique Heikin Ashi strategy. I’ll walk you through the reasoning behind my trade setup and highlight key areas where I’m anticipating potential opportunities.
I’m always happy to receive any feedback.
Like, share and comment! ❤️
Thank you for watching my videos! 🙏
