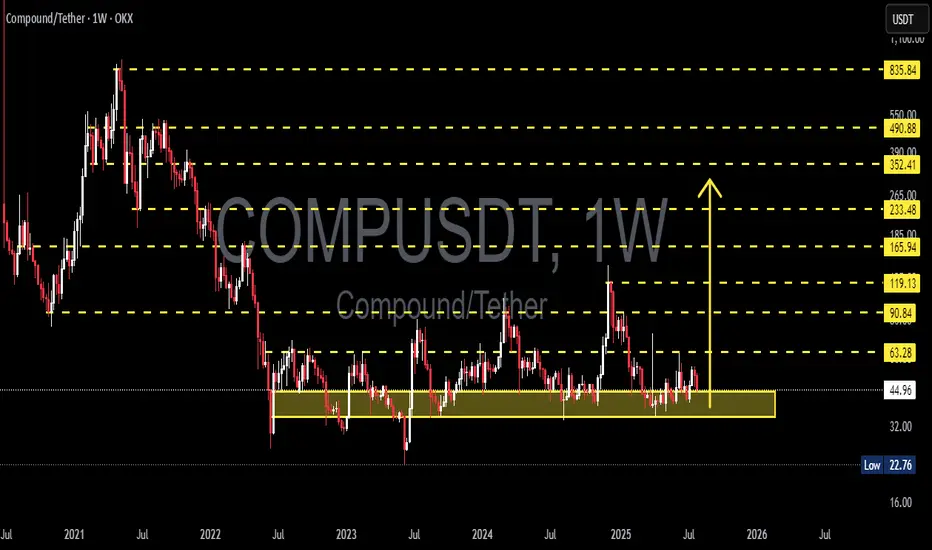
COMPUSDT in a Strong Demand Zone! Reversal Potential / Breakdown🔍 In-Depth Analysis (Timeframe: Weekly / 1W)
The COMP/USDT pair is currently hovering above a long-term demand zone that has held strong since mid-2022. Price is sitting around $44.90, just above the key support area of $32 – $45 (highlighted in yellow), which has acted as a major accumulation zone for over 2 years.
🧱 Critical Zone: Smart Money Accumulation or Exhaustion?
The $32–$45 demand zone has been tested multiple times, indicating smart money interest and hidden buying pressure.
Price action in this range forms a clear base structure or horizontal accumulation pattern, a classic setup before a large directional move.
However, the prolonged sideways consolidation hints at an imminent breakout or breakdown — momentum is building.
---
📊 Key Technical Pattern:
🟨 Rectangle Range (Accumulation Structure)
Price has been ranging between $32 and $63.28 with no clear breakout.
Strong rejections every time price dips below $35 indicate consistent buyer defense.
🔃 Mean Reversion Behavior
Repeated moves back to the mid-range reflect an indecisive market (equilibrium phase), often seen before expansion.
---
📈 Bullish Scenario (Potential Reversal):
If price breaks above major resistance at $63.28:
1. Upside Targets:
🎯 $90.84 (key resistance zone)
🎯 $119.13 (prior distribution zone)
🎯 $165.94 (macro target if sentiment turns highly bullish)
2. Confirmation needed via weekly close above $63 with strong volume.
3. A bullish breakout may form a new Higher Low and Higher High structure on both daily and weekly timeframes.
🟢 Bullish confirmation: Weekly bullish engulfing + volume breakout above $63.
---
📉 Bearish Scenario (Potential Breakdown):
If price closes below the $32 support:
1. Possible downside targets:
⚠️ $22.76 (next logical support)
🚨 $16 (last consolidation base pre-2021 rally)
2. A break below this long-term support could trigger a final capitulation flush before a potential macro reversal.
🔴 Bearish confirmation: Weekly close below $32 with increased volume and sustained selling.
---
⚖️ Strategic Takeaway:
COMP/USDT is currently at a pivotal decision zone — a crossroads between massive upside potential and deeper downside risk.
This is not just another support area, it’s a macro-level demand zone that will likely dictate trend direction in the coming months.
⏳ A major move is brewing — whether breakout or breakdown, be ready.
#COMPUSDT #CryptoOutlook #TechnicalAnalysis #AltcoinSeason #DeFi #CryptoTrading #AccumulationZone #BreakoutSetup #BearishScenario #BullishSetup #CryptoAnalysis
Trend Analysis
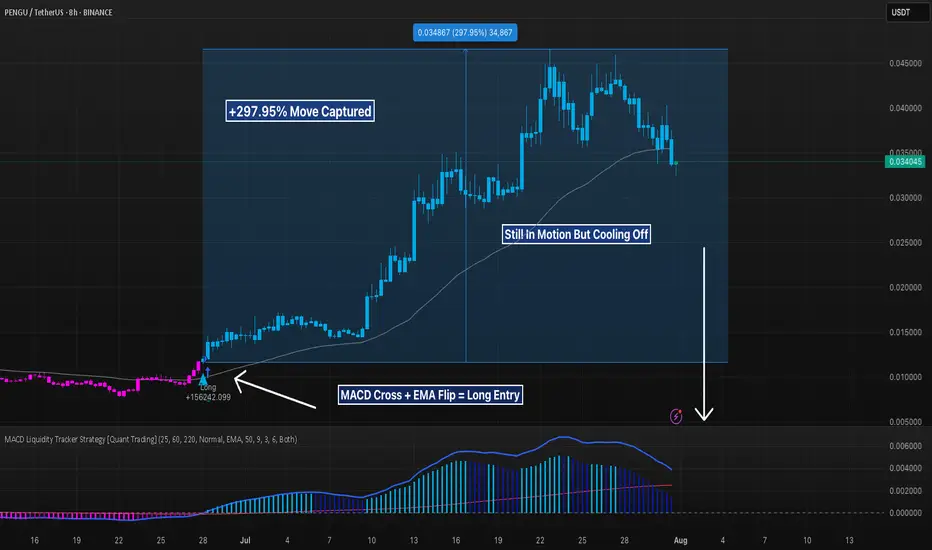
PENGU 8H – 297% MACD Strategy Long Call BreakdownPENGU’s recent move is the kind of textbook trend trade that makes systems like the MACD Liquidity Tracker shine.
The strategy stayed flat throughout the entire sideways grind in June — filtering out chop with its 60/220 EMA trend filter. It wasn’t until late June that MACD flipped bullish and price reclaimed both EMAs. That was the trigger — and from there, it was lift-off.
The system held through a clean +297.95% move from sub-$0.012 to just under $0.045. No early exits. No fakeouts. Just a single, conviction-based trade.
The exit signal hit near the top as momentum waned and MACD rolled over. Since then, price has retraced and is now hovering right above the 60 EMA — a level that's acted as dynamic support all run long.
📊 Strategy Overview:
– MACD Settings: 25 / 60 / 220
– EMA Trend Filter: 60 & 220
– Mode: Normal
– Timeframe: 8H
⚠️ If price holds above the EMA and MACD stabilizes, bulls may still have fuel. But a breakdown below ~$0.029 would shift structure back into bearish territory.
Let the chart tell the story — this was pure momentum trading in action.
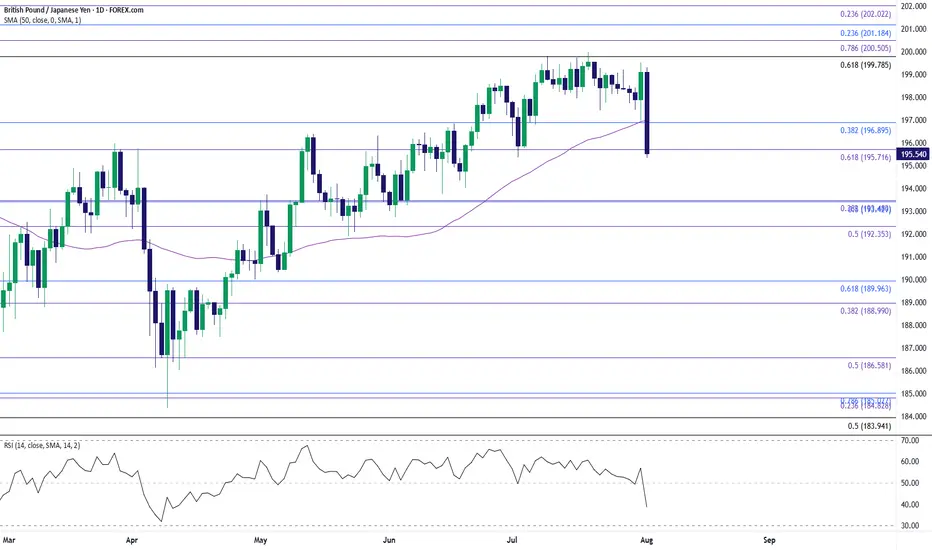
GBP/JPY Clears July LowGBP/JPY clears the July low (195.37) as it tumbles to a fresh weekly low (195.34), and a close below the 195.70 (61.8% Fibonacci extension) to 196.60 (23.6% Fibonacci extension) region may push the exchange rate toward the June low (192.73).
Failure to hold above the 192.40 (50% Fibonacci extension) to 193.50 (38.2% Fibonacci extension) zone may lead to a test of the May low (190.33), but the selloff in GBP/JPY may turn out to be temporary if it defends the rebound from the June low (192.73).
GBP/JPY may attempt to retrace the decline from the July high (199.98) should it hold/close above the 195.70 (61.8% Fibonacci extension) to 196.60 (23.6% Fibonacci extension) region, with a close above the 199.80 (61.8% Fibonacci retracement) to 200.50 (78.6% Fibonacci extension) region opening up 201.20 (23.6% Fibonacci retracement).
--- Written by David Song, Senior Strategist at FOREX.com
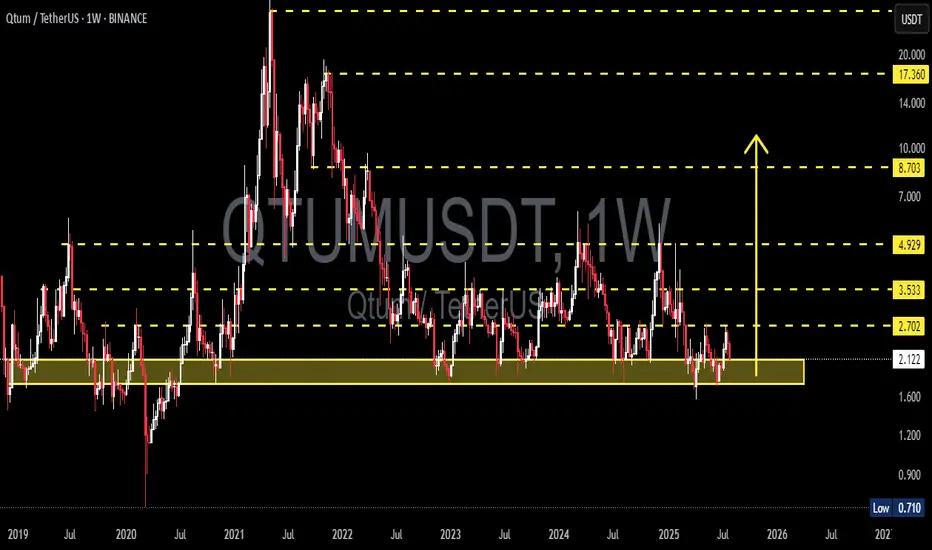
QTUM/USDT – Make or Break? Testing the Edge of Accumulation?🧠 Overview:
After going through a volatile multi-year cycle, QTUM is now back at one of the most critical historical support zones. This demand area has acted as a strong reversal point multiple times since 2020 and is once again being tested as price consolidates near the bottom of its macro range.
---
📉 Price Structure & Key Levels:
📍 Major Support Zone (1.70 – 2.10 USDT):
A proven accumulation zone based on multiple long wicks and price rejections in the past.
This is where smart money tends to accumulate during market uncertainty.
📍 Layered Resistance Levels (Bullish Targets):
2.70 USDT → Initial breakout validation
3.53 USDT → Mid-range resistance
4.93 USDT → Key structural level
8.70 USDT → Mid-term breakout target
17.36 USDT → Peak from previous macro cycle
---
🧩 Current Pattern: "Sideways Accumulation Range"
QTUM is clearly in a range-bound accumulation phase, with tight price action within a key support area. Historically, such patterns often precede large impulsive moves, especially when accompanied by volume surges and breakouts from structure.
> ⚠️ Important Note: Sideways movement at historical support, combined with increasing accumulation volume, often leads to a breakout into the markup phase.
---
📈 Bullish Scenario: Potential Upside Momentum
Trigger: A confirmed breakout and weekly candle close above 2.70 USDT.
Additional Confirmation: Strong bullish candle with increased volume.
Targets:
3.53 USDT (local resistance)
4.93 USDT (mid-range structural level)
8.70 USDT (swing target)
17.36 USDT (macro cycle high)
🎯 High reward-to-risk potential if entries are made near support with a stop-loss under 1.70 USDT.
---
📉 Bearish Scenario: Breakdown Risk
Trigger: Weekly candle closes below 1.70 USDT.
Implication: Breakdown from long-term demand zone.
Downside Targets:
1.20 USDT → Minor horizontal support
0.71 USDT → Historical all-time low
Warning Sign: High volume breakdown = likely sign of institutional selloff or panic exit.
---
📊 Strategic Summary:
> QTUM is at a pivotal crossroads.
The 1.70 – 2.10 USDT range is a decisive area.
A bullish breakout could spark a major recovery rally,
while a breakdown may lead to a deeper capitulation.
This is a “calm before the storm” situation. Traders should monitor closely as the next few weekly candles could define the trend for the rest of 2025.
#QTUMUSDT #QTUM #CryptoAnalysis #AltcoinSetup #TechnicalAnalysis #AccumulationPhase #SupportAndResistance #BreakoutPlay #CryptoBreakout
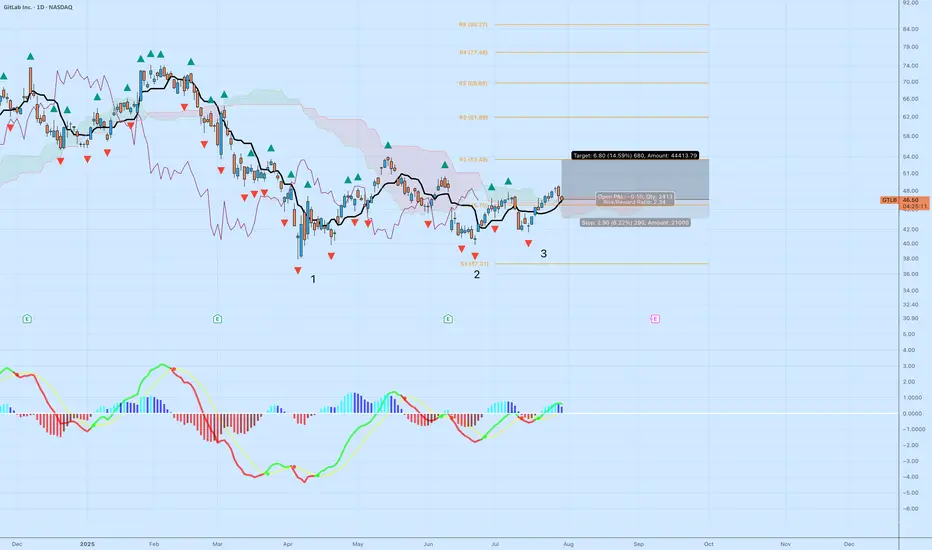
GTLB | Triple Bottom ReversalGitLab (GTLB) is setting up for a potential trend reversal following a textbook triple bottom pattern and a clean breakout above the cloud. Here's the technical breakdown:
Why This Setup Matters
Triple Bottom Pattern: Reversal structure is clear with three defined lows at ~$38, ~$40, and ~$41. The most recent leg up confirms buyers defending that zone.
Ichimoku Cloud: Price has broken above the Kumo with bullish Tenkan-Kijun cross. The leading span A is pointing up, and the cloud ahead is flat and thin — ideal conditions for continuation.
MACD Momentum: Histogram flipped positive again with green signal line crossover — a momentum shift from accumulation to breakout phase.
Trade Parameters
Entry: $46.53
Stop: $43.63 (below Tenkan and the neckline zone)
Target: $53.33
Risk:Reward Ratio: 2.34
Projected Move: +14.59%
Additional Confluence
Daily closes above cloud show growing strength from buyers.
Each bottom was followed by increasing MACD strength — a bullish divergence over time.
Pivot zone at R1 ($53.49) aligns with the price target, adding structure to the exit plan.
Risk Notes
Failure to hold $46 with volume could invalidate the breakout — watch for a retest.
If price closes below Tenkan, reevaluate the setup for weakness.
Volume confirmation needed on the next daily candle for strong conviction.
This is a technical breakout aligned with pattern recognition and trend metrics. Ideal for swing setups with controlled downside.
Bull Trap Confirmed: GBPUSD's 8% Rally Faces ExhaustionLets Face it we had a great 6 months already clocking 60%+ Returns already.
And after sitting ducks for almost 2 months now we finally have a trade.
- Its a very self explanatory chart
- Trading at resistance
- Head & Shoulder pattern
And the best part the right shoulder is still yet to be formed! My favourite type of entry.
1.It gives a better risk reward ratio (1:7 expected)
2.Better Entry (No long red candles)
3. And even if the pattern fails it we may still reach the neck line which is target 1.
Entry Criteria
- A Red candle at the entry Line Marked
- Stoploss Above the Entry Candle
Target 1- 1.3361
Target 2- 1.3252
Target 3- 1.3169
Keep Your Risk Reward Intact! Not An investment Advice

Bitcoin Free Value Gaps getting filled - 109 K target >
If you look back at the last time I posted a chart with Free Value Gaps ( FVG ) you will see an orange bar where PA currently sits...The reason it is no longer there is because it ogt "Filled"
It is much the sameidea as CME Gaps. Thay also get filled very often/
So, we can see 2 more FVG before 107K line and so, in the current market state and with the knowledge that in August, Markets often Dip, we may well see PA retreat to the Gap at 109K
What a superb buying oppertunity
End of post as I am enjoying an evening in the south of France, with wine and Fun..
What it stopping you ?

MDT (SPOT)BINANCE:MDTUSDT
#MDT/ USDT
Entry range (0.01350- 0.01480)
SL 4H close below 0.01251
T1 0.01900
T2 0.02200
T3 0.02438
_______________________________________________________
Golden Advices.
********************
* collect the coin slowly in the entry range.
* Please calculate your losses before the entry.
* Do not enter any trade you find it not suitable for you.
* No FOMO - No Rush , it is a long journey.


Major U.S. News Ahead—Will EURUSD Pivot?Good morning, my friends 👋
Here’s my EURUSD market analysis 📉
Currently, the pair is in a downtrend. I expect this downward move to end around 1.14899 or 1.14536, where a potential buying opportunity may emerge. I personally plan to enter a buy position once price reaches those zones 💼
Also, keep an eye on major U.S. economic reports being released today—they could trigger increased volatility 🔔
Every like you send is a huge source of motivation for me to keep sharing high-quality analysis 🙏 Thanks to everyone supporting the channel 💙

btc short tradeon 1hr timeframe btc take the inducement and on 15m done MSS and now rice going to retest the 15m advanced oder block
entry 19131
stoploss 120990
target 1; 114685
target 2 ; 113650

GOLD BEST PLACE TO SELL FROM|SHORT
GOLD SIGNAL
Trade Direction: short
Entry Level: 3,309.55
Target Level: 3,288.24
Stop Loss: 3,323.69
RISK PROFILE
Risk level: medium
Suggested risk: 1%
Timeframe: 45m
Disclosure: I am part of Trade Nation's Influencer program and receive a monthly fee for using their TradingView charts in my analysis.
✅LIKE AND COMMENT MY IDEAS✅

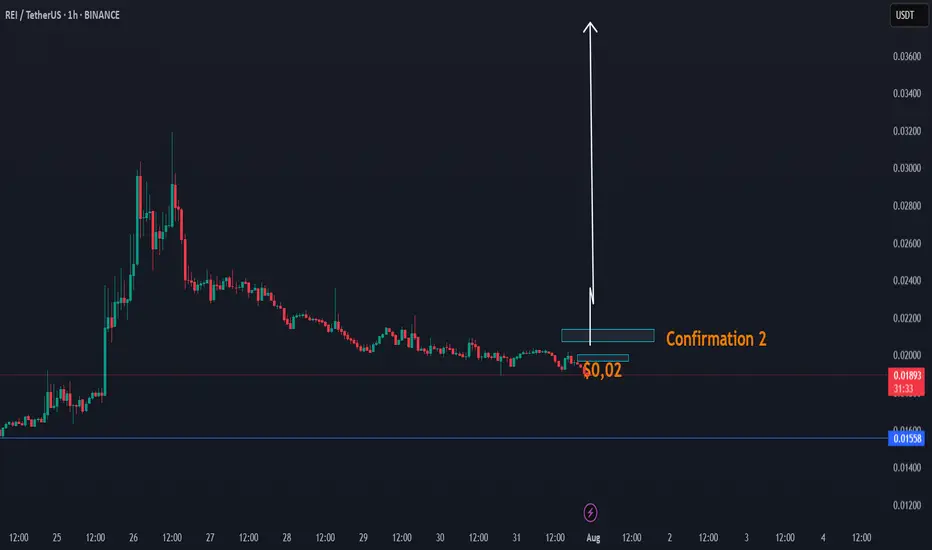
DAY UPDATE REI/USDT THE INCREASE CANDLE OF UP $0,03 - $0,05REI is an interesting coin since the update of Q4
We have seen that this coin was able to increase to $0,031 and until here $0,018 zone, a return to where we are now. There is a high chance that this coin can recover next 24H if this coin is able to confirm the confirmation $0,02 - $0,021
This coin, as before, was targeted at $ 0.02 and had low volume. We expect that if it comes back to $ 0.02, it will be confirmation of the volume, which can take the trend with a candle to up $0,03
REI CONFIRMATIONS ZONE
Higher time frame
When you look normally at this coin, then this coin is in a trend line of breakdown. This can change with the next confirmations. The question is, are we going to see again $0,02 the next 24h? If yes high chance of a break.
We also have a cycle update 2025, check it here, expecting $0,90
Sell-the-News Reversal📣 What’s up traders!
CFX just got injected with hopium from a pharma deal, a China stablecoin rumor, and the Conflux 3.0 upgrade… but here’s the thing: when price flies 119% and RSI hits 94, smart money starts reaching for the eject button. 🚨
🔥 TRADE SETUP
Bias: Short
Strategy: Sell-the-News Reversal
Entry: $0.25 – $0.27
SL: $0.29
TPs: $0.186, $0.145, $0.120
Why?
– HTF rally straight into resistance
– RSI 94 + $11M in short liquidations = exit liquidity confirmed
– OI and funding surged, now showing early cracks
– LTF BOS + failed continuation at highs.
Candle Craft | Signal. Structure. Execution.

SWING TRADE NASDAQIs this another case of Trump moving the markets so his buddies can get better entries? 👀
Not saying anything... but July candles were way too friendly in that yellow box. Institutions were loading up like it was Black Friday.
I jumped in too—snagged a clean 10RR 😎📈
Now, with seasonality (August 3.5% average past 10 years) + Commitment of traders data backing me up( July COT is heavy longs), I’m risking light for a tiny 27RR setup.
Will it work? No clue.
Will I be dramatic about it? Absolutely. 🎭📉📈
PUMP/USDT: Whales Buy the Dip as Price Holds Key LevelBINANCE:PUMPUSDT.P price has taken a steep 18% hit in the last 24 hours, but the 2-hour chart shows BINANCE:PUMPUSDT.P price action clinging to a critical Fibonacci support near $0.00259. The token is still trading inside an ascending channel, hinting that the bullish structure hasn’t fully broken yet.
Whales have been scooping up the dip aggressively, adding 5.4 billion PUMP tokens over the past week (a 35.8% jump in their holdings). Despite retail selling pushing netflows positive intraday, big wallets continue to absorb supply. Daily accumulation is also up 3.2% in the last 24 hours, reinforcing the demand floor near current levels.
Meanwhile, long positions dominate the liquidation setup, with $7.88 billion in longs versus just $3.6 billion in shorts. If BINANCE:PUMPUSDT.P price bounces, a cascade of short liquidations could amplify the recovery rally. But failure to defend $0.00259 risks opening the door to $0.00241, putting bulls on the back foot.
For now, the $0.00259–$0.00260 zone is the make-or-break level. Holding above keeps BINANCE:PUMPUSDT.P price inside the bullish channel, setting up a potential retest of $0.00284–$0.00294. A breakdown, however, could flip sentiment sharply bearish.

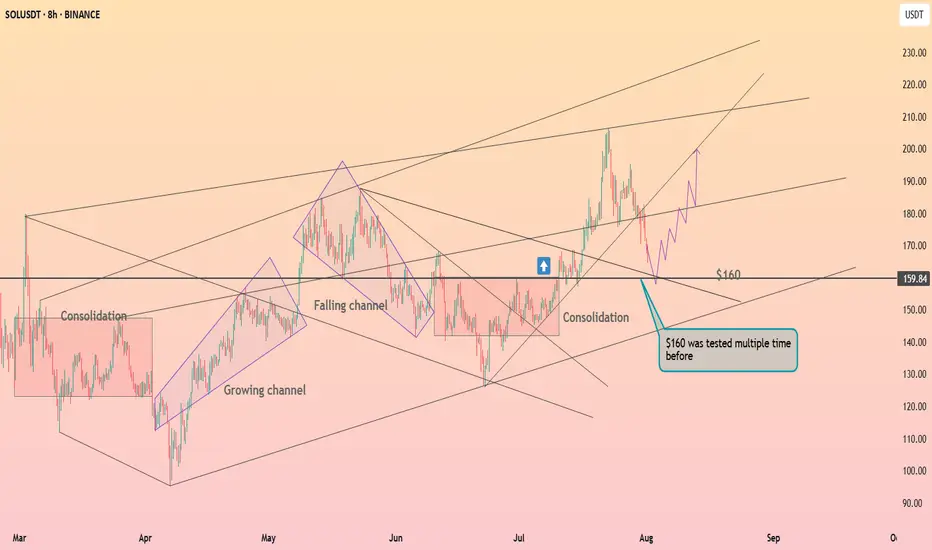
Solana above the $160 level ┆ HolderStatBINANCE:SOLUSDT is retracing toward the $160 support after failing to hold above $190. Price previously broke out from a falling channel and may find support at $160 again, where multiple reversals have occurred. A bounce here could fuel a move to $200.
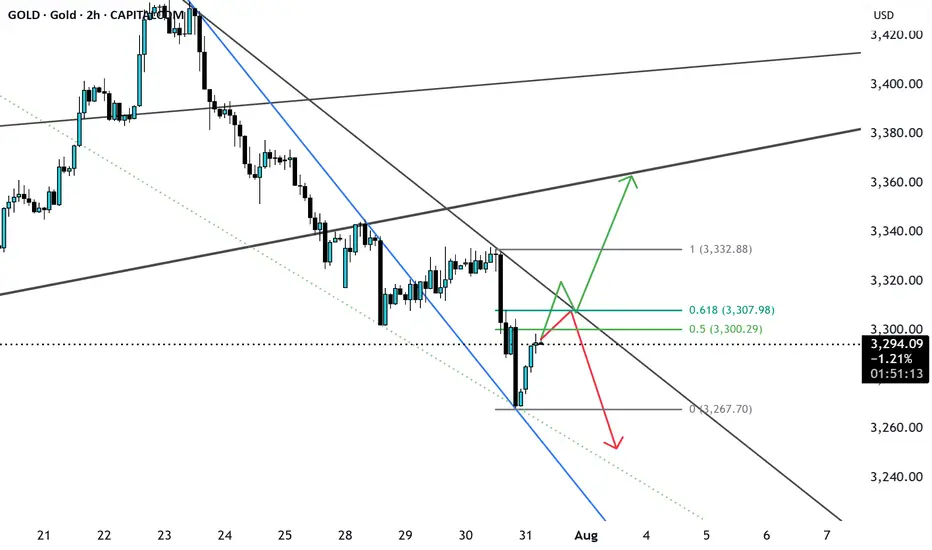
GOLD possible ScenarioCurrently gold has broken a major trendline and currently trading in bearish momentum, currently consolidating or pullback from support and may get rejected from 0.5 or 0.618 if bearish ahs to continue 3240-3250, if breaks the fib level along with trendline resistance can easily price can reach 3340 major resistance level. let us see.
Time to catch its breathAfter the break to lower prices in the daily S&P 500 chart, the expectation for Monday is for the market to stop and catch its breath which means are not looking for a big day down on Monday but rather a sideways so only slightly lower move without new fundamental information to stimulate the market.

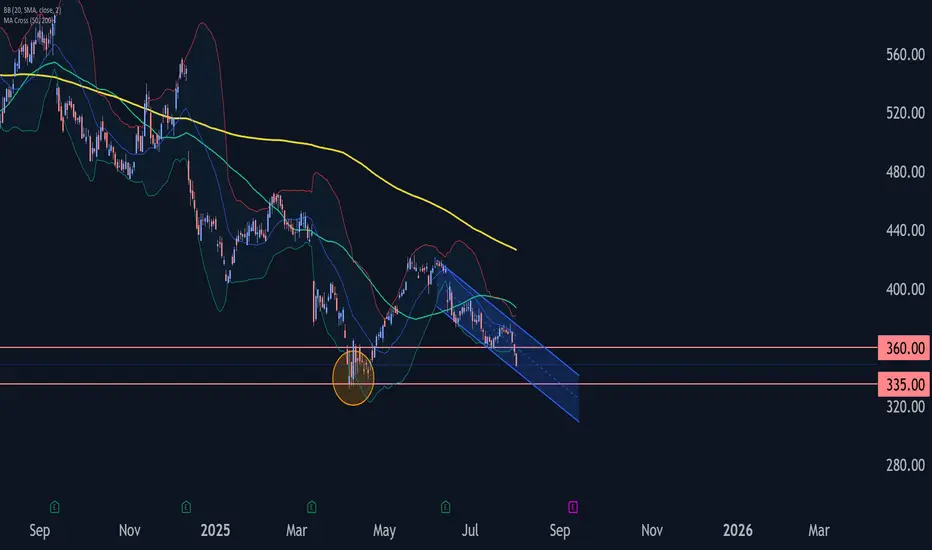
Adobe Wave Analysis – 1 August 2025- Adobe broke the key support level 360.00
- Likely to fall to support level 335.00
Adobe recently broke below the key support level 360.00 (which stopped the previous minor impulse wave i at the start of July).
The breakout of the support level 360.00 accelerated the active impulse wave C of the medium-term ABC correction (2) from the end of May.
Given the strong daily downtrend, Adobe can be expected to fall further to the next support level at 335.00 (the double bottom from April and the target for the completion of the active impulse wave C).
HYPE/USDT: "A++" Long Setup - A Perfect Storm of ConfluenceHello traders,
This analysis covers what I consider to be an "A++" high-probability long setup on HYPE/USDT, viewed on the 9H timeframe. It is rare to see this many powerful technical factors align at once, signaling a potential major bottom and the start of a new bullish leg.
1. Trend & Context (The "Why")
The price has pulled back into a critical zone where a confluence of price, time, and momentum indicators are all screaming bullish.
Here is the checklist of the extraordinary confluences:
1. Price Action (LSOB Demand): The primary signal comes from price action. The price has entered a major Bullish LSOB (Liquidity Sweep Order Block) on the 9H chart. This is a critical institutional demand zone where we expect strong buying interest.
2. Time-Based Confluence (Fibonacci Cycle): This is a unique and powerful confirmation. The potential reversal is occurring precisely on a 144 Fibonacci Time Cycle line. When a key price level aligns with a major time cycle, the probability of a significant market turning point increases dramatically.
3. Dynamic Support : The LSOB zone is also confluent with the EMA 200, adding another layer of strong dynamic support to this area.
4. Momentum Exhaustion (MC Orderflow): The momentum oscillator provides the final, undeniable confirmation:
The MC Orderflow itself is in the OVERSOLD zone on this 9H timeframe.
THE CRITICAL CONFLUENCE: The Multi-Timeframe Cycle Table shows that the 4H and Daily timeframes are BOTH "Oversold". This trifecta of oversold signals (4H, 9H, and Daily) is the highest level of momentum confirmation we can get.
2. Entry, Stop Loss, and Targets (The "How")
This powerful alignment provides a very clear trade plan with an exceptional risk-to-reward ratio.
Entry: An entry at the current price level ($38.50 - $39.30) is ideal, as it is directly within the LSOB demand zone.
Stop Loss (SL): $37.50. This places the stop loss safely below the entire LSOB zone and the recent swing low. A break below this level would invalidate this entire bullish structure.
Take Profit (TP) Targets:
TP1: $42.50 (Targeting the cluster of short-term EMAs, which will act as the first resistance).
TP2: $45.00 (The bottom of the Bearish LSOB supply zone, a major magnet for price).
TP3: $49.90 (The major swing high of the range, for a full trend continuation).
Conclusion
This is one of the highest-quality setups I've seen. The perfect alignment of a key price level (LSOB), a major time cycle (Fib 144), and multi-timeframe momentum exhaustion (4H & Daily Oversold) creates a textbook, high-conviction environment for a significant bullish move.
Disclaimer: This is not financial advice. This analysis is for educational purposes only. Always conduct your own research and manage your risk appropriately.


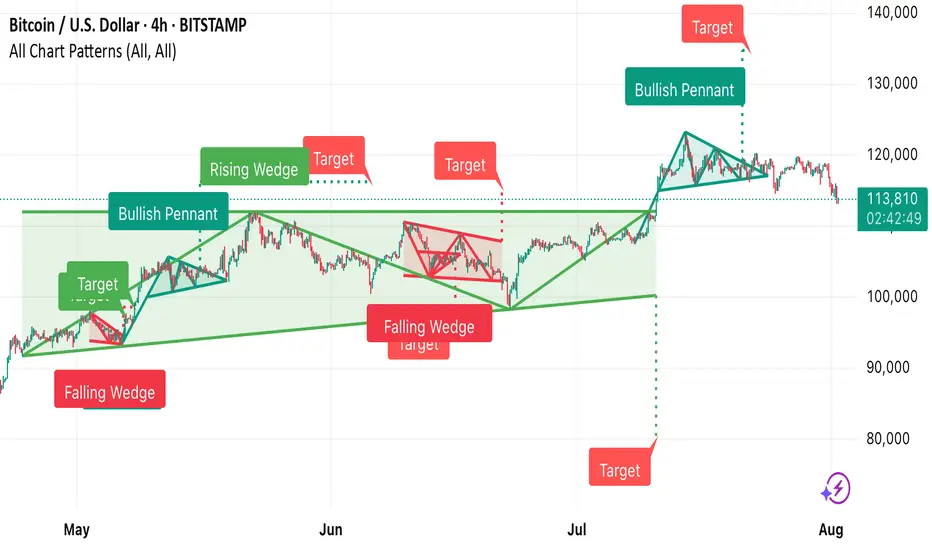
This Bitcoin 4-hour chart from TradingView shows multiple techni • Falling Wedge (early May) → Bullish breakout, target achieved.
• Bullish Pennant → Strong upward continuation.
• Rising Wedge (June) → Bearish breakdown, target met.
• Falling Wedge (mid-June) → Bullish breakout, target achieved.
• Bullish Pennant (late July) → Upward move toward the 140,000 target zone.
Currently, BTC is trading around 113,829, below recent highs, and near the dotted horizontal support zone from the last breakout.