APT - HUGE POTENTIAL (130+% SPOT) You probably forgot about this altcoin but it is justified. Downtrend since 2023 and lower highs, lower lows but....
If we look more close and use tool fixed price volume we can see that price is above VAL (Value area low), we had break through but price returns..Also good reaction of FVG (Fair value gap).
Now, we can try buy this coin and have some stop lose. Price is in range 172 days and all people forget abut this coin. Analysis is right only if we close daily candlestick about 6$.
Stop lose can be below 4.4$ which is 6-7% of losing.
Second entry is monthly level at 3.3 and stop lose should be below the lowest low 3$.
For me is great opportunity because risk reward is excellent.
Ivan
Trend Analysis

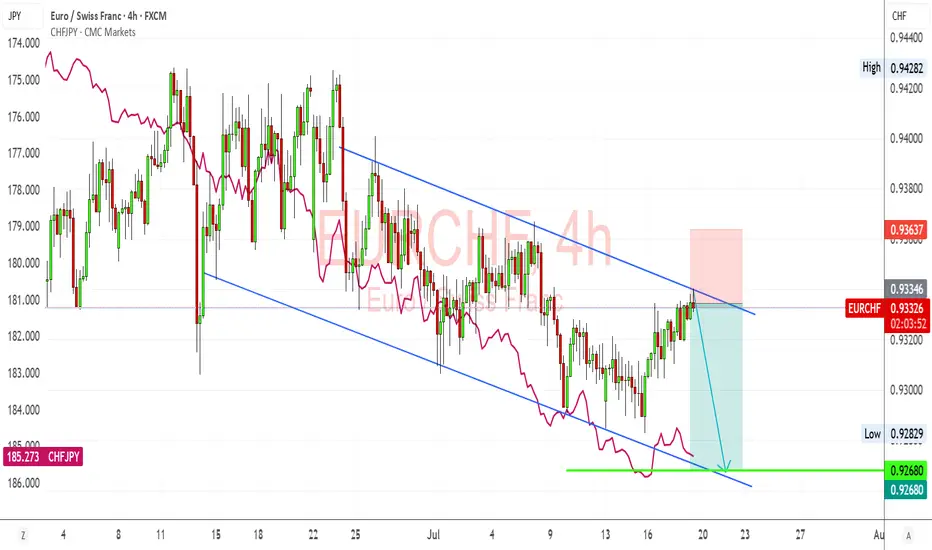
EURCHF – Bearish Channel Holds Firm, CHF Strength Set to ResumeEURCHF just tapped into the descending channel resistance again and is showing signs of rejecting. I'm expecting a bearish continuation here, especially given the strong CHF momentum recently, supported by safe-haven flows and Swiss inflation stability. If the pair fails to break above 0.9340, I’m watching for a downside push back toward 0.9270–0.9265, completing another leg within the structure.
🔍 Technical Setup (4H):
Channel Structure: EURCHF remains firmly within a downward-sloping parallel channel since mid-June.
Resistance Rejection: Price recently tested upper channel resistance (~0.9335–0.9340 zone), aligning with trendline rejection.
Target Support: 0.9270–0.9265 (channel base and key horizontal level).
Confluence: CHFJPY overlay (pink line) is rising again, suggesting renewed CHF strength—this usually weighs on EURCHF.
💡 Fundamental Insight:
EUR Side:
ECB officials remain cautious, but with recent EU data showing weaker growth (especially PMIs and sentiment), euro upside is capped.
The ECB is likely to pause further tightening, while other central banks like SNB remain firm on inflation risks.
CHF Strength:
The Swiss National Bank (SNB) still leans hawkish, with stable inflation giving room to hold rates steady or tighten if needed.
CHF benefits from risk-off flows amid global tariff headlines, China slowdown, and Middle East tensions.
Rising CHFJPY = clear CHF strength across the board.
⚠️ Risks:
If eurozone data surprises to the upside (e.g., inflation rebounds), EURCHF could break out of the channel.
A sudden drop in geopolitical tension or strong risk-on rally could weaken CHF as safe-haven demand falls.
SNB jawboning or FX intervention is always a wildcard.
🧭 Summary:
I’m bearish on EURCHF while it respects this well-defined descending channel. The technicals show consistent lower highs and lower lows, while the fundamentals continue to support CHF strength due to risk aversion, stable inflation, and a resilient SNB. My short bias is valid as long as price remains below 0.9340, with downside targets at 0.9270–0.9265. CHFJPY rising confirms franc leadership across FX markets, and EURCHF is likely a lagger following broader CHF strength.
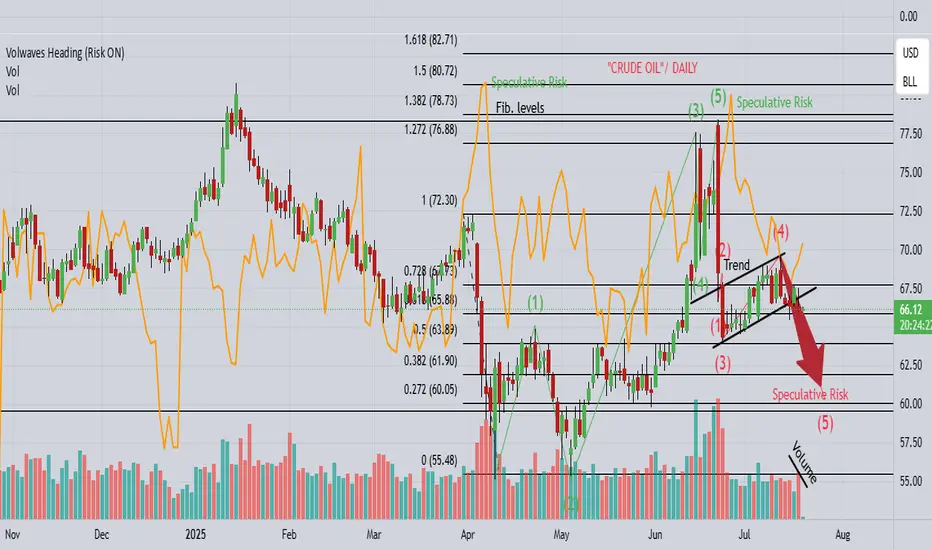
CL "OIL" continues the drop towards $60!1). Wave 5 drop needs a completion lower! 2). Risk is selling off! 3). Volume is falling! 4). Price appears to be heading towards lower market sentiment! 5). Trump is imposing more Tariffs, which is likely causing deeper corrections!
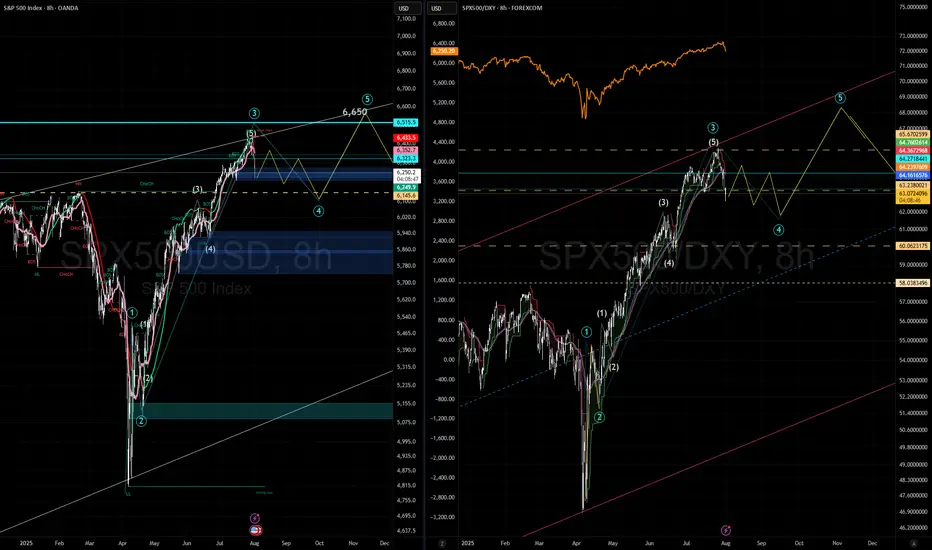
S&P's "hugely overbought" towards 6375!1). Position Volume dropping! 2). Big institutions (Banks & Insurance) have backed off on higher Risk positions! 3). Huge resistance at .728 fib & trend! 4). Trump tariff talk is likely adding to a fall as well! 5). We're looking for a "SELL" trade @ 6375, since buying is too risky at the moment...Good Luck!

Trading the Pullback on EURJPY My Trade PlanThe EURJPY is clearly in a strong bullish trend 📈, as shown by a consistent pattern of higher highs and higher lows on the 1H timeframe ⏱️. In this video, I’m looking to capitalize on a pullback as a potential buy opportunity 🎯.
We dive into my entry strategy, explore how to align with the prevailing trend, and break down key concepts such as price action, market structure, and smart pullback zones 🧠📊.
⚠️ As always, this is for educational purposes only — not financial advice.

SPX range bound unit September expirationExpect sideways wave 4 to last 4 weeks, volatility, (small positions: sell up, buy dips or do NPOTHING and hold. Basically these types of Wave-4 are where traders loose money from Wave-3.
AUDUSD Technical & Order Flow AnalysisOur analysis is based on a multi-timeframe top-down approach and fundamental analysis.
Based on our assessment, the price is expected to return to the monthly level.
DISCLAIMER: This analysis may change at any time without notice and is solely intended to assist traders in making independent investment decisions. Please note that this is a prediction, and I have no obligation to act on it, nor should you.
Please support our analysis with a boost or comment!

TON Bearish DivergenceBINANCE:TONUSDT
Trade Setup:
Target 1: 3.523 (0.786 Fibonnaci Golden Zone).
Target 2: 3.389 (0.618 Fibonnaci Golden Zone).
Target 3: 3.295 (0.786 Fibonnaci Golden Zone).
Target 4: 2.897 (0 Fibonnaci).
Stop Loss: 3.910 (1.272 Fibonnaci).
RSI Analysis: The RSI is showing a bullish divergence, suggesting potential bullish momentum. The current RSI is around 75.44, approaching overbuy territory, so caution is advised.

Nasdaq US100 Wave 3 Expansion Toward 31,606 in PlayNasdaq US100 has completed a significant wave cycle with a confirmed wave 1 in the broader Elliott Wave structure. Following this, price underwent a corrective wave 2 that extended from the $22,237 supply zone down to $16,334, marking the conclusion of the previous cycle’s correction. This structure now signals the initiation of a fresh upward impulse, setting the stage for a powerful wave 3 advance.
The emergence of wave 3 will gain full confirmation once price successfully breaks above the external supply zone, reclaiming $22,237. If this breakout occurs with sustained momentum, the wave 3 projection targets an expansion toward $31,606, which aligns with the 161.8% Fibonacci extension from the prior cycle. This forthcoming rally is anticipated to unfold in a five-subwave format, indicative of a high-momentum bullish leg.
As long as price action remains above the key support at $16,334, the bullish cycle remains valid. All eyes should now be on the breakout structure and volume profile around $22,237, as it represents the gateway to a much broader impulsive move.

Bitcoin willIt hold if we stay above $115k ?? Fixing up last post I’ve deleted now as image was not good. Anyway simple RSI and Auto Fib Retrace with only general CRYPTOCAP:BTC market understanding backing this. This isn’t finacial advice at all. It’s pure speculation this post and anything related to it. I’m
Not a finacial advisor and I will not be held accountable for anyone’s actions that I didn’t do.

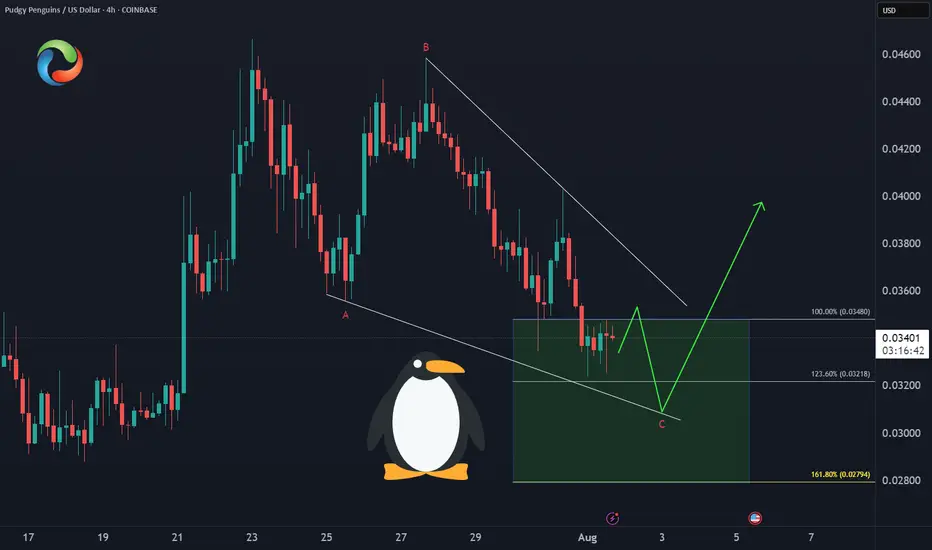
PENGU Enters Demand ZoneCOINBASE:PENGUUSD 🐧Price has developed a clean A-B-C correction into the equal legs support zone at $0.034-$0.028, offering:
✅ Optimal risk/reward entry
✅ Wave structure confirmation
✅ Higher low potential
This is the technical sweet spot for the next rally leg.
The next levels for Solana coinIn this video I recap the previous video and discuss what may be next after the current retracement .
I reveal some important levels that sit below as well as the relationship with the Eth/Btc chart.
Tools used vwap, Fibs and volume profile .

GOLD Bullish Today , Long Scalping Entry Valid To Get 150 Pips !Here is My 15 Mins Gold Chart , and here is my opinion , we finally above 3296.00 and we have a 30 Mins Candle closure above it , so i`m waiting the price to go back and retest this res and new support and give me a good bullish price action to can enter a buy trade and we can targeting 100 to 150 pips .
Reasons To Enter :
1- New Support Created
2- Bullish Price Action
3- Bigger T.F Giving Good Bullish P.A .

Is the uptrend complete? Will there be a pullback?On the last trading day of this week, gold prices soared, rising nearly $56, driven by the non-farm payroll data. The rally began at 3300 and peaked near 3356. The price has now retreated slightly, fluctuating around 3345.
The current uptrend has repeatedly tested the resistance level near 3355 but has failed to break through. The RSI indicator hovered around 76.8, indicating a gradual flattening of the upward trend. The 3355 high is likely the end of this uptrend.
As this is the last day of a major data week, Quaid believes the current uptrend is complete. Consider a light short position around 3350-3355. The current low has yet to be confirmed, and the pullback is likely to end around 3335.
However, we cannot rule out the possibility that the price will remain within the upward channel with slight fluctuations on the last trading day of the week.

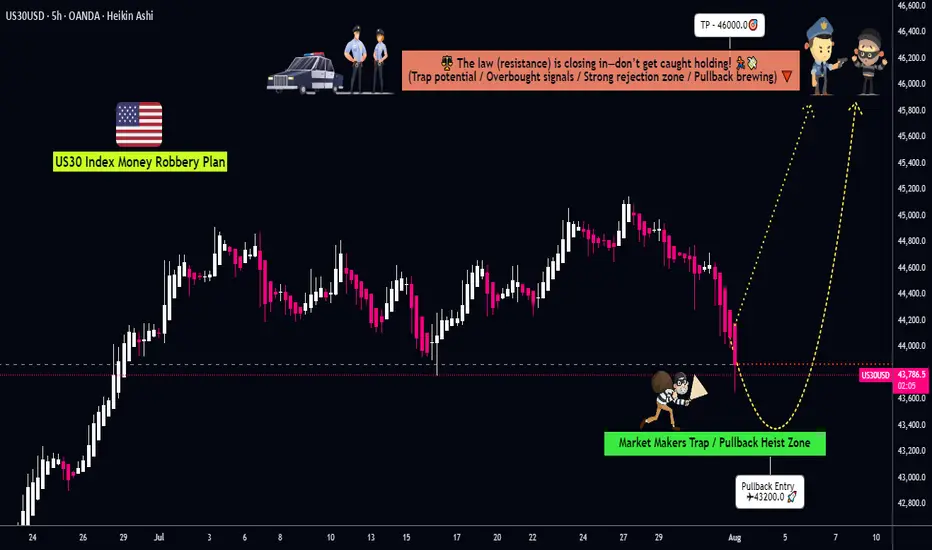
Dow Jones: Explosive US30 Trade Setup – Entry,Trap & Exit Mapped💎 Dow Jones Robbery Blueprint: The US30 Vault Crack Plan 💎
(Maximized for reach — within TradingView title limit)
🌟Hi! Hola! Ola! Bonjour! Hallo! Marhaba!🌟
Dear Market Robbers & Money Movers 🕵️♂️💰🚨
This ain't your average analysis — it’s a Thief Trader-style 🔥tactical mission🔥 aimed at the mighty "US30/DJI" (Dow Jones Industrial Average). We're talkin' about a precision heist with a full blueprint: entry zones, trap setups, and escape exits. Read carefully — this ain’t for the faint-hearted traders! 🧠🦾
🧠 Entry Zones (The Break-In) 📈
🛠 ENTRY 1: Candle wick near 44200.0 – that’s the resistance gate. Wait for confirmation.
🎯 ENTRY 2: Sneak in at the Market Makers’ Trap around 43200.00 – a dirty zone where retailers get baited. Perfect time to strike long!
🧱 DCA/Layering strategy recommended. Stack those buy orders like a thief layering explosives on a safe. 💣💸
🛑 Risk Levels (Escape Routes/Stop Loss)
🔊 "Listen up, vault raiders! Never drop your SL until breakout is confirmed. If you jump early, you might land in a bear trap! 🪤"
🔐 Stop Zones (Based on Strategy):
🔐 Max Risk SL (5H TF): If you're deep, your last stand is at 43000.0
☝️ SL depends on your position sizing, number of entries, and risk appetite. Trade like a thief, not a gambler.
🎯 Heist Target (Profit Exit)
🏁 Escape Point: 46000.0 — or exit before heat rises! Don’t be greedy. Rob and vanish. 💨💰
🔥 Market Mood: Why the Heist Is On
"US30/DJI" is bullish AF — thanks to:
📊 Macro-Economic Wind at Our Back
📈 Institutional momentum
📰 Strong sentiment and intermarket flows
Check your chart radar: Fundamentals + technicals aligning = green light for robbery! 🟢
⚠️ Tactical Reminder: News Can Jam the Plan
📵 Avoid new entries during major economic releases
🛡 Use trailing SLs to protect running trades
Stay alert, stay alive. 💡
❤️ Support the Robbery Crew
Hit that 💥BOOST💥 — your love fuels our next mission.
Join us and ride daily heist plans with Thief Trading Style 🏴☠️🚀💰
ETH BUY SETUP ,Bought From $3830ETH BUY SETUP
Currently $3830
Bought From $3830
(Trading plan If ETH go down ,
to $3700 will add more longs)
Expecting target $3890 OR ABOVE
Stoploss at $3470
In the event of an early exit,
this analysis will be updated.

POSSIBLE BEARISH CONTINUATION ON GOLDBased on price action, Gold presents a very bearish sentiment from the daily point of view.
The indicated supply region may be the area of interest for the build up of the sells if indeed Gold is bound for the monthly lows.
Confirmation is needed for an entry.

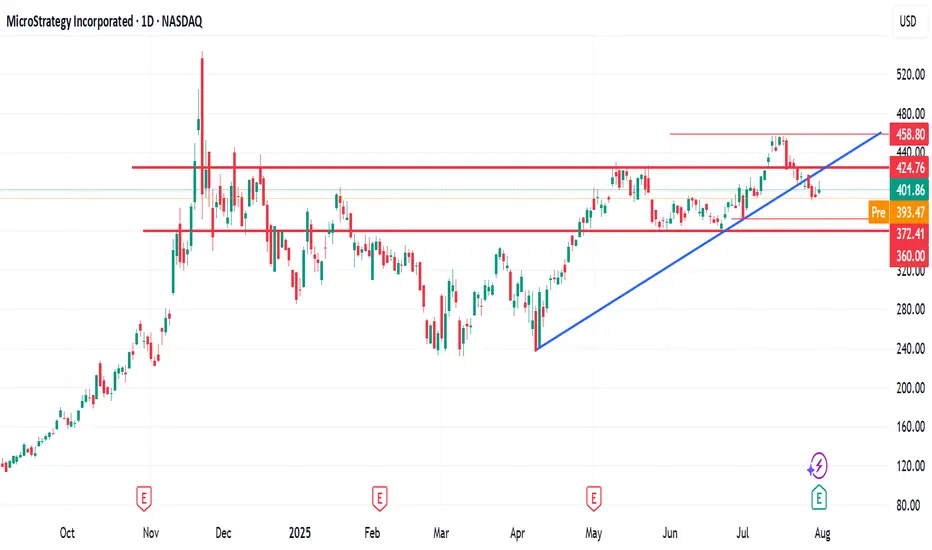
$372 - $360 is imminent$372 - $360 is imminent.
Following a break below the highlighted key support TL, MSTR fall to as low as $370 to $360
XAUUSDXAUUSD breakout falling channle and resistance zone.
Buy above 3295
Stop Loss: 3291
1st TP: 3308
2nd TP: 3313
3rd TP: 3322
4th TP: 3333

BNB/USDT 4H Chart: Rising Channel with Fractal Vibes!Hey traders! Binance Coin is showing some promising action that’s got me on the edge of my seat!
We’ve got a clear rising channel in play, with BNBUSDT moving beautifully in sync with a fractal line pattern shown above the chart — mirroring past price behavior like a roadmap! BNBUSDT is currently trading at $650 , I think price will continue bouncing between the channel’s support at $620-$600 and move upwards to the key resistance target at $700-$720 . A breakout above this resistance could send BNB soaring to new highs, potentially targeting $800 or beyond!
However, if BNB fails to break through, we might see a pullback to the channel support at $620-$600 .
Key Levels to Watch:
Resistance: $700-$720
Support: $620-$600
Breakout Target: $800+
Breakdown Risk: $600
Is BNB about to blast through $720, or will it retreat below support? Let’s hear your thoughts below!

BTC CAN HIT 125K AFTER SHORT CORRECTIONHello friends, Bitcoin has made an incredible climb, carefully looking at the chart and also based on Elliott wave theory, it is clear that Bitcoin is completing submicro wave 4 of micro wave 5, wave 4 is usually an extended wave that covers a large time period with up and down fluctuations, I think the end of submicro wave 4 will be in the 110k-112k range in the four-hour timeframe. I think Bitcoin will break the 25k range in the coming days.


GOLD: Short Trading Opportunity
GOLD
- Classic bearish formation
- Our team expects fall
SUGGESTED TRADE:
Swing Trade
Sell GOLD
Entry Level - 3299.9
Sl - 3304.2
Tp - 3291.3
Our Risk - 1%
Start protection of your profits from lower levels
Disclosure: I am part of Trade Nation's Influencer program and receive a monthly fee for using their TradingView charts in my analysis.
❤️ Please, support our work with like & comment! ❤️
