Get out now! Bullmarket might be over This is LMACD applied to GC with reduced lag. If this time is not different we just had our cycle top ~123k. Sell some coins and buy back around 2026 ~44K
Trend Analysis

XAUUSD TRADE UPDATE MISSED TRADE Hey everyone here’s a trade recap of the week at first we were interested to take buys at 3254 zone as first entry and scale in at 3287 zone but price pulled down slightly missed the first entry and I didn’t execute & the second entry didn’t execute that too and market skyrocket if price activated the first entry we would’ve caught a huge trade today,the first one didn’t activated so I didn’t execute the second entry which is the 3287 zone that buyers came in so we move on and I will keep on sharing potential good setups and have a beautiful weekend guys….

SUI | Spot Buy Zone for PullbackPrice has pulled back after a local top and is heading toward a clear demand zone.
Key buy area sits around $3.12, aligned with 0.618 retracement and recent consolidation.
Strong structure below—if majors keep retracing, this is where risk/reward for new spot buys becomes attractive.
Plan:
Waiting for price to reach the green zone to accumulate spot.
Invalidation below $2.80, targeting a move back toward $4.45 and higher if momentum returns.

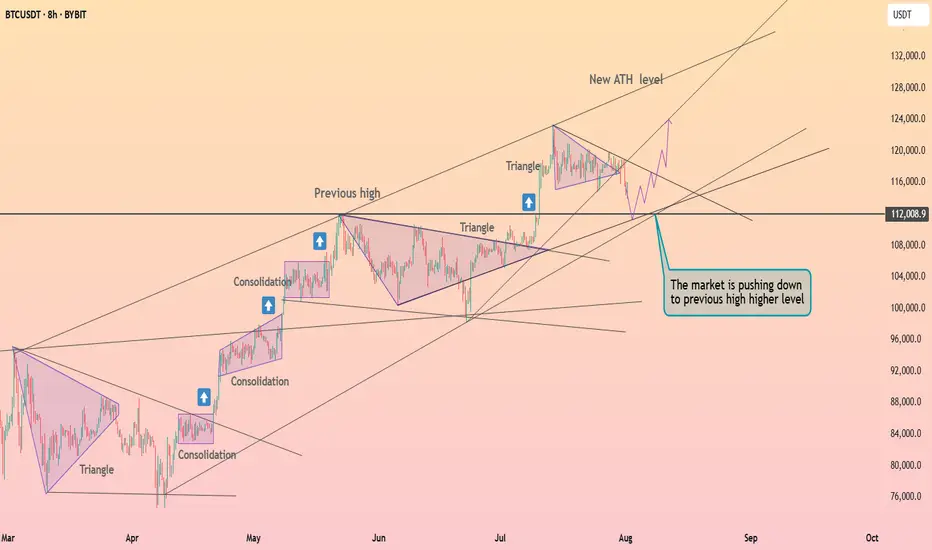
Bitcoin exited from the triangle ┆ HolderStatBINANCE:BTCUSDT is dipping to retest $112,000, the last breakout level. The price remains inside a large ascending triangle and may soon resume its uptrend. If this support holds, targets above $125,000 come back into play.
BTC | Short Bias — Targeting $113kPrice rejected perfectly off the 0.5 retracement and is now filling the previous imbalance.
Yesterday's daily close was decisively bearish, confirming downside momentum.
There’s a lack of convincing reversal signals at current levels.
Plan:
Main expectation is continued downside toward the $113k support.
Not interested in longs until price stabilizes at or below that level.

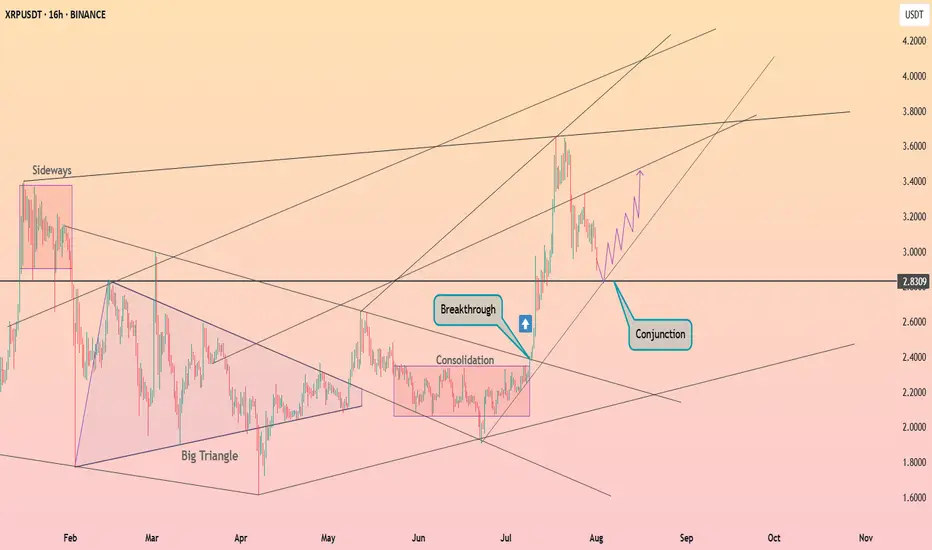
XRP continues to pullback ┆ HolderStatBINANCE:XRPUSDT surged above $2.83 after consolidating in a tight range. Price is now retesting the breakout zone at a key structural conjunction. If the level holds, a renewed move toward $3.40 may follow as bulls reclaim control.
BTC 4H – Support Tapped 2x After Breakout, Will Bulls Step In?Bitcoin is retesting a major demand zone that launched the last breakout. After a sharp impulse move, price has ranged tightly and just tapped this support area for the second time.
A clear double bottom attempt is forming, but failure to hold $115K could open the door to deeper downside. Bulls want to see a quick reclaim of $117K to confirm structure still holds.
Clean levels. Clear reaction zones. Let’s see who takes control.

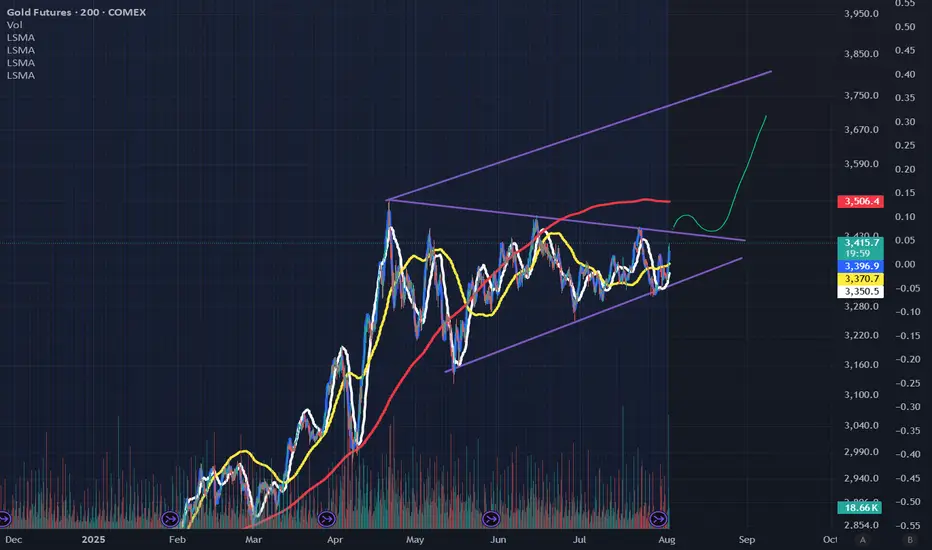
Gold completing a 4-month Bull Flag consolidation, 3800 next! We can see the classic bull flag consolidation pattern which has been going on ever since the stock market decided to go on a rager!
Even with that going on, smart money continues to buy gold on the dips as you should too.
Once Trump installs a phoney new BLS chief and moves to pressure the Fed by nominating a new governor after Kugler's departure the message will be clear:
1) the BLS and the Fed are no longer independent
2) the US dollar is going to tank
3) Gold is going to boom!
Good luck and happy trading!
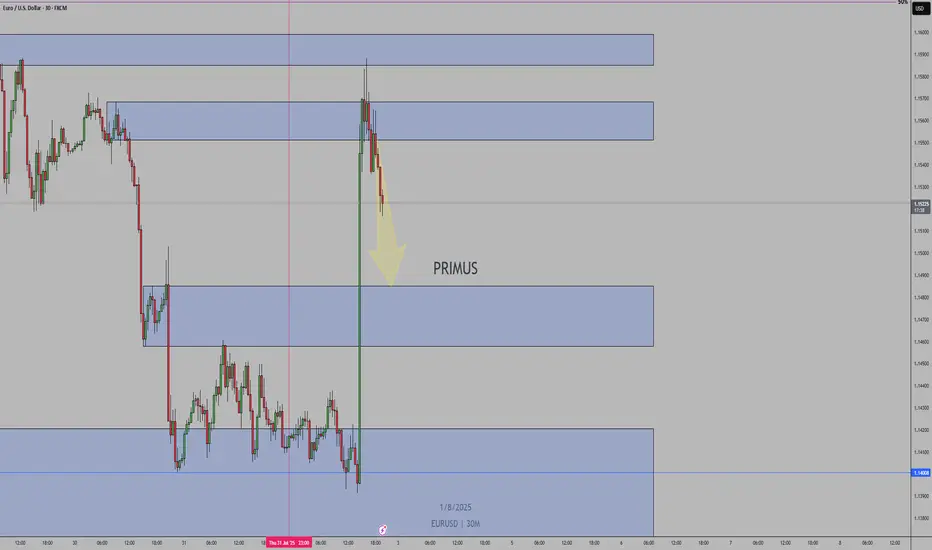
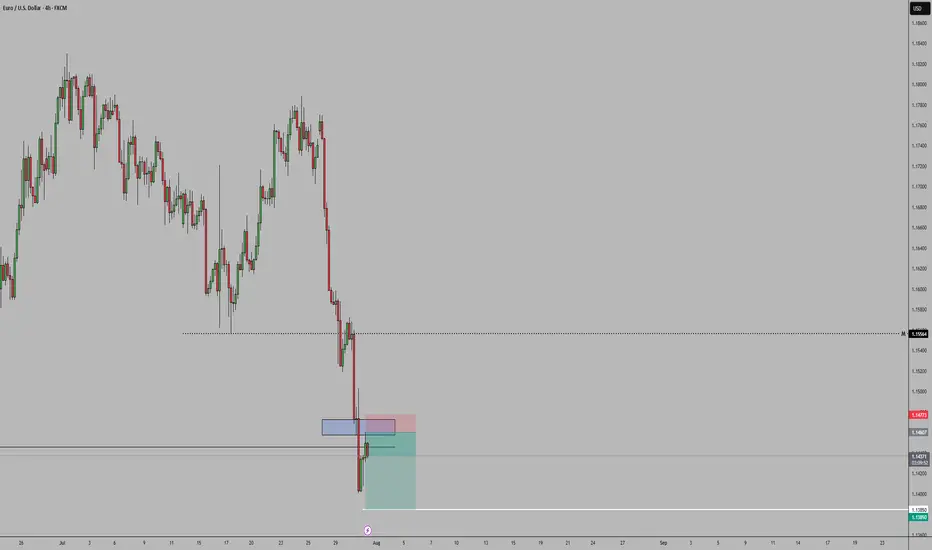
EURUSDPrice rejecting supply; structure showing lower highs/lows. COT supports USD strength — expecting further downside.
EUR/USD (Bearish)
Price rejecting supply; lower highs/lows forming with COT backing USD strength. Bias remains bearish toward next support.
USDCHFUSD/CHF Bullish Bias — Price is holding above demand with market structure showing higher highs and higher lows. COT data supports continued USD strength. As long as demand holds, expecting further upside towards next resistance.

EURUSDWe have a strong bearish sentiment for EURUSD this week, so meaning big instituttions are selling the pair so we follow their lead. And we can see that we just broke below a support which is now acting as a resistance, more bearish momentum continuation can we expected
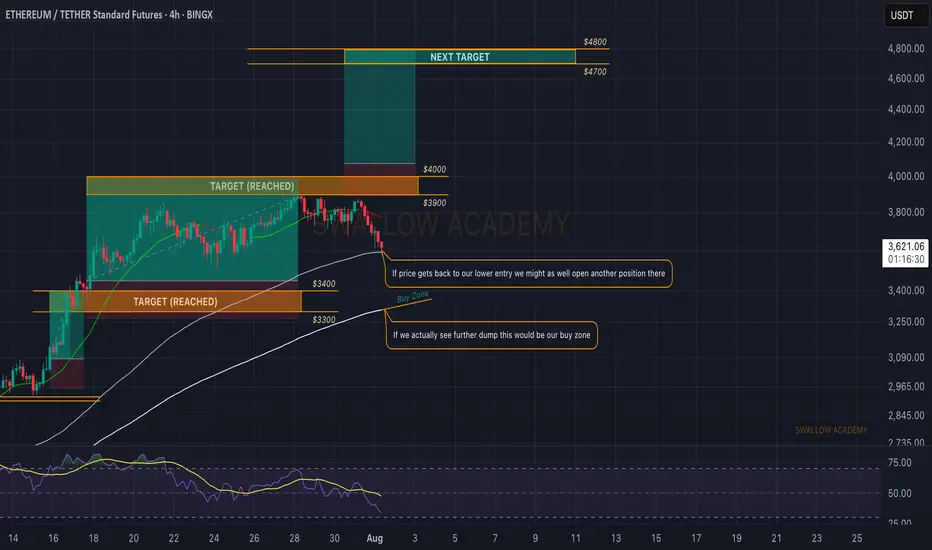
Ethereum (ETH): Bloody End of Week & Start of Month | We Wait!Well, we were close to breaking out of the $4000 area and now we are back on the lower side of the area, where sellers are showing strong pressure to coin.
As we approached the 100 EMA, we waited. Waiting is the worst part of trading, but that's what we do here. The 200 EMA is one key zone for us for another buying opportunity so if we keep on falling, that's the zone we are aiming for.
The second point of interest is the current 100 EMA, where if we see MSB to form, there might be a smaller scalp opportunity.
And last but not least, the zone above $4000.
Swallow Academy
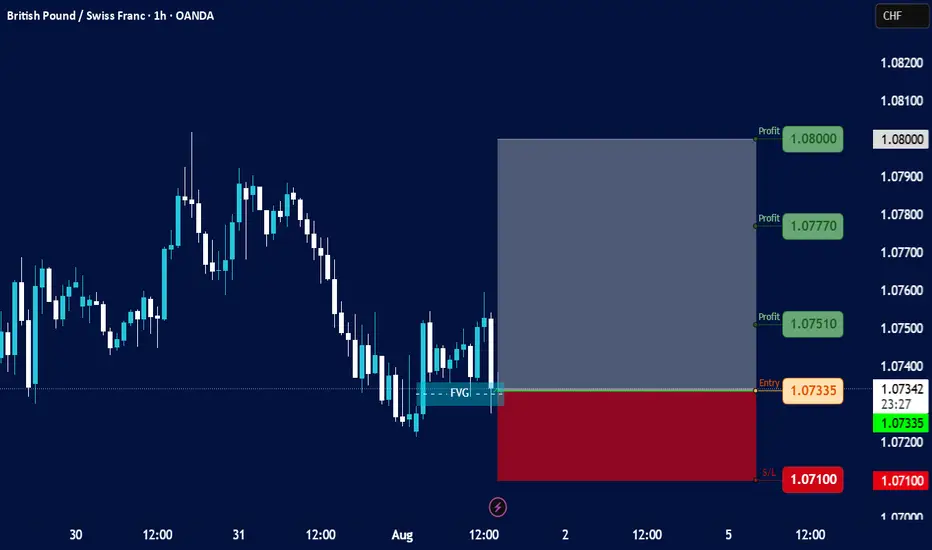
Technical Analysis: GBP/CHF (British Pound / Swiss Franc)Timeframe: Hourly (H1) – *Data as of Aug 01, 2025, 14:33 UTC+4*
Source: OANDA via TradingView
1. Key Price Levels
Current Price (C): 1.07357 (+0.09% from previous close).
High/Low (H/L): 1.07386 / 1.07308 (narrow range, indicating consolidation).
Resistance Levels:
R1: 1.07514 (near-term resistance).
R2: 1.08208 (stronger resistance).
Pivot Point (P): 1.07723 (intraday benchmark).
2. Price Action & Trends
Short-Term Trend: Slightly bullish (+0.09% gain), but trading near the day’s low (1.07308).
Volatility: Low (tight range between 1.07308–1.07386).
Support Zone: 1.07200–1.07335 (critical for bearish reversals).
3. Technical Indicators (Implied)
Pivot Points (PVC): Price is below the pivot (1.07723), suggesting bearish pressure unless it breaks above.
Resistance/Support:
Bulls need to push above R1 (1.07514) to target R2 (1.08208).
Bears aim for S1 (1.07335) or lower (1.07200).
4. Trading Signals
Bullish Scenario: Break above 1.07514 (R1) could signal upward momentum toward 1.07723 (Pivot).
Bearish Scenario: Drop below 1.07308 (today’s low) may extend losses to 1.07200.
Neutral Zone: Price oscillating between 1.07308–1.07386 suggests indecision.
5. Risk Management
Stop-Loss (S/L): Below 1.07200 for longs; above 1.07514 for shorts.
Take-Profit (T/P):
Longs: 1.07723 (Pivot) or 1.08000 (psychological level).
Shorts: 1.07200 or 1.07000.
6. Conclusion
Current Bias: Neutral-to-slightly bullish, but lacks strong momentum.
Watch For: Breakout from the 1.07308–1.07514 range for directional clarity.
Caution: Low volatility may lead to false breakouts; confirm with volume/RSI if available.
Recommendation: Wait for a confirmed breakout with volume before entering trades.
Buy when everyone is fearful UNH took a beating, earnings might surprise tomorrow. speculative pending positive earnings report. Target and stop loss on the chart.

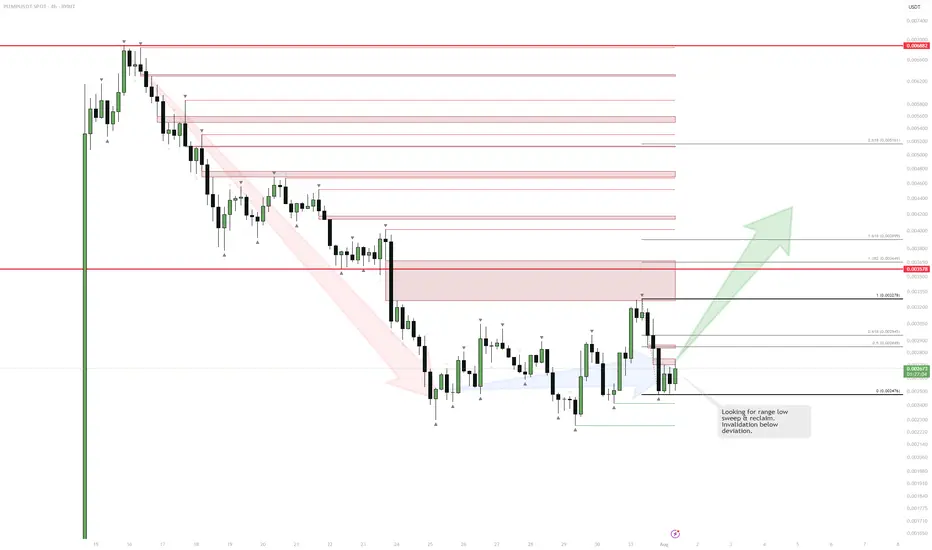
PUMP | Watching for Base ConfirmationThe sharp downtrend is showing signs of exhaustion as price starts to consolidate and build a potential range.
If we see a sweep and reclaim of the range low, that would confirm the start of a new accumulation phase and signal a potential reversal.
The invalidation for any long attempt is a confirmed breakdown below the deviation or the origin of the reclaim.
Plan:
Wait for a clean sweep and reclaim of the range low to trigger a long entry.
Target resistance levels above, with stops set below the reclaim origin.
Gold non-farm payrolls are bullish, long and short positions ana
Rather than envying the fish by the river, it's better to retreat and weave your net. We often envy the wealth others can earn by investing in the gold market. We often watch them enthusiastically investing, but we ourselves are afraid to enter the market. The two major factors that drive the market, technology and news, are a topic of constant debate among investors. To navigate the market, one must master the art of attack and defense to remain rock-solid while remaining at the forefront. As the saying goes, trust me, and I will reward you with profits!
Gold Data is Bullish!
The positive non-farm payroll data sent gold soaring, with gains completely erasing all of the week's losses. Currently, gold's trend has reversed the stagnant bullish and bearish trend. After breaking through the 3300 mark and rising all the way to 3348, it shows no signs of stopping. A further test of the 3370 level is not out of the question!
Due to the strong bullish data, if you don't immediately chase longs or place a breakout long order during the first wave, you'll likely have little chance of a pullback. Therefore, you should remain aggressive in your trading strategies. We recommend a pullback to the 3332-30 level to continue the bullish trend. Upward pressure is expected at 3372-75! The market fluctuates violently, and more real-time entry and exit points are mainly based on Yulia's real-time guidance!

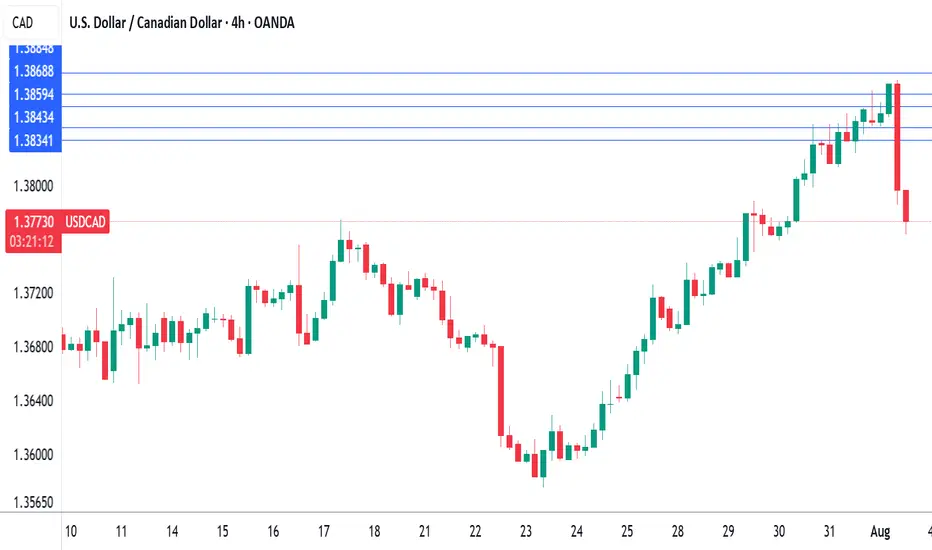
Canada's GDP contracts, US nonfarm payrolls misses forecastThe Canadian dollar continues to lose ground against its US counterpart and is trading at two-month lows. In the European session, the Canadian dollar is trading at 1.3875, down 0.13% on the day. USD/CAD has risen for six straight days, climbing 1.9% during that time.
US nonfarm payrolls for July were softer than expected at 73 thousand, compared to the forecast of 110 thousand. The June report was revised sharply downwards to 14 thousand from an initial 147 thousand.
Canada's GDP posted a small decline of 0.1% m/m in May, matching the market estimate. This followed an identical reading in April, as the economy is essentially treading water. A drop in retail trade was a significant factor in the weak GDP reading, particularly in motor vehicles and parts.
The decline in GDP in April and May can be squarely blamed on the trade war with the US, which has put a chill in economic activity. The markets are expecting a slight improvement in June, with an estimate of a 0.1% gain.
The Bank of Canada held the benchmark rate at 2.75% on Thursday for a third consecutive meeting. The rate statement noted that US trade policy remains "unpredictable" and Governor Macklem reiterated this at his press conference, saying that "some level of uncertainty will continue" until the US and Canada reach a trade agreement.
Meanwhile, the trade war between the two sides is heating up. President Trump announced on Thursday that the US was slapping 35% tariffs on Canadian products, effective Aug. 1. The new tariff will not apply to goods covered under the US-Mexico-Canada Agreement.
Canada's Prime Minister Mark Carney said he was "disappointed" with the US decision and vowed that "Canadians will be our own best customer". These are brave words, but Carney will be under pressure to reach a deal with the US, as 75% of Canadian exports are shipped to the US and Canada can ill-afford a protracted trade war with its giant southern neighbor.
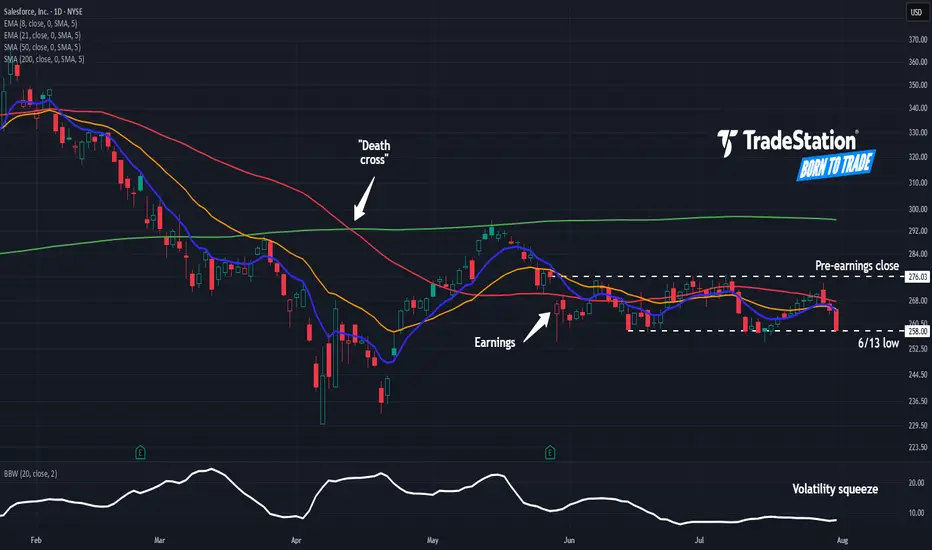
Salesforce May Face DistributionSalesforce has limped as other tech stocks hit new highs, and some traders may think it’s going into distribution.
The first pattern on today’s chart is the bearish price gap on May 29 despite better-than-expected quarterly results. That may reflect waning enthusiasm about the software company’s fundamentals.
Second is the pre-earnings closing price of $276.03. CRM has remained trapped below that level, which may suggest it’s become resistance.
Third is the June 13 low of $258. The stock bounced there in mid-July but may now be at risk of breaking it.
Next, Bollinger Bandwidth has narrowed as the stock formed a tight range between the two levels. Could price movement expand following that period of compression?
Last, the 50-day simple moving average (SMA) had a “death cross” below the 200-day SMA in April. The 8-day exponential moving average (EMA) is also below the 21-day EMA. Those patterns may be consistent with bearishness in the long and short terms.
TradeStation has, for decades, advanced the trading industry, providing access to stocks, options and futures. If you're born to trade, we could be for you. See our Overview for more.
Past performance, whether actual or indicated by historical tests of strategies, is no guarantee of future performance or success. There is a possibility that you may sustain a loss equal to or greater than your entire investment regardless of which asset class you trade (equities, options or futures); therefore, you should not invest or risk money that you cannot afford to lose. Online trading is not suitable for all investors. View the document titled Characteristics and Risks of Standardized Options at www.TradeStation.com . Before trading any asset class, customers must read the relevant risk disclosure statements on www.TradeStation.com . System access and trade placement and execution may be delayed or fail due to market volatility and volume, quote delays, system and software errors, Internet traffic, outages and other factors.
Securities and futures trading is offered to self-directed customers by TradeStation Securities, Inc., a broker-dealer registered with the Securities and Exchange Commission and a futures commission merchant licensed with the Commodity Futures Trading Commission). TradeStation Securities is a member of the Financial Industry Regulatory Authority, the National Futures Association, and a number of exchanges.
TradeStation Securities, Inc. and TradeStation Technologies, Inc. are each wholly owned subsidiaries of TradeStation Group, Inc., both operating, and providing products and services, under the TradeStation brand and trademark. When applying for, or purchasing, accounts, subscriptions, products and services, it is important that you know which company you will be dealing with. Visit www.TradeStation.com for further important information explaining what this means.
Meme Coin Liquidity Trap📣 Hey CandleCraft fam, remember this one?
We nailed the previous BONK long — while it didn’t tag the absolute top, it delivered us a clean, sharp profit right out of the gate. Now? The story has flipped. Meme energy is fading, funding flipped, and the structure’s screaming reversal. Let’s see how this short idea plays out. 🐶💨
The dog barked loud — BONK went full meme mode with a 203% pump… but now it’s giving off that “walk of shame” energy. 🐶 RSI tanked, funding flipped, and it’s bleeding liquidity. Who let the dogs out? Probably market makers.
🔥 TRADE SETUP
Bias: Short
Strategy: Meme Coin Liquidity Trap
Entry: $0.0000355 – $0.0000370
SL: $0.0000400
TPs: $0.000030, $0.000025, $0.000020
Why?
– Overextended meme coin pullback
– Funding rate negative = longs bleeding
– OI down 35%, RSI from 85 → sub-50
– Price hovering under 20-day EMA support
Candle Craft | Signal. Structure. Execution.

BITCOIN's Situation (1h) !!!The price is within an ascending triangle, which could be encouraging. However, since crypto doesn't always follow patterns, it might break down from below and correct to around $116K!
Best regards CobraVanguard.💚

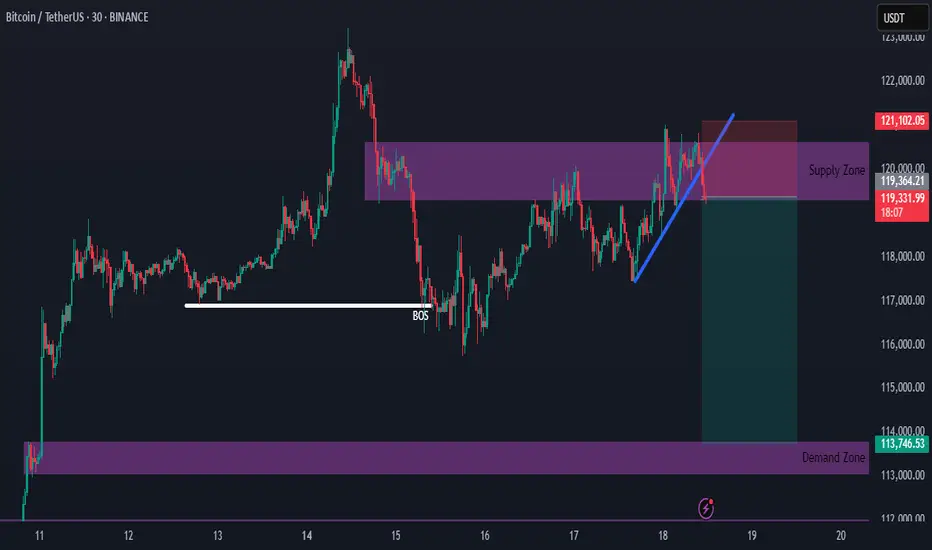
Bitcoin Supply Zone Intact — New Short Setup DevelopingHello everybody!
The supply zone we discussed in the previous idea is still holding.
We have a new opportunity to go short upon the break of the upward trendline.
The most likely target is around 114,000.
Bitcoin Bull Flag - will it collapse?Bitcoin is currently in a bull flag.
Will it hold — or collapse?
The weekly close will decide.
🔹 If BTC closes above the bull flag support: Possible continuation of the rally.
🔻 If BTC closes below the flag: Expect a deeper correction.
Stay sharp. The weekly close is key IMO.
No FA. DYOR! For educational purpose only.

US500 SP500 Sell the news- ShortHello fellow traders, what do you think? Am I predicting FUTURE? This is my early entry, cautious, but holding steady, checking from time to time but general rule- what went up will eventually fall. The price is just a Wave of coincidance and events, trade carefully! Protect capital! don't copy my idea it's an idea NOT A TRADING ADVISE
