GBPJPY is in the Down Trend From Resistance LevelHello Traders
In This Chart GBPJPY HOURLY Forex Forecast By FOREX PLANET
today GBPJPY analysis 👆
🟢This Chart includes_ (GBPJPY market update)
🟢What is The Next Opportunity on GBPJPY Market
🟢how to Enter to the Valid Entry With Assurance Profit
This CHART is For Trader's that Want to Improve Their Technical Analysis Skills and Their Trading By Understanding How To Analyze The Market Using Multiple Timeframes and Understanding The Bigger Picture on the Charts
Trend Analysis

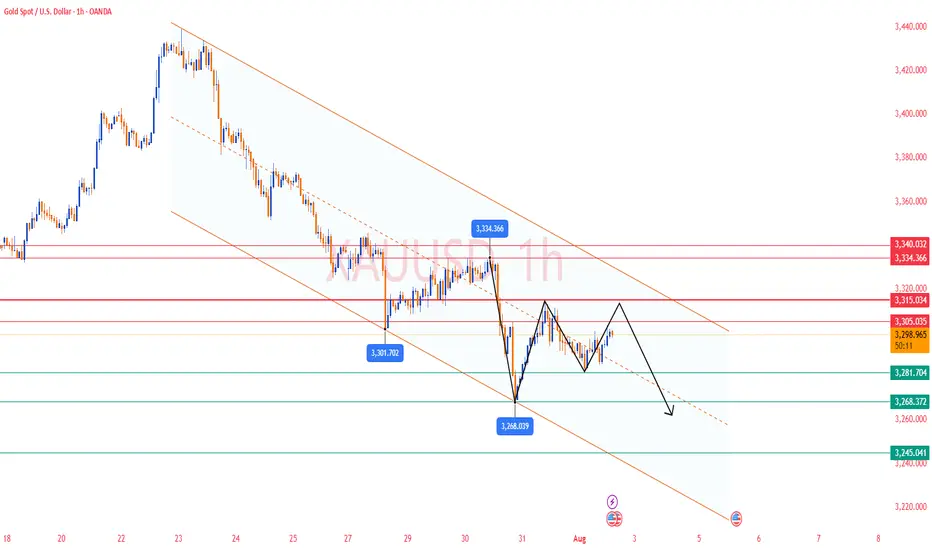
Gold Analysis and Trading Strategy | August 1✅ Fundamental Analysis
🔹 Trump Signs New Tariff Executive Order
On July 31, President Trump signed an executive order imposing a new round of tariffs on countries including Canada and India, while Mexico was granted a 90-day grace period. This move has once again heightened global trade uncertainty, fueling risk-off sentiment and providing support to gold.
🔹 Dollar Strength Limits Gold's Upside
Despite the increase in risk aversion, the U.S. Dollar Index has risen sharply, exerting downside pressure on gold. As a result, the price of gold remains capped, with a tug-of-war between bulls and bears dominating market dynamics.
🔹 Key U.S. Economic Data in Focus
The U.S. Non-Farm Payrolls (NFP) report is the major event on the calendar today. It is expected to be a decisive driver for short-term gold direction:
If the data is bullish for gold (e.g., weak job growth or slower wage increases), gold may retest the 3340 level.
If the data is bearish for gold (e.g., strong job gains or higher wages), gold may break below 3260, continuing its downward trend.
Ahead of the data release, gold is likely to remain in a consolidation range, with market participants generally adopting a cautious stance.
✅ Technical Analysis
🔸 Daily Chart Structure:
Gold printed a gravestone doji yesterday, characterized by a long upper shadow, indicating strong selling pressure at higher levels. The overall trend remains weak. After four consecutive daily declines followed by a minor rebound, another strong bearish candle has emerged, signaling a continuation of the downtrend.
🔸 Hourly Chart Structure:
On the 1-hour timeframe, gold remains below all major moving averages, which are aligned in a bearish formation. Despite multiple rebound attempts, each high has been lower than the last, reflecting diminishing bullish strength. The second U.S. session high was capped around 3310. If today's rebound fails to break above that level, the bearish trend remains dominant.
🔴 Resistance Levels: 3305 / 3315 / 3340
🟢 Support Levels: 3275 / 3260 / 3245
✅ Trading Strategy Reference:
🔻 Short Position Strategy:
🔰Consider entering short positions in batches if gold rebounds to the 3305-3310 area. Target: 3285-3270;If support breaks, the move may extend to 3250.
🔺 Long Position Strategy:
🔰Consider entering long positions in batches if gold pulls back to the 3245-3250 area. Target: 3265-3275;If resistance breaks, the move may extend to 3285.
🔥Trading Reminder: Trading strategies are time-sensitive, and market conditions can change rapidly. Please adjust your trading plan based on real-time market conditions. If you have any questions or need one-on-one guidance, feel free to contact me🤝
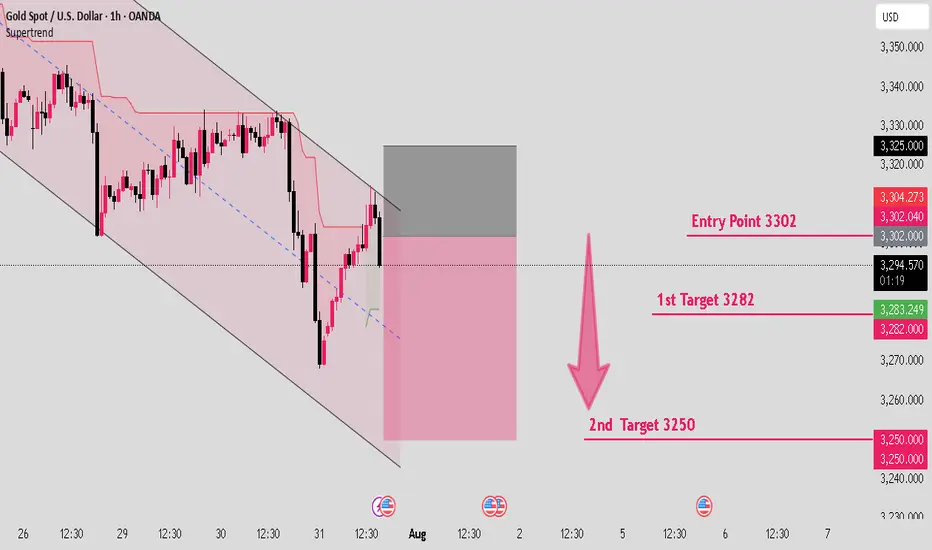
Gold is creating a downward structure in parallel channel.Hello IGT FOLLOWERS
Here is my gold overview, According to me gold will fall because it is continously working in a downward parallel channel.. Bearish momentum visible on lower timeframes (1H-4H) • Price Structure: Recently rejected from $3,320-$3,325 resistance zone Forming lower highs and lower lows- suggesting short-term downtrend continuation..
Key points :
Entry point : 3302
1st Target : 3282
2nd Target : 3250
Follow me for more latest updates and signals
SUPER BUY GOLD XAUUSD Gold has ripped all levels of take profit and has gone up and gave us a small amount of drawdown with huge gains in return, simple trading price action and (M&Ws)

GBPUSD: Selling the Retest | Clean Break, Wait for Confirmation🔻 GBPUSD | Sell the Retest of Broken Support
Timeframe: 1H
Bias: Bearish
Type: Break and Retest
📊 Technical Setup
GBPUSD has broken a key 4H support zone (~1.3460–1.3494) which now acts as a turncoat resistance. Price is currently pulling back, offering a prime opportunity to sell the retest.
• Entry: 1.3460–1.3490 (after confirmation of rejection)
• SL: Above 1.3508
• TP: 1.3398
• RR: ~1:2
• RSI: Bearish momentum, RSI < 50 with mild recovery—ideal for a fade trade
📉 Macro & Fundamental Confluence
• GBP: Despite hawkish BOE tone, GBP is showing technical weakness and soft CFTC positioning
• USD: Strong macro bias with rising conditional score and delayed Fed cuts (still supporting USD strength)
• Seasonal Bias: GBPUSD marked bearish in seasonal chart
• COT Data: GBP positioning turning bearish after previous net build-up
🧭 Gameplan
“Wait for the retest of broken support-turned-resistance to reject before entering short. Stick to the zone.”
🔔 Set alerts around 1.3460–1.3490 and monitor for bearish engulfing or pinbar confirmation.
AVAXUSD at Support ? recent brok the resistanceAVAX has recently broken the Support and is likely to reverse from this support area let us see.

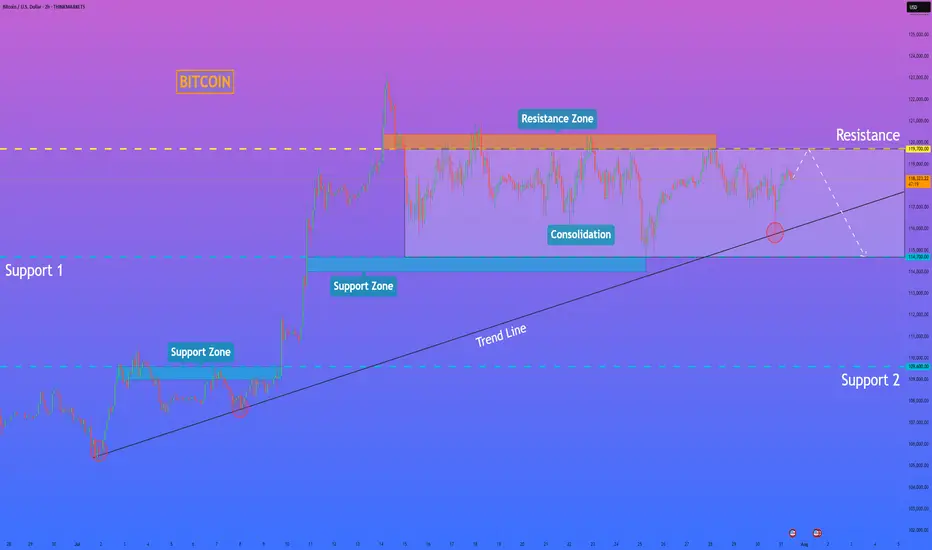
HelenP. I Bitcoin will rebound down from resistance levelHi folks today I'm prepared for you Bitcoin analytics. A technical review of the chart reveals a prolonged period of horizontal consolidation, during which the price has been trading within a well-defined range between support at 114700 and resistance near 119700. This phase of balance follows a significant prior uptrend, and a major ascending trend line is currently intersecting this range. My analysis for a short position is based on the expectation of a final 'test and fail' at the top of this consolidation. I believe the price will make one more attempt to rally towards the resistance zone around 119700. A strong rejection from this area, demonstrating sellers' control, would serve as the main confirmation for a bearish bias. Such a rejection would likely initiate a powerful downward move across the range, with sufficient momentum to break the critical ascending trend line. This would be a significant structural event, signaling a potential reversal of the larger trend. Therefore, the primary goal for this scenario is logically set at the 114700 support level, the bottom of the consolidation range. If you like my analytics you may support me with your like/comment ❤️
Disclaimer: As part of ThinkMarkets’ Influencer Program, I am sponsored to share and publish their charts in my analysis.
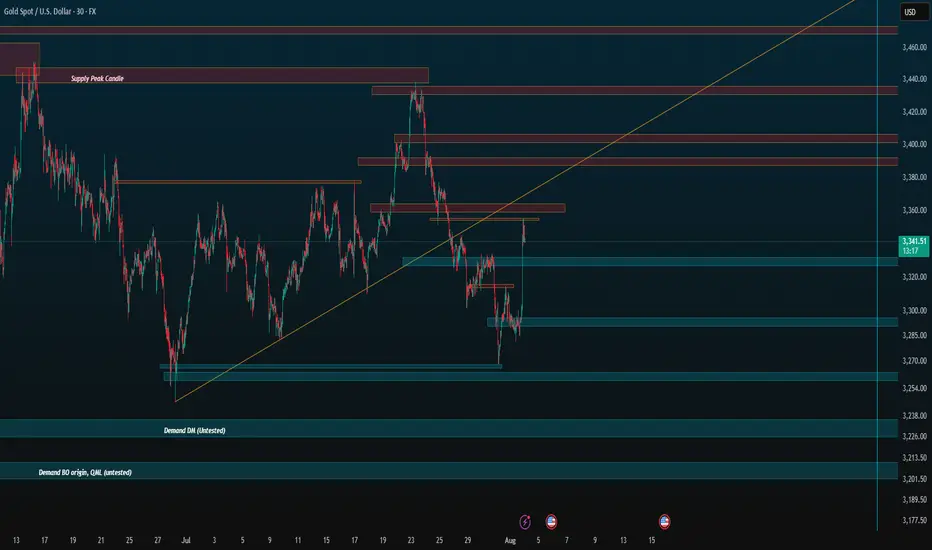
GOLD CONTINUATION PATTERNHello folks, here we go again, This idea stuck in my head only today and its friday. rather shared it or none, but see the charts for stops and target. this might be your lucky day on my page.
Here is my idea, take it if you love to swing or watch it fade. Congrats were on 800 community or I got more followers because of this. and Previous idea we made a lot thats 1200 pips good for a month trade. lets see this August. my target is labeled this chart first at 3500 zone. next target will be posted on my notes or updated the idea. no charts until it breaks that labeled on chart. until it goes higher again.
You will never see this kind of idea for a month again. So follow on my page, I have some for you if you have small accounts.d m here
My goal is to target the highest TP will be above this new highs.

Zones for the rest of August (if no ATH)Just simple zones, ignore. I want to compare to the end of the month later.
Keep trading simple. These are the zones I made after drawing from 4H all the way to 5 minute candle for precision. I already have my own speculation but feel free to use it for your own.
Goodbye, trade safe.
How to accurately grasp the gold trading opportunitiesGold was greatly affected by the positive non-farm payroll data, and it rose strongly, with the increase completely covering all the losses this week. The current gold trend has completely reversed the previous bull-short balance. After breaking through the 3300 level and rising to around 3355, it maintains strong upward momentum, and the possibility of further testing the 3360-3375 area cannot be ruled out. Due to the strong positive data, if everyone fails to chase the long position or set a breakout long position in time in the first wave of the market, the subsequent pullback opportunities may be relatively limited, so it is necessary to maintain an active strategy in operation. It is recommended to continue to be bullish when it retreats to the 3335-3320 area, and the upper target is the 3360-3375 pressure range.
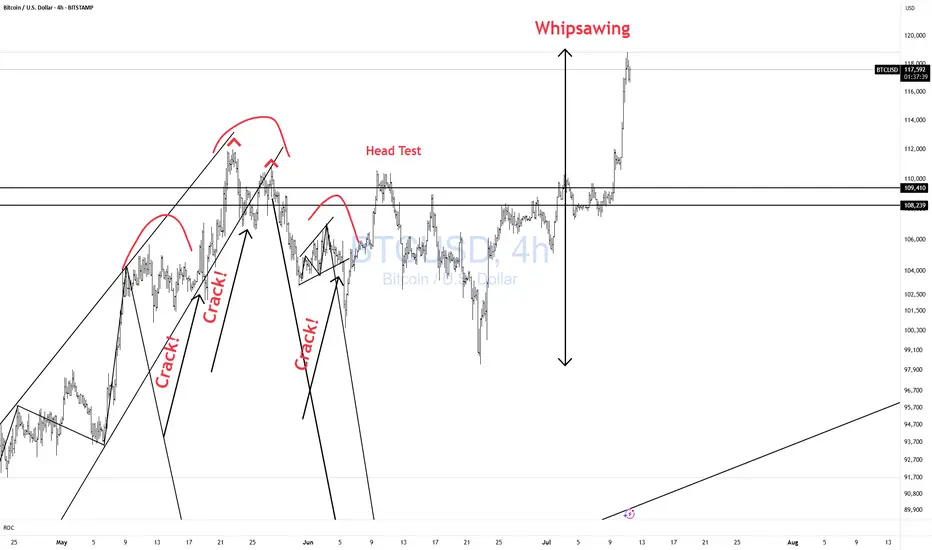
BTCUSD Whipsawing! CAUTION!Bulls CAUTION! Price is whipsawing all over the place.
Better to be out of the market wishing you were in than in wishing you were out!! Don't chase!!
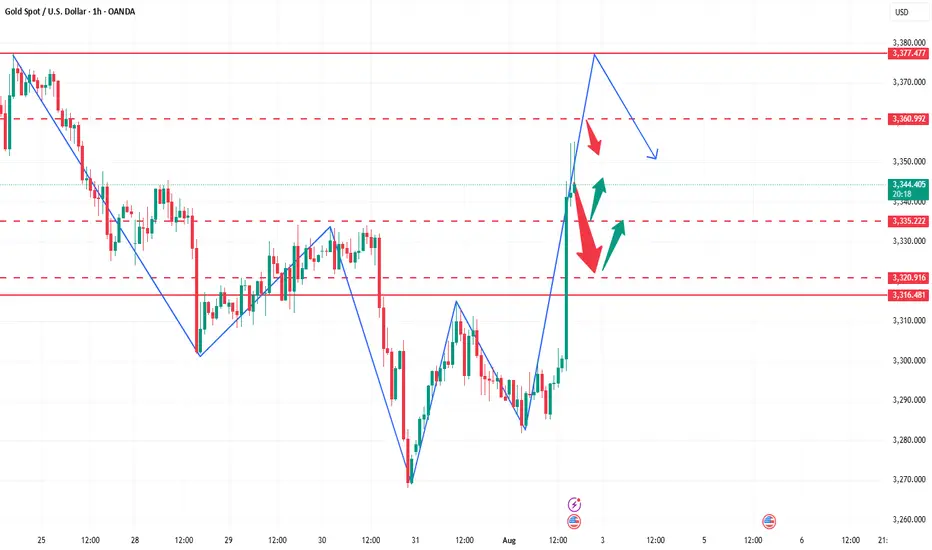
The idea of shorting on rallies below 3315 remains unchanged.Gold remains generally weak, with multiple rebounds showing signs of fatigue. The upward moving average continues to suppress prices, indicating that the bearish trend remains intact, and the short-term market outlook remains bearish. Trading strategies remain bearish today, with a key focus on the 3300-3315 area, a key short-term resistance zone. If the market rebounds before the US market opens and approaches this area, or if a clear topping signal appears near this range, consider entering a short position. Today will see the release of the non-farm payroll data, which may influence the market's trajectory. We recommend prioritizing short-term trading before the release, and reconsidering the market's direction based on market feedback after the release. Structurally, gold continues to exhibit a volatile downward trend, with lower highs and lower lows. Today's low is expected to be lower than yesterday's. Short-term short positions are focused on 3285-3280, with a break below this level potentially allowing for further declines. Please carefully time your entry, strictly implement risk management, and avoid emotional trading.
NATF – SECOND STRIKE | 01 AUGUST 2025 NATF – SECOND STRIKE | 01 AUGUST 2025
The stock is standing in an upward channel (marked light blue) and recently hit a high of Rs. 383. A healthy pullback followed, consolidating near the axis line, and briefly dipped below it as a spring. Today’s strong rebound confirms the pullback is likely over, signaling a second strike opportunity for continuation towards higher quantified targets.

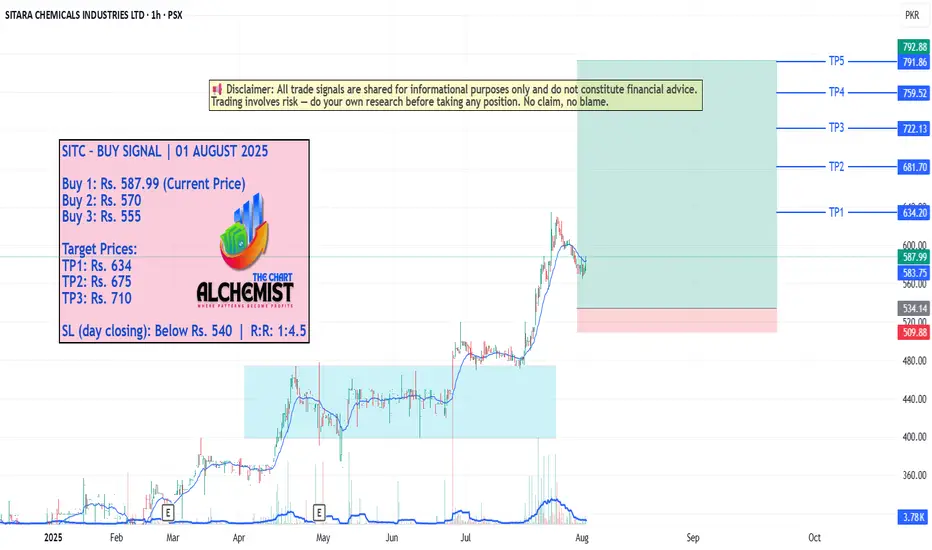
SITC – BUY SIGNAL | 01 AUGUST 2025 SITC – BUY SIGNAL | 01 AUGUST 2025
The stock previously broke out of a trading range (marked light blue channel) and marked a high of Rs. 634. After a shallow pullback to Rs. 478, it spiked upwards again, creating multiple bullish structures. Recently, it rebounded from a key bullish structure and is now entering a new upward leg with good momentum. Quantified displacement targets lie ahead.
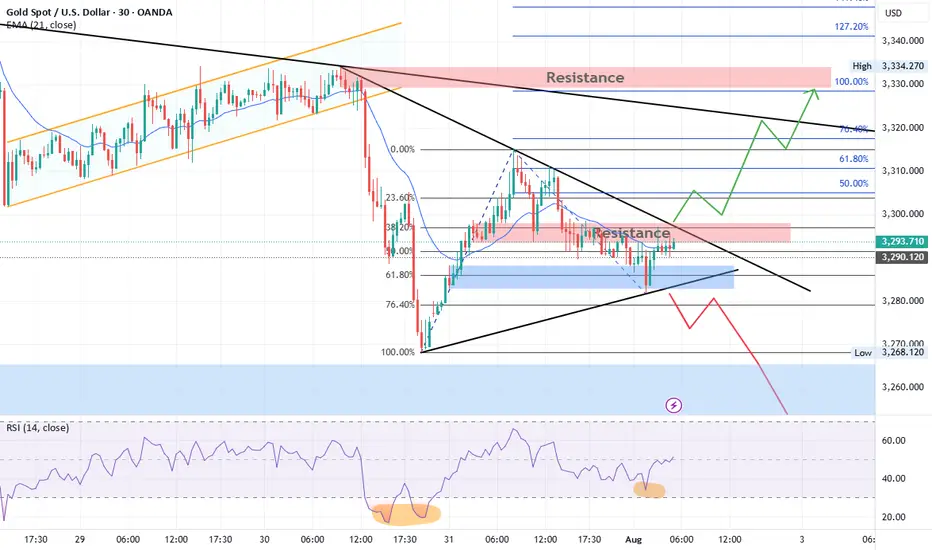
Gold Technical Outlook
Gold is currently consolidating inside a triangle pattern. After a recent bullish rally, price retraced between the 61.8% – 76.4% Fibonacci levels, finding support and bouncing upward. At present, gold is facing resistance at both the falling trendline and the 3298–3300 zone.
Bullish Scenario:
A breakout above the resistance trendline and the 3298–3300 zone could trigger a strong bullish move toward 3311, 3322, and 3333. A sustained break above 3333 would confirm a short-term bullish trend, opening the way for higher targets at 3360 and 3400.
Bearish Scenario:
If price faces rejection from the 3300 resistance and the falling trendline, gold is expected to move lower, retesting 3270. A decisive break below 3270 may extend the decline toward 3250. If 3250 is broken, gold could enter strong bearish momentum, potentially shifting the long-term trend to the downside with targets at 3000 and 2850.
OANDA:XAUUSD Gold Technical Outlook
HBARSimiliar scenario to BYBIT:BTCUSDT.P just have to wait for the daily close.
I marked out a potential entry are with the red line, which is a 4H order block which COULD be tapped
Again I will update you on my entry ASAP
Do not forget to follow and like, it helps me alot.
Stay blessed

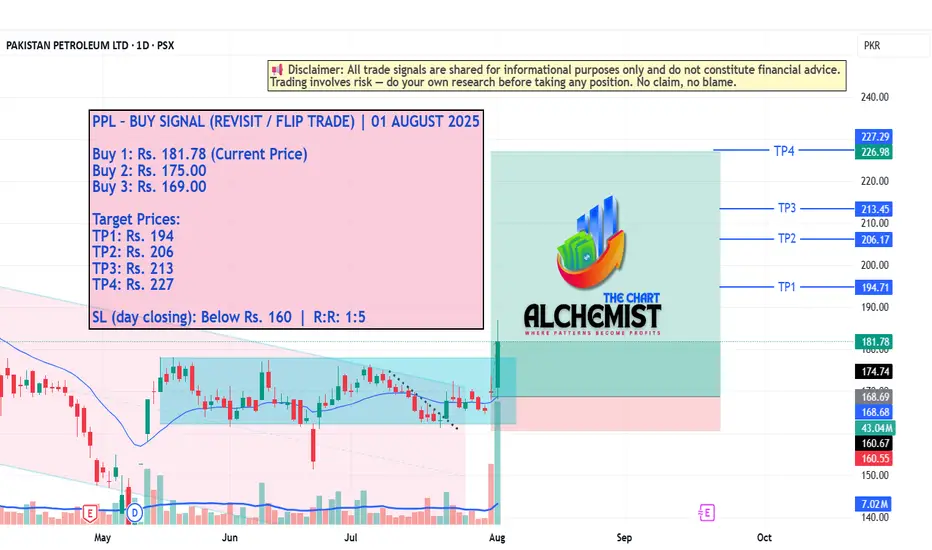
PPL – BUY SIGNAL (REVISIT / FLIP TRADE) | 01 AUGUST 2025 PPL – BUY SIGNAL (REVISIT / FLIP TRADE) | 01 AUGUST 2025
The stock has recently been moving within a bearish channel (marked light pink), which structurally qualifies as a bull flag. A decisive breakout from this flag has now occurred, followed by the formation of a strong bullish structure. This confirms upward momentum and provides solid structural support for a sustained rally.
ENTRY USDCADDisclaimer:
This is merely a chart-based analytical trading idea and is not considered investment advice. Please manage your risks carefully and conduct your own research before making any trading decisions.

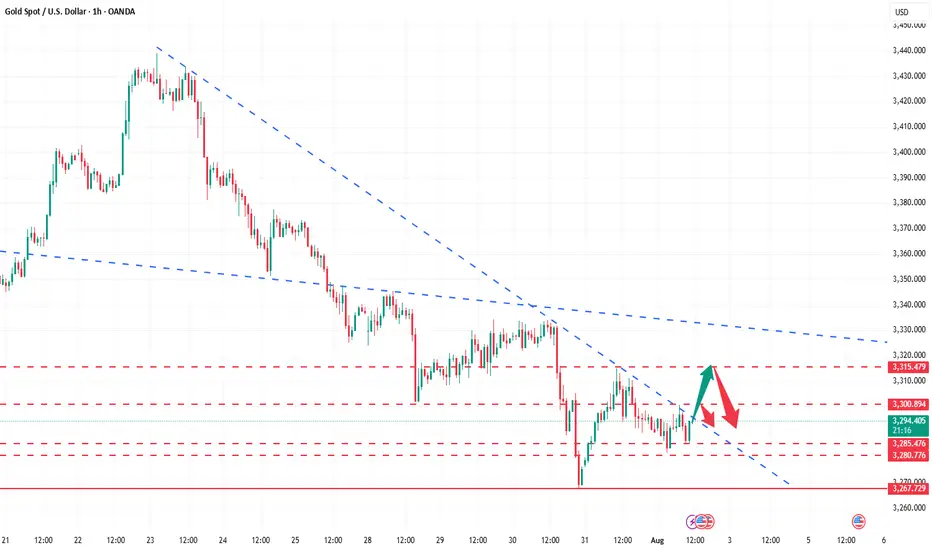
Trend decision after the newsAfter the news, the price nearly reached the bottom of the higher time frame channel and paused. We need to see whether the price can break into the channel or not. Personally, I don’t think that will happen. I believe a range will form within the marked zone, and then the price will drop further.
KSE 100 Technical Analysis | 01 AUGUST 2025 (corrected)KSE 100 Technical Analysis | 01 AUGUST 2025
The KSE 100 index is moving in a textbook bullish pattern, having recently completed a trading range marked by a horizontal channel in light blue. This pattern has provided a strong base for the index's renewed uptrend. We expect the index to be more stable and stronger than in recent days.
Key Levels
- *Immediate Support*: 140300
- *New Immediate Target*: 142840
Current Trend
- The index is highly bullish and always in an uptrend, with multiple strong supports in place.
Expectation
- The index is expected to continue its upward movement, driven by its strong bullish pattern and support levels.

Silver XAGUSD is forming a bullish IB pattern The market of silver XAGUSD is in Up trend
it formed a correction wave
near the previous levels of multi bullish price action between 36 and 36,30
this market is forming an IB pattern
buy stop order must be place at the HH of the MB at the price 37.35
SL 36
TP 39

Daily Bitcoin AnalysisBitcoin is at support at $115,000. Personally, I think this support will not hold and it will reach the next level of 112,000. Why? Because the downward momentum of the price is high.
This is not financial advice

XAU/USD GOLD NFP DIRECTIONThis chart analysis is for XAU/USD (Gold vs. U.S. Dollar) on the 4-hour timeframe. The focus is on a bearish market structure, highlighting potential Price of Interest (POI) zones for a short (sell) setup.
Key Elements:
Market Structure: Clear downtrend with lower highs and lower lows.
POIs Identified:
Optional POI: An initial supply zone where price might react.
Extreme POI: A more significant supply zone marked for a stronger potential reversal.
Labels & Notes:
The price levels are marked between 3,320 – 3,340, showing where the reversal is expected.
Interpretation:
The chart anticipates a retracement upward into the POIs before continuing the bearish move. Traders may look to enter short positions around these zones, especially the Extreme POI, which is seen as a high-probability reversal area.
