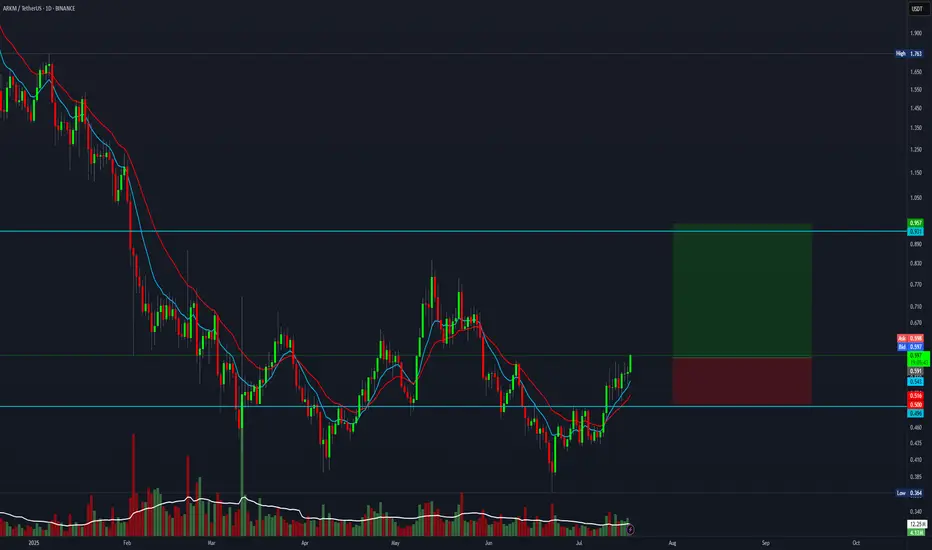
4:1 R:R trade setup for ARKMEverything is pumping right now, and this one also offers a 4:1 R:R setup.
Entry: 0.596
Stop Loss: 0.500
Target: 0.950
Trend Analysis
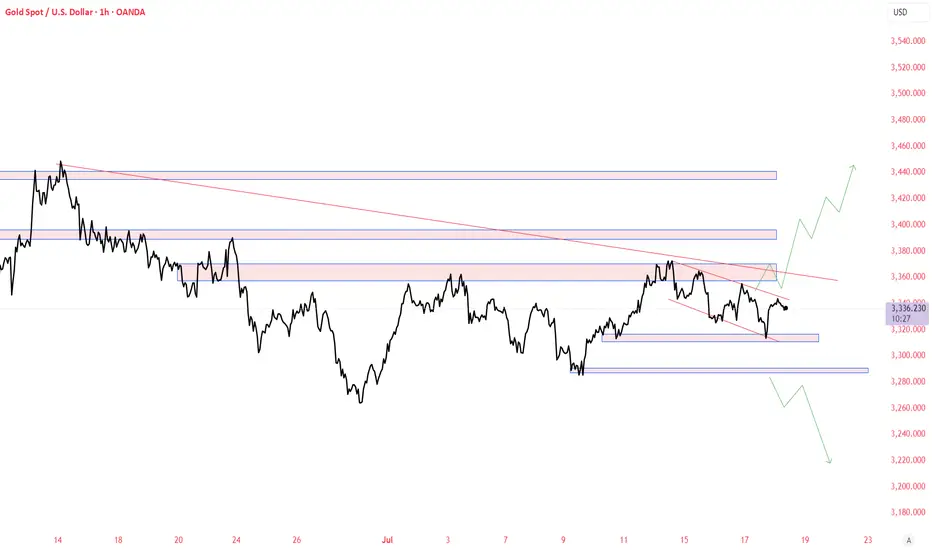
XAUUSD - Falling Wedge Parallel ChannelGold Volatility being more. Banks increasing the gold inventories, may surge to new highs. Sharing Some idea it may go either way some big rally or big correction.
This chart is only for educational purpose, Do your own study before taking any trades
USDJPY INTRADY OPPORTUNITY Hello traders , here is the full multi time frame analysis for this pair, let me know in the comment section below if you have any questions , the entry will be taken only if all rules of the strategies will be satisfied. wait for more price action to develop before taking any position. I suggest you keep this pair on your watchlist and see if the rules of your strategy are satisfied.
🧠💡 Share your unique analysis, thoughts, and ideas in the comments section below. I'm excited to hear your perspective on this pair .
💭🔍 Don't hesitate to comment if you have any questions or queries regarding this analysis.

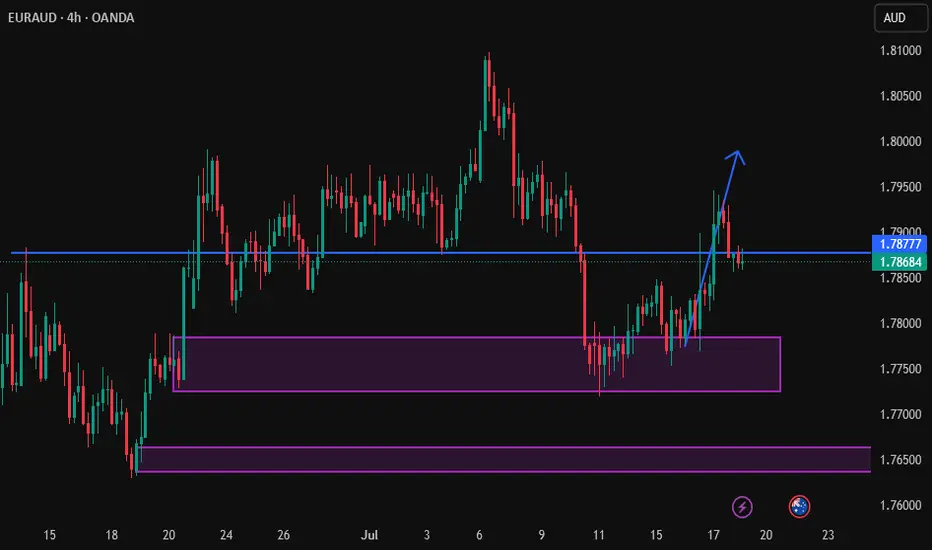
EURAUDThe price just tapped into a valid order block.
This suggests a potential long (buy) opportunity.
We may see bullish momentum from this zone.
Watch for confirmation like bullish engulfing or BOS or CHOCH.
Place stop loss just below the order block.
Target the next resistance or liquidity zone.
Wait for entry confirmation on lower timeframe.
[INTRADAY] #BANKNIFTY PE & CE Levels(18/07/2025)Bank Nifty is expected to open flat around the 56800 zone, suggesting indecision in the early session. If it manages to move upward and sustain above the 57050–57100 resistance range, it could invite bullish momentum targeting 57250, 57350, and even 57450+. A breakout above this level can trigger a continuation of upward movement, but volume and price confirmation are essential.
On the downside, if the index stays weak and slips below the 56950–56900 zone, we may see fresh bearish pressure pulling it toward 56750, 56650, and 56550 support levels. This zone remains a crucial intraday pivot for traders to watch.
A reversal opportunity may also emerge if the index drops further near 56550–56600 and then shows a sharp recovery. In such a case, targets of 56750, 56850, and 56950+ are possible, making it a good support-based bounce trade. Overall, the market might remain sideways with both opportunities for quick scalps and reversals—focus on key levels and act with strict stop losses.

July 18, 2025 - XAUUSD GOLD Analysis and Potential Opportunity🔍 Key Levels to Watch:
• 3375 – Top of range
• 3366 – Resistance
• 3358 – Resistance
• 3350 – Midpoint
• 3345 – Resistance
• 3336 – Support
• 3330–3332 – Support zone
• 3320 – Intraday key support
• 3310 – Key support
• 3300 – Psychological level
📈 Intraday Strategy:
• SELL if price breaks below 3336 → target 3332, then 3330, 3325, 3320
• BUY if price holds above 3345 → target 3348, then 3352, 3358, 3366
👉 If you find this helpful or traded using this plan, a like would mean a lot and keep me motivated. Thanks for the support!
Disclaimer: This is my personal opinion, not financial advice. Always trade with proper risk management.

BTC intra?
Hi
Do you know?
www.investopedia.com
If your initial plan is BUY.. whatever reasons: Fundamental/ outlook buy
We'll take this trade; reason
Two Yeses : Outlook BUY Pattern BUY
How will it react?
Answer: I don't know
High probability : Yes
Where do you enter? Your preference
wait retrace or now... just
If you wait.. might not get the ticket
If calculate between entry and stop loss: pips
And divide by what you re risking in $ to pips
All the best

GOLD FRENZY *I am in no way a financial advisor and you should always do your own due diligence before placing any trade. Do not trade what you are not comfortable with losing. No trade is guaranteed.
SELL Gold
SL 3399
TP 2972

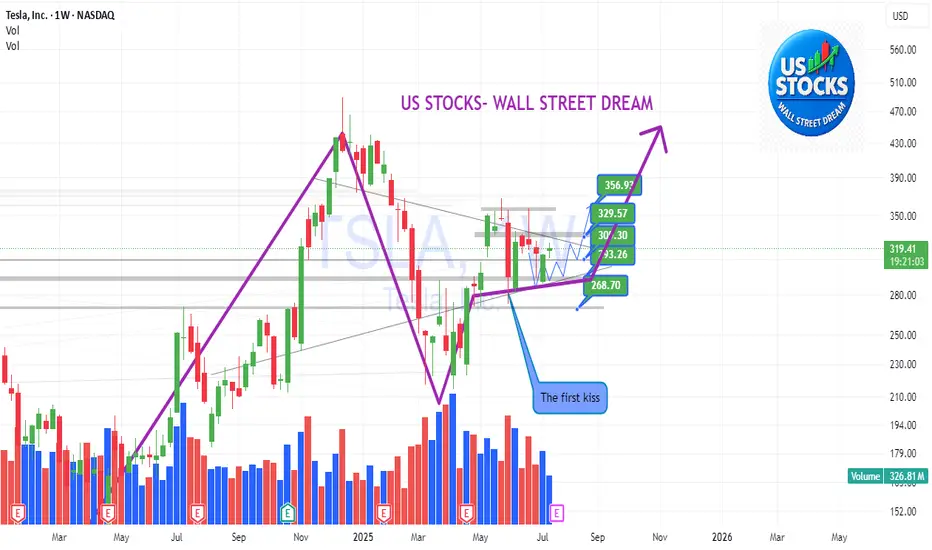
TSLA: Anyone knows this pattern?TSLA:
Anyone knows this pattern?
Think contrarily to the market — seek opportunities in things that few people notice or pay attention to, and when you do, opportunities will come to you earlier than they do to the crowd.
.
US STOCKS- WALL STREET DREAM- LET'S THE MARKET SPEAK!
CRCL Right-side base forming post-IPO. Volume supporting accumCRCL – Circle Internet Financial (IPO)
Setup Grade: A
• Entry: $235.84 (7/17)
• Status: Active
• Trailing Stop: $183.85 (2x ATR)
• Setup: Right-side base forming post-IPO. Volume supporting right-side structure. Higher high after higher low. Sector: blockchain/stablecoins.
• Plan: Add on breakout over ATH $98.99. Hold with strict trailing stop discipline.

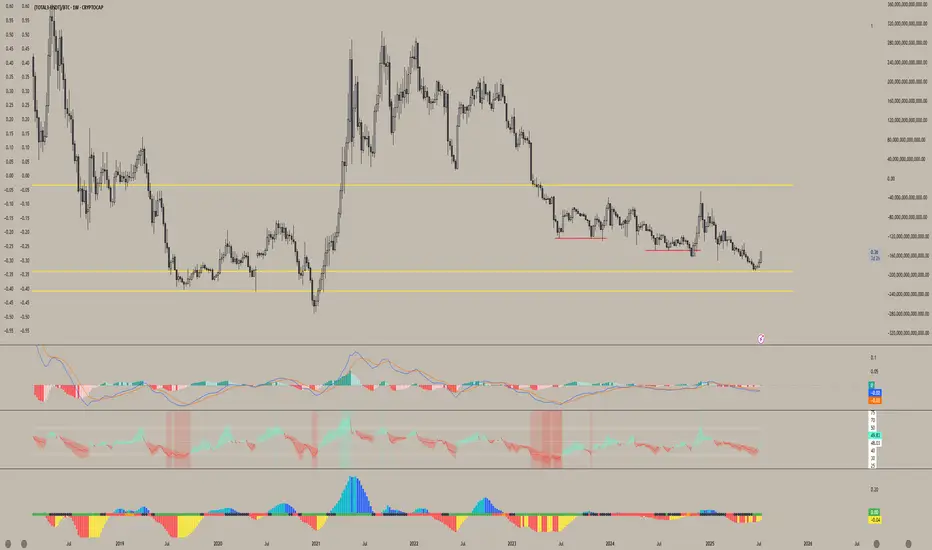
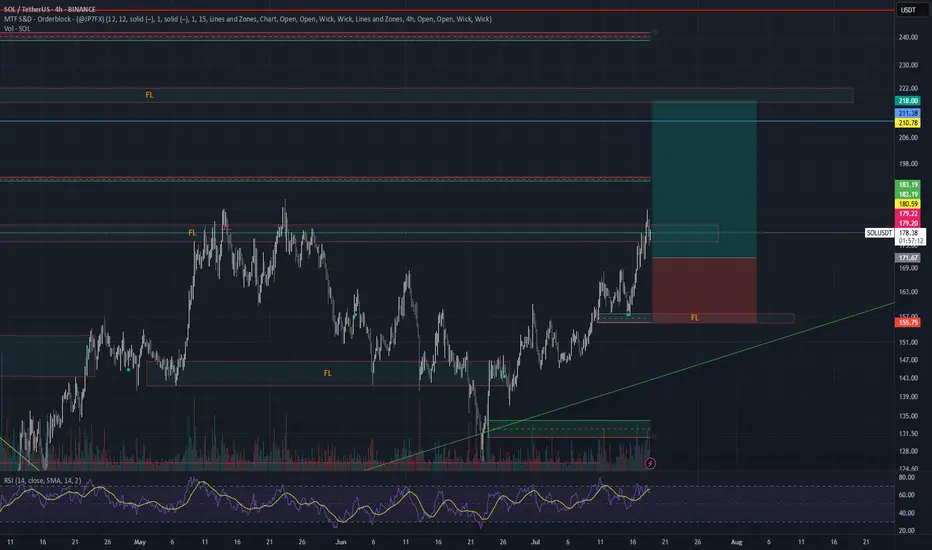
Altcoin Market Structure Outlook | ETH/BTC Rotation AnalysisThis chart outlines a cyclical framework I'm using to anticipate a potential bottom in altcoins heading into Q4. Currently, ETH is outperforming BTC, and altcoins are following its momentum - though many continue to make lower lows relative to ETH.D but as long as eth rallies I see Alts keeping up.
Historically, we've seen altcoin capitulation phases follow a two-stage structure: an initial local bottom in June/July, followed by a final sweep or structural low into October (Q4), as observed in both 2023 and 2024. Given this repeating seasonal pattern, I expect ETH to potentially retrace against BTC in Q4 making a higher low, which could set the stage for altcoins to make a lower low and retest their key range lows — particularly near the 0.25 ETH/BTC level.
Should ETH maintain a higher low and resume trend afterward, it would likely mark a rotation point where capital begins flowing into higher-beta altcoins. Coupled with potential macro tailwinds like rate cuts or dovish policy pivots, this scenario could trigger a strong altcoin rally from Q4 into Q1.
This chart aims to visualize that rotational capital flow and position sizing opportunity across the cycle.
Momentum to the buy sideThe S&P 500 daily chart is exhibiting momentum to the buy side with a positive reaction to earnings and economic reports. The next challenge will be a close above 6360 per Friday.

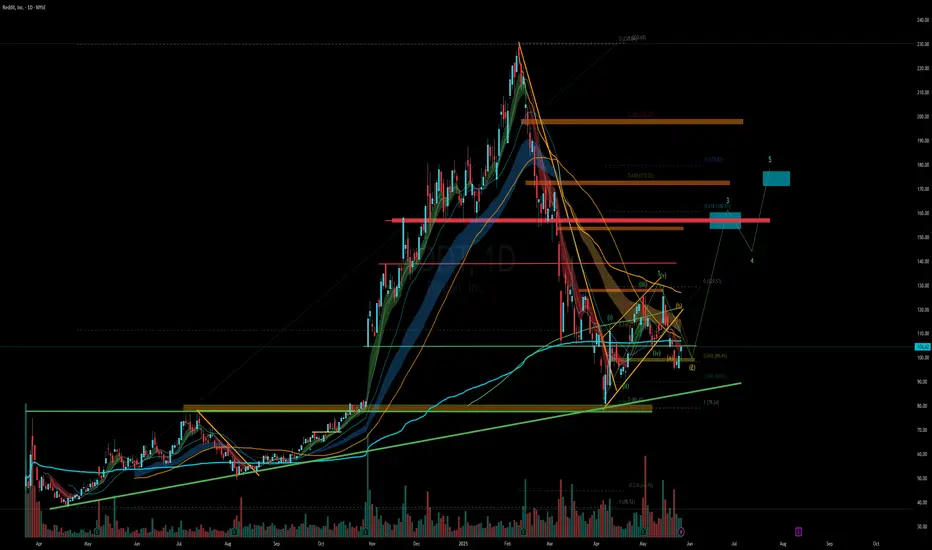
RDDT - Ready for Round 2?RDDT is setting up a base here, let's see if it holds this previous support level around 80.
Target 1 - 160
Target 2 - 180
Stop loss - 75
US100 Strong Bullish Breakout!
HI,Traders !
#US100 is trading in a
Strong uptrend and the
made a bullish breakout
Of the key horizontal level
Of 22879.1 so we are
Bullish biased and we will
Be expecting a further
Bullish move up !
Comment and subscribe to help us grow !

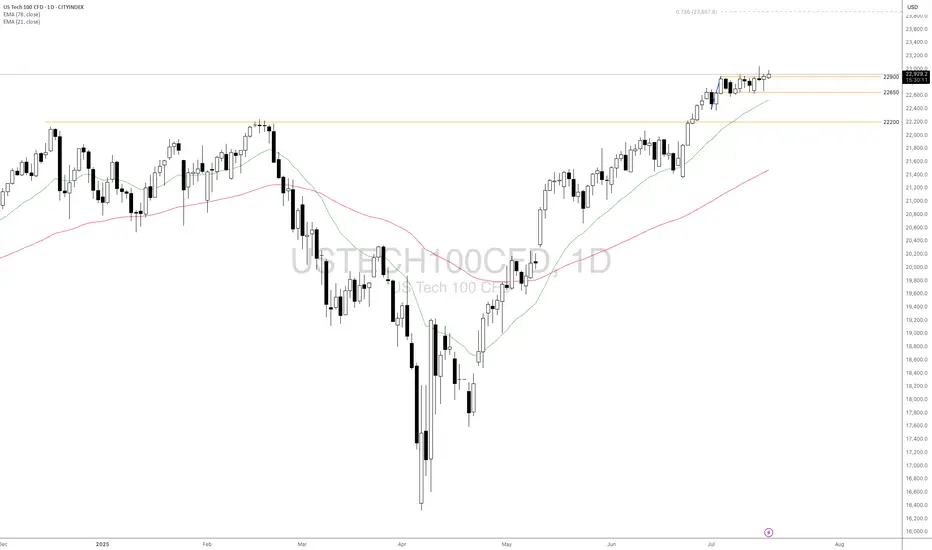
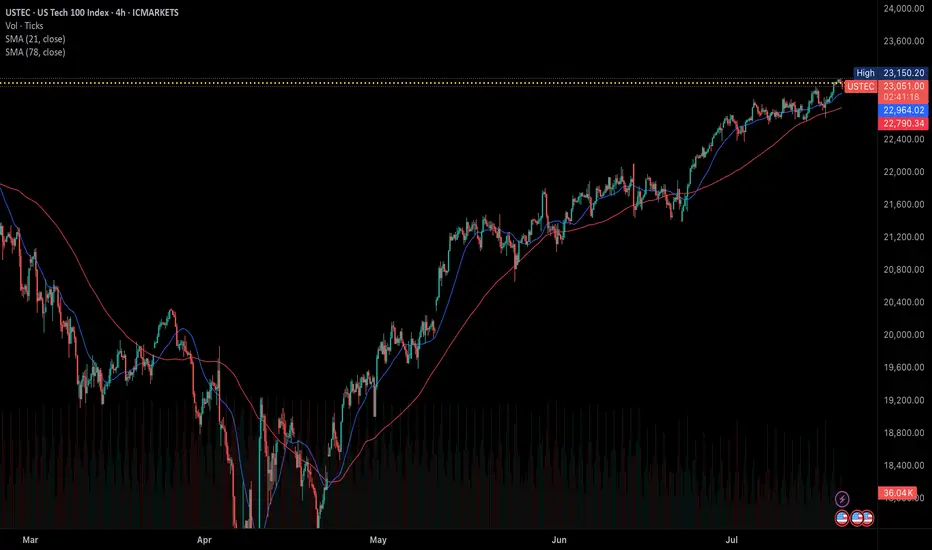
Will USTEC Continue to Climb Amid Key Catalysts Ahead?Fundamental approach:
- USTEC climbed to fresh record highs this week, supported by positive investor sentiment amid consolidation ahead of key catalysts.
- Sentiment was buoyed by expectations of continued AI and semiconductor strength, with Nvidia (NVDA) and Amazon (AMZN) registering gains, while Tesla (TSLA) rebounded on optimism despite recent volatility. However, persistent tariff threats and uncertainty around US trade policy generated caution, with markets jittery as investors eyed incoming earnings reports and inflation data releases for further direction. The term structure in tech remains constructive, with buyers stepping in on minor pullbacks, showing little sign of trend exhaustion.
- USTEC may face heightened volatility as the next round of corporate results and updates on US tariffs could shift sentiment. Upcoming earnings from major tech firms and macroeconomic releases, including key inflation and consumer confidence data, could set the tone for the index's next move.
Technical approach:
- USTEC closed above the range of 22650-22900, and also above both EMAs, indicating a strong upward momentum.
- If USTEC maintains above 22900, it may continue to rise to 78.6% Fibonacci Extension at around 23870.
- On the contrary, closing below 22900 may push the price to retest the previous support at 22650.
Analysis by: Dat Tong, Senior Financial Markets Strategist at Exness
Bearish breakout off major support?EUR/USD is reacting off the support level which is an overlap support that lines up with the 61.8% Fibonacci retracement and a breakout of this level could lead the price to drop from this level to our take profit.
Entry: 1.1587
Why we like it:
There is an overlap support level that lines up with the 61.8% Fibonacci retracement.
Stop loss: 1.1666
Why we like it:
There is an overlap resistance.
Take profit: 1.1451
Why we like it:
There is an overlap support level that lines up with the 61.8% Fibonacci retracement.
Enjoying your TradingView experience? Review us!
Please be advised that the information presented on TradingView is provided to Vantage (‘Vantage Global Limited’, ‘we’) by a third-party provider (‘Everest Fortune Group’). Please be reminded that you are solely responsible for the trading decisions on your account. There is a very high degree of risk involved in trading. Any information and/or content is intended entirely for research, educational and informational purposes only and does not constitute investment or consultation advice or investment strategy. The information is not tailored to the investment needs of any specific person and therefore does not involve a consideration of any of the investment objectives, financial situation or needs of any viewer that may receive it. Kindly also note that past performance is not a reliable indicator of future results. Actual results may differ materially from those anticipated in forward-looking or past performance statements. We assume no liability as to the accuracy or completeness of any of the information and/or content provided herein and the Company cannot be held responsible for any omission, mistake nor for any loss or damage including without limitation to any loss of profit which may arise from reliance on any information supplied by Everest Fortune Group.

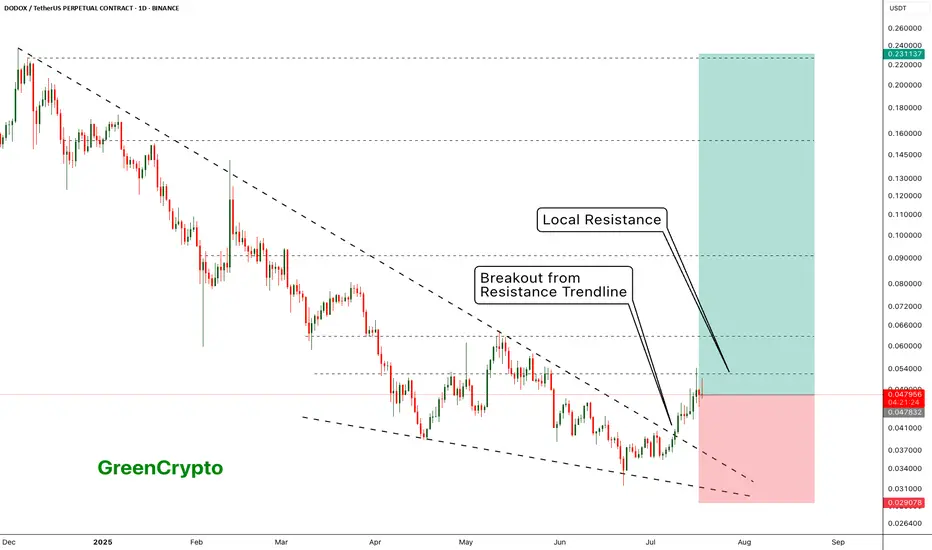
DODOX - Resistance is holding it back - Huge Potential- DODOX has successfully broken out from the resistance trendline
- Now its being pushed back back the weak local resistances
- I see a huge upward potential here.
Entry Price: 0.048271 ( Or you can wait for it breakout from the local resistance of 0.063051)
Stop Loss: 0.029078
TP1: 0.062621
TP2: 0.079766
TP3: 0.103243
TP4: 0.151853
TP5: 0.222332
Max Leverage 5x.
Don't forget to keep stoploss
Cheers!
GreenCrypto
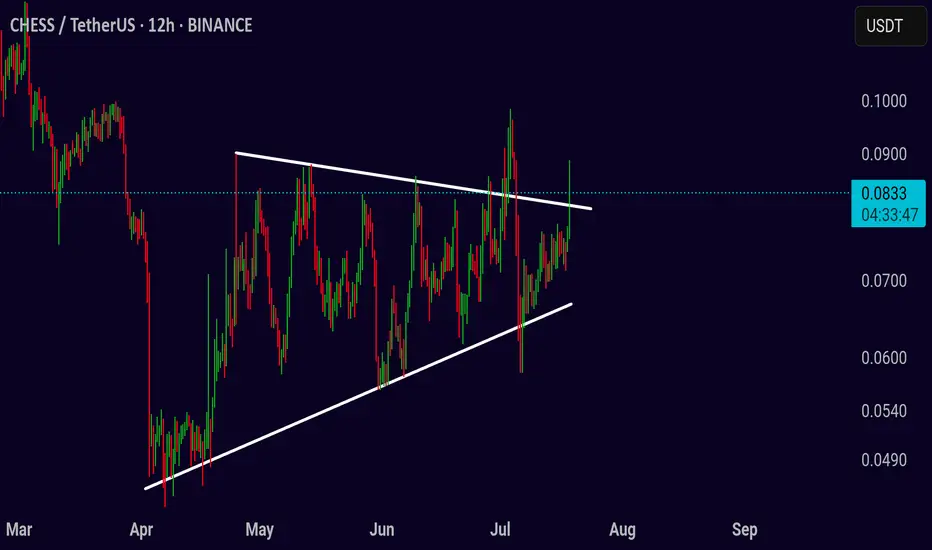
Ultimate Breakout Strategy for CHESS/USDT
The CHESS/USDT chart is currently consolidating in a symmetrical triangle pattern, signaling that a breakout could be imminent. As the price squeezes within converging trendlines, the next move is critical. Will the price push higher or drop lower? Let’s take a closer look at the potential setups.
Bullish Breakout Opportunity
If the price breaks above the upper resistance at 0.085, this could signal a bullish breakout. A strong move above this level could lead to further upward momentum, targeting levels at 0.095, 0.105, and even 0.115. Placing a stop loss at 0.075 ensures you’re protected if the price fails to maintain the breakout and reverses. Keep an eye on volume—this will be a key indicator to confirm the breakout’s strength.
Bearish Breakdown Risk
If the price fails to break above the resistance and drops below 0.075, it could signal a bearish breakdown. In this case, consider shorting the market with targets at 0.070 and 0.060. A stop loss just above 0.082 can be used to limit risks. Be sure to monitor volume closely to confirm the move, as low volume can lead to false breakdowns.
Pro Tip:
Volume plays a crucial role in validating breakouts and breakdowns. Look for a significant increase in volume when the price breaks key levels. A well-executed risk management plan with proper stop losses will help you stay in control no matter which direction the price moves.
Stay disciplined and follow the price action closely to make the most out of the upcoming move in CHESS/USDT. Whether it’s an upside breakout or a downside breakdown, this strategy prepares you for both scenarios.
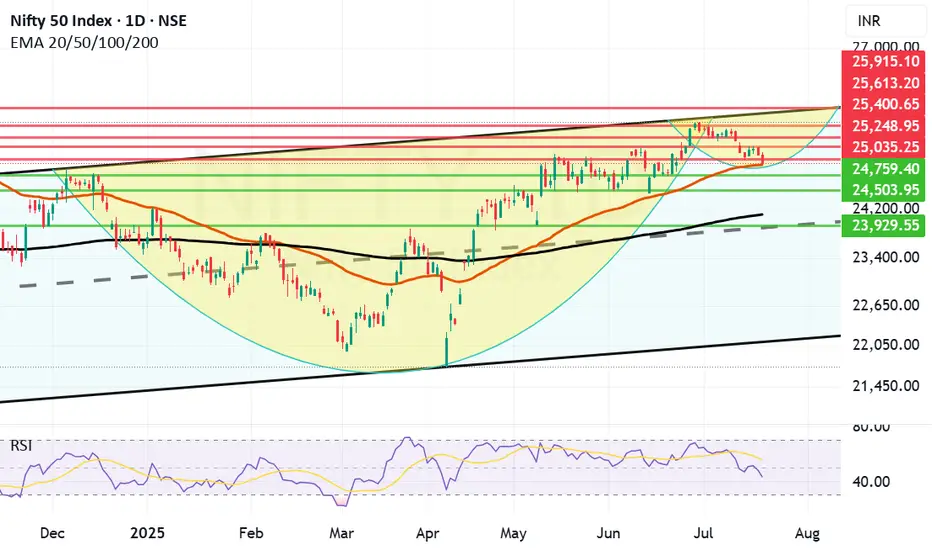
Can Reliance and Banks turn Nifty around? do or die Monday. Nifty as of now has taken support at Mother line in daily chart. As expected in my Yesterday's message. So Hopefully if Big Banks Results are in line tomorrow we might see Nifty going upwards from Monday.
Mota Bhai just announced the results. EBITDA is slightly less than expected but Net Profit and Revenue is much better than Market expectation. In my view market should react positively to this result.
Supports For Nifty remain at 24932 (Mother line), 24759, 24503. As indicated earlier if we get a closing below 24503 we may see a Fall towards 24106 or 23929 (In unlikely circumstances).
Nifty Resistances remain at: 25035, 25248, 25400 and 25613 (Channel top Resistance).
Results for tomorrow
HDFC BANK
ICICIBANK
AUSMALL BANK
RBL BANK
UNION BANK
YES BANK
CENTR BANK
PUNJA BANK
CENTR BANK
So it seems like a Do or Die Monday on cards. Shadow of the candle looks neutral as of now.
Disclaimer: The above information is provided for educational purpose, analysis and paper trading only. Please don't treat this as a buy or sell recommendation for the stock or index. The Techno-Funda analysis is based on data that is more than 3 months old. Supports and Resistances are determined by historic past peaks and Valley in the chart. Many other indicators and patterns like EMA, RSI, MACD, Volumes, Fibonacci, parallel channel etc. use historic data which is 3 months or older cyclical points. There is no guarantee they will work in future as markets are highly volatile and swings in prices are also due to macro and micro factors based on actions taken by the company as well as region and global events. Equity investment is subject to risks. I or my clients or family members might have positions in the stocks that we mention in our educational posts. We will not be responsible for any Profit or loss that may occur due to any financial decision taken based on any data provided in this message. Do consult your investment advisor before taking any financial decisions. Stop losses should be an important part of any investment in equity.
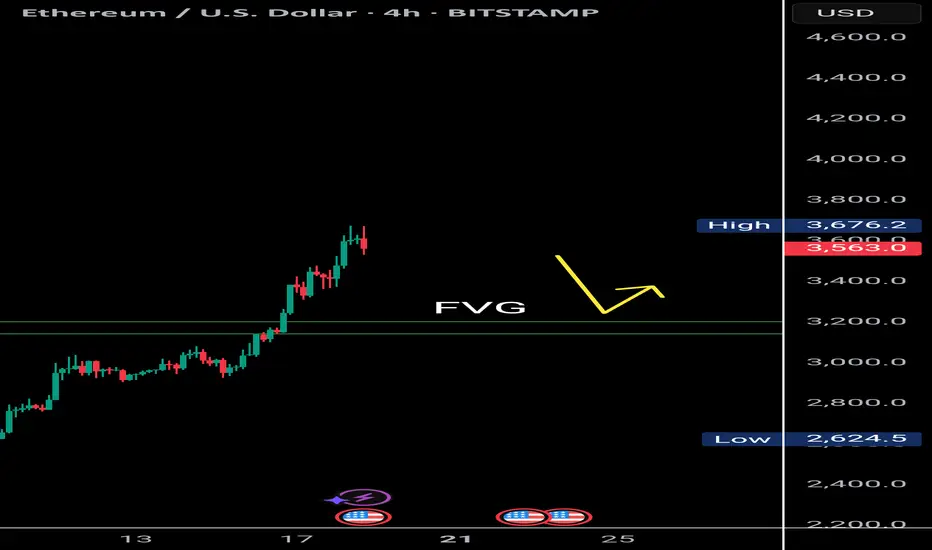
$Eth Faces Double Top Resistance with Bearish RSI DivergenceETH/USDT | 4H Analysis
Ethereum is currently showing signs of weakness on the 4H chart, forming a potential double top pattern around the $3,700-$3,680 range.
Adding to this, the RSI is exhibiting bearish divergence, suggesting that bullish momentum is fading. There's a visible liquidity gap between $3,200–$3,180, which might act as a magnet in the short term. A retest of this zone is likely before ETH attempts to resume its upward move.
Key Observations:
🟠 Double top structure on 4H chart
🔻 Bearish RSI divergence
🕳️ Favorable gap: $3,200 – $3,180
🔁 Watch for price reaction after retest
⚠️ If ETH holds the $3,180 support after filling the gap, a bullish bounce toward higher levels could follow.
📌 This idea is for educational purposes. Trade wisely with proper risk management.
US consumer sentiment improved in Jun could boost US indices The US July Michigan Consumer Sentiment Index increased to 61.8 from 60.7, while the 12-month inflation expectation decreased to 3.6% from 4% in the previous month. This suggests an easing of inflation concerns and improved consumption optimism.
This data, coupled with recent stronger Retail Sales figures, continues to support expectations for robust US economic growth amidst trade tariff uncertainties. Inflation is anticipated to have a limited short-term impact. Concurrently, the approval for AMD and Nvidia (NVDA) to export AI chips to China further bolsters the US tech sector.
The USTEC is currently in an upward trend, having reached a new high before a slight retreat. It is trading above both the EMA21 and EMA78, indicating higher highs and higher lows, suggesting the rally could persist.
Should the USTEC continue its surge, the index may test the resistance level at 23,200. Conversely, a failure to maintain above the trendline could trigger a decline towards the next support at 22,600.
By Van Ha Trinh - Financial Market Strategist from Exness
Gold Analysis 7/14/25This week's analysis so far. Keep in mind the Sunday open as price tends to come back to this point sometimes.
