MRVL watch $64.40/43: proven Double Fib holding up the recovery MRVL trying to recover with the chip sector.
Up against a proven Double Fib at $64.40/43.
Look for a Dip-to-Fib or Break-n-Retest entry.
Trend Analysis

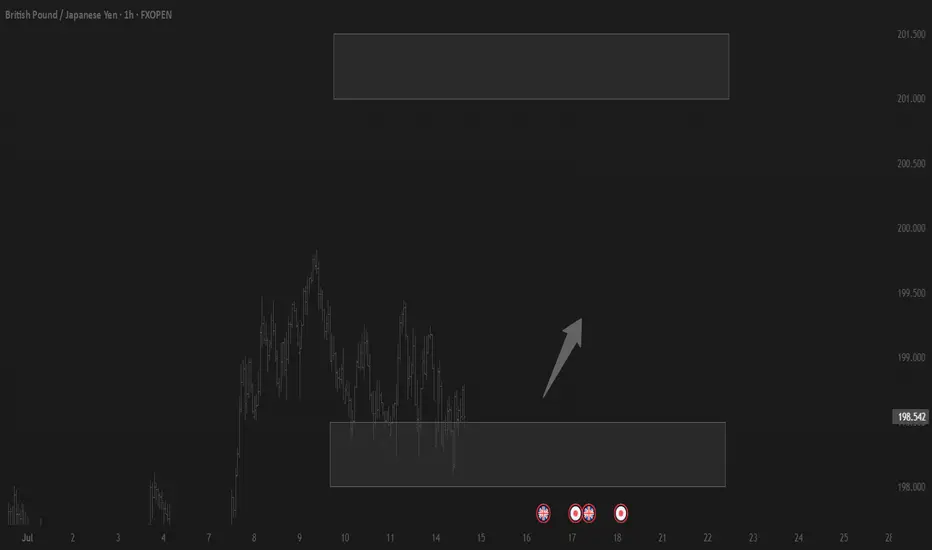
Trading balanceTrading balance The price of the asset has rebounded from the balance zone. With the prospect of growth into the resistance zone.
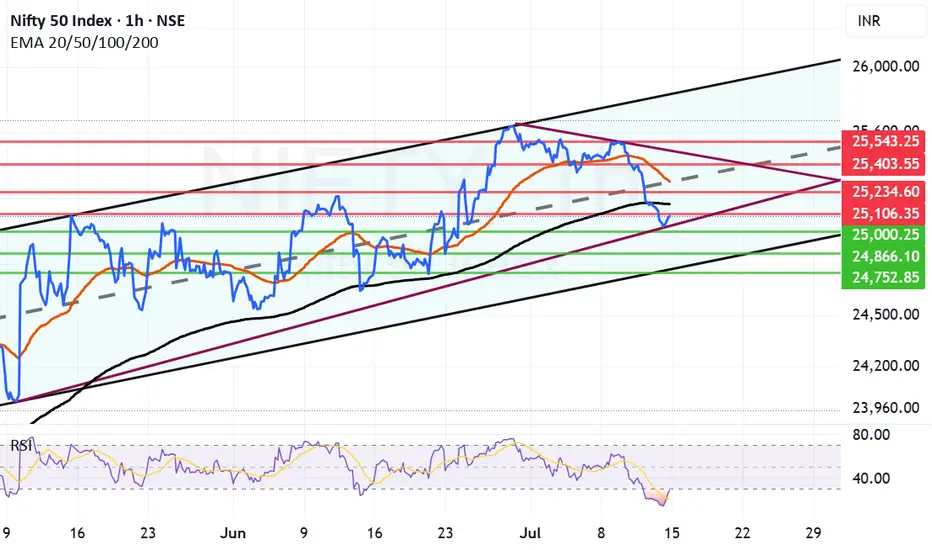
Nifty has taken support at 25K but can the support hold?Nifty today took a meaningful support at 25001 and bounced close to 25082. However ending the was in the negative by 67.55 points. RSI today went as low as 13.52 indication of oversold market. IT was a major drag after result that market did not like.
Now the resistances in front of Nifty are at 25106, Father Line Resistance at 25106, 25234, Mother Line Resistance at 25297, 25403 and finally 25543. Supports for Nifty remain at 25K, 24866 Chanel Bottom support and finally 24752. Below 24752 Bears can totally take control of the market if we reach there.
Things are in balance right now with Mid-cap, Small-cap starting to see some buying. If IT can hold the levels we will see growth from here. If IT index further caves in and other indices do not support we can see a down side. Shadow of the candle right now is neutral to negative.
Disclaimer: The above information is provided for educational purpose, analysis and paper trading only. Please don't treat this as a buy or sell recommendation for the stock or index. The Techno-Funda analysis is based on data that is more than 3 months old. Supports and Resistances are determined by historic past peaks and Valley in the chart. Many other indicators and patterns like EMA, RSI, MACD, Volumes, Fibonacci, parallel channel etc. use historic data which is 3 months or older cyclical points. There is no guarantee they will work in future as markets are highly volatile and swings in prices are also due to macro and micro factors based on actions taken by the company as well as region and global events. Equity investment is subject to risks. I or my clients or family members might have positions in the stocks that we mention in our educational posts. We will not be responsible for any Profit or loss that may occur due to any financial decision taken based on any data provided in this message. Do consult your investment advisor before taking any financial decisions. Stop losses should be an important part of any investment in equity.
CADJPY BUY OPPORTUNITY!Price is moving well from the H1 perspective. I anticipate a massive breakout in price to make a new high. This is a follow up to a BUY idea we published earlier from the daily timeframe. A buy opportunity is envisaged from the current market price.


Crude oil awaits upward breakthrough
💡Message Strategy
Inventory data provides short-term support, but it is difficult to change the trend
Although oil prices are under pressure overall, inventory data released by the U.S. Energy Information Administration (EIA) show that as of last week, U.S. gasoline and distillate inventories have dropped significantly, while gasoline consumption has increased by 6% month-on-month to 9.2 million barrels per day, indicating that the summer driving peak has brought short-term positive factors.
In addition, global aviation demand has also become an important variable to boost market sentiment. JPMorgan Chase pointed out in a client report: "In the first eight days of July, the global daily number of flights reached an average of 107,600, a record high, among which aviation activities in Asian countries have recovered to the peak in nearly five months."
The bank also expects that the average daily global crude oil demand growth this year will be 970,000 barrels, which is basically consistent with its forecast of 1 million barrels at the beginning of the year, indicating that although the consumption end is under pressure, it has not yet experienced a cliff-like decline.
📊Technical aspects
The short-term (4H) trend of crude oil breaks through the upper resistance of the range and runs in an upward trend. The moving average system is arranged in a bullish pattern, and the short-term objective trend direction is upward. The MACD indicator opens upward above the zero axis, and the bullish momentum is sufficient. The oil price fluctuates in a narrow range, and it is expected that the crude oil will continue to rise.
In terms of operation, crude oil is mainly long at a low level. If it rises to the target point, the direction will be selected according to the pattern and continued attention will be paid.
💰Strategy Package
Long Position:65.50-66.50,SL:64.00,Target:69.00-70.00

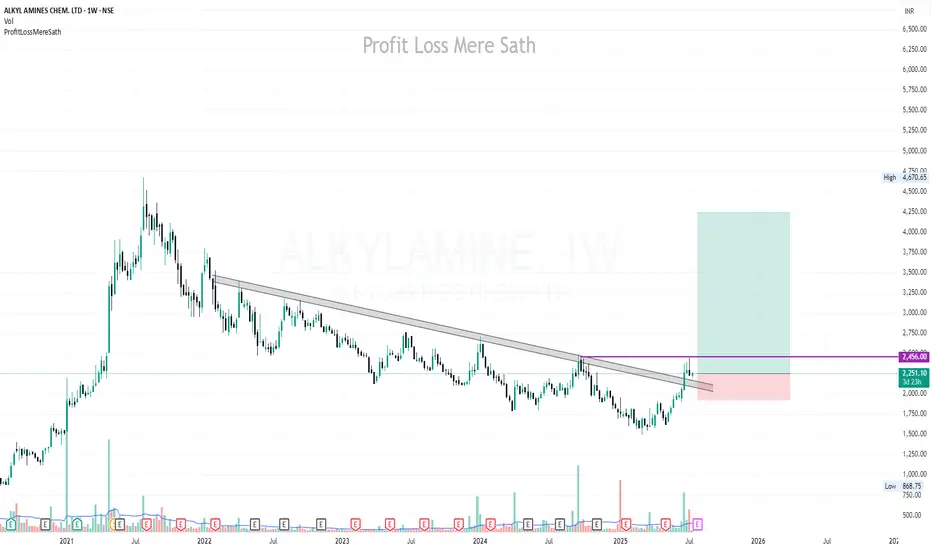
ALKYLAMINE | Buy @LTP | SL below 1900 | Targets 2700, 3440, 4250Disclaimer:
This is not financial advice. Please do your own research or consult with a financial advisor before making any investment decisions. Investments in stocks can be risky and may result in loss of capital.
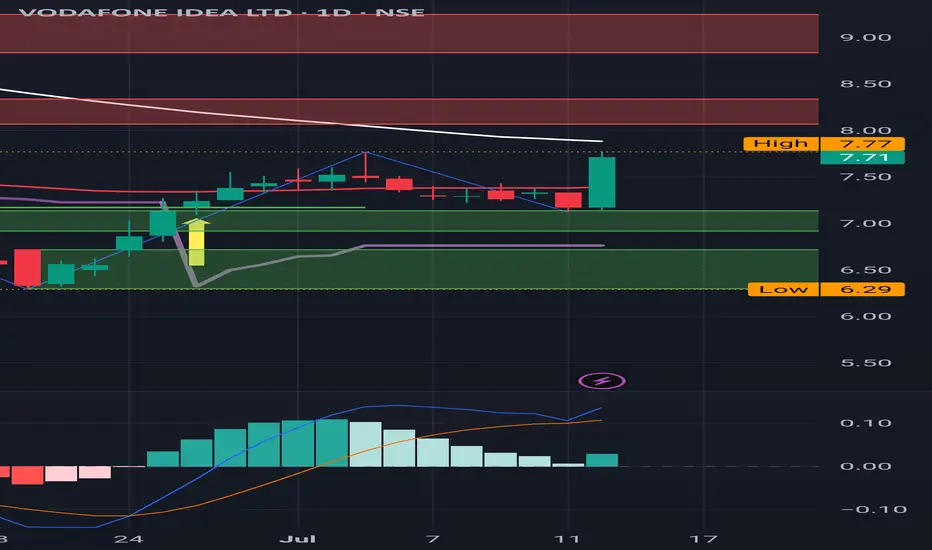
IDEA : Watch out for the Red Band resistances IDEA : Watch out for the Red Band resistances
( Not a Buy / Sell Recommendation
Do your own due diligence ,Market is subject to risks, This is my own view and for learning only .)
BABYUSDT UPDATE
Pattern: Falling Wedge Breakout
Current Price: \$0.05396
Target Price: \$0.11277
Target % Gain: 110.04%
Technical Analysis: BABY has broken out of a falling wedge on the 1D chart, signaling a bullish reversal. Price is holding above the breakout trendline with increasing momentum, confirming the setup.
Time Frame: 1D

euraud trendline longsSeeing as euraud has well respected the trendlines recently I decided to long eur back into the upper end of previously broken trendline. I am european living in australia, I know first hand how weak aud is agains eur as my salary in australia took a massive hit against euro...
I decided to go all in on this trade with a 2% risk. RR is 1:4 for the final TP, but I do see how trade management is the key for longevity, so I still plan on taking partial profits and moving my stop back to BE as soon as price is hitting 1:1 for BE and 1:2 RR for 50% profit taking.
Let's goo

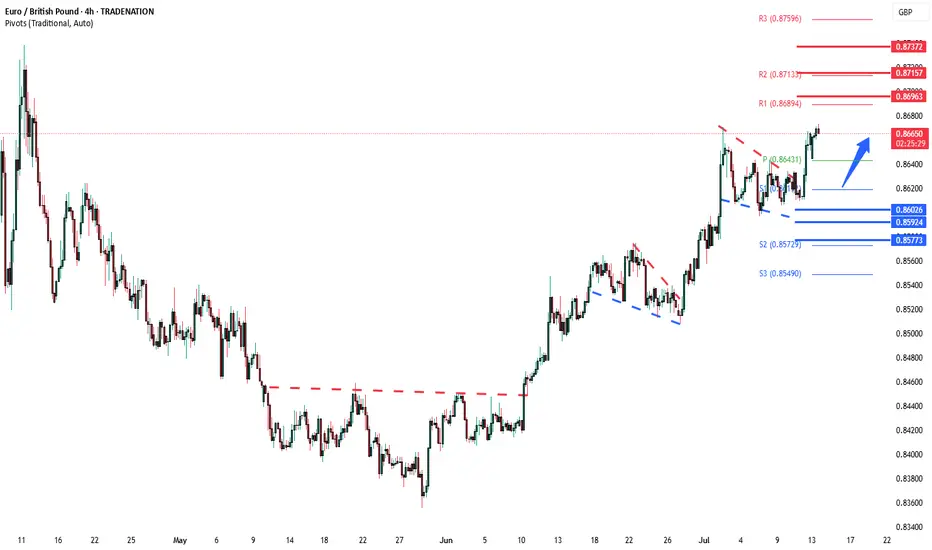
EURGBP Bullish continuation breakout supported at 0.8620The EURGBP remains in a bullish trend, with recent price action showing signs of a corrective pullback within the broader uptrend.
Support Zone: 0.8620 – a key level from previous consolidation. Price is currently testing or approaching this level.
A bullish rebound from 0.8620 would confirm ongoing upside momentum, with potential targets at:
0.8700 – initial resistance
0.8715 – psychological and structural level
0.8740 – extended resistance on the longer-term chart
Bearish Scenario:
A confirmed break and daily close below 0.8620 would weaken the bullish outlook and suggest deeper downside risk toward:
0.8600 – minor support
0.8590 – stronger support and potential demand zone
Outlook:
Bullish bias remains intact while the EURGBP holds above 0.8620. A sustained break below this level could shift momentum to the downside in the short term.
This communication is for informational purposes only and should not be viewed as any form of recommendation as to a particular course of action or as investment advice. It is not intended as an offer or solicitation for the purchase or sale of any financial instrument or as an official confirmation of any transaction. Opinions, estimates and assumptions expressed herein are made as of the date of this communication and are subject to change without notice. This communication has been prepared based upon information, including market prices, data and other information, believed to be reliable; however, Trade Nation does not warrant its completeness or accuracy. All market prices and market data contained in or attached to this communication are indicative and subject to change without notice.
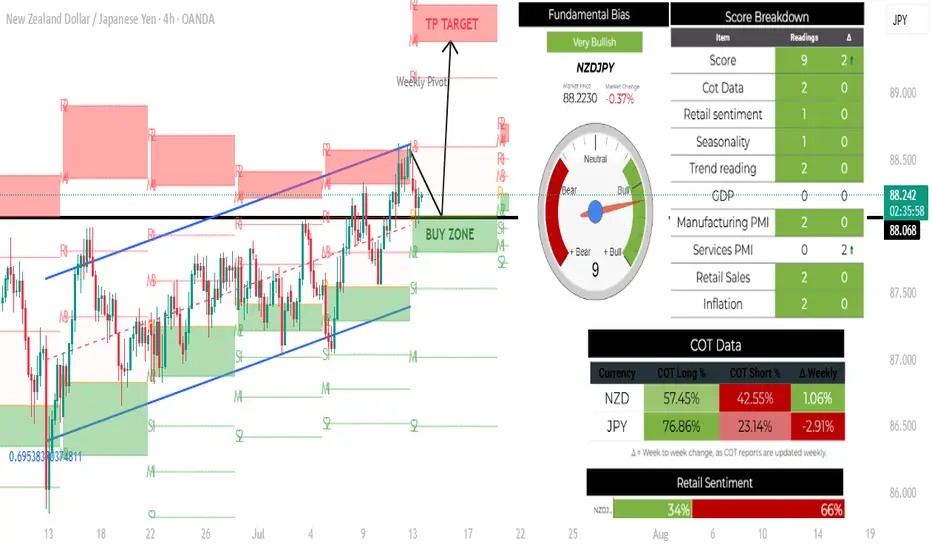
NZDJPY H4 LONG SETUP: 14-18 JULY 2025TECHNICAL ANALYSIS
Market and price are both bullish. After printing a higher low bulls will be looking to push price to the upside all the way to this weeks TP target.
FUNDAMENTAL ANALYSIS
Fundamentals also indicate bullishness. The currency pair NZDJPY has a score of 11, indicating that the base currency is stronger than the quote currency. The seasonality and COT scores also indicate bullishness.
XRP BREAKOUT INCOMING, TARGET AT 256% PROFITSIn this video I summarize the potential rectangle breakout setup on XRP out of a double bottom base with price targets of 3.8 minimum to 6.8 maximum.

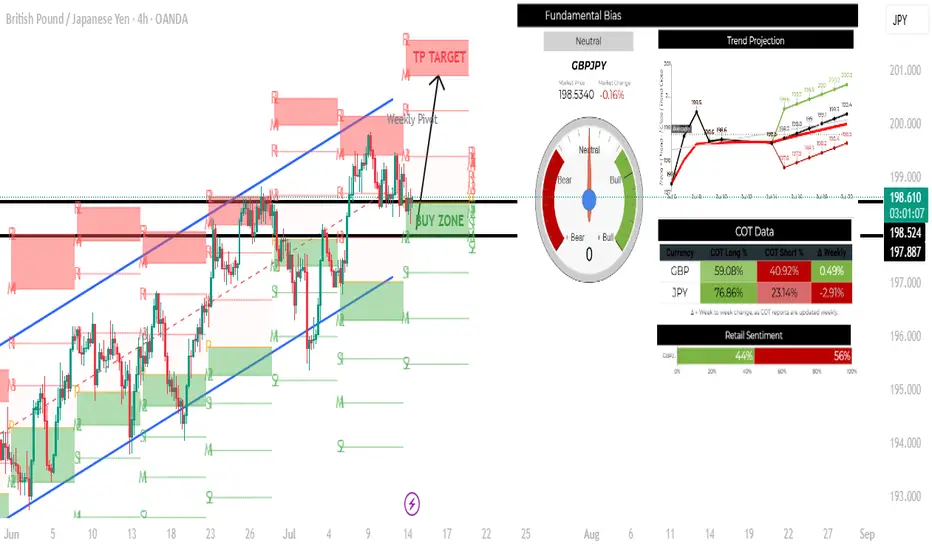
GBPJPY H4 LONG SETUP: 14-18 JULY 2025TECHNICAL ANALYSIS
This pair is bullish and its in a beautiful upward channel creating higher highs and higher lows. Price is currently in the weekly buy zone which is also the current support area. Bulls will be looking to go long here and hope to take price all the way to the projected take profit target.
FUNDAMENTAL ANALYSIS
The currency pair GBPJPY has a score of 2, indicating that the base currency is stronger than the quote currency. However, the pair shows neutrality with the trend projection being to the upside. COT shows institutional positioning is long both pairs, the market and price, however, is bullish.
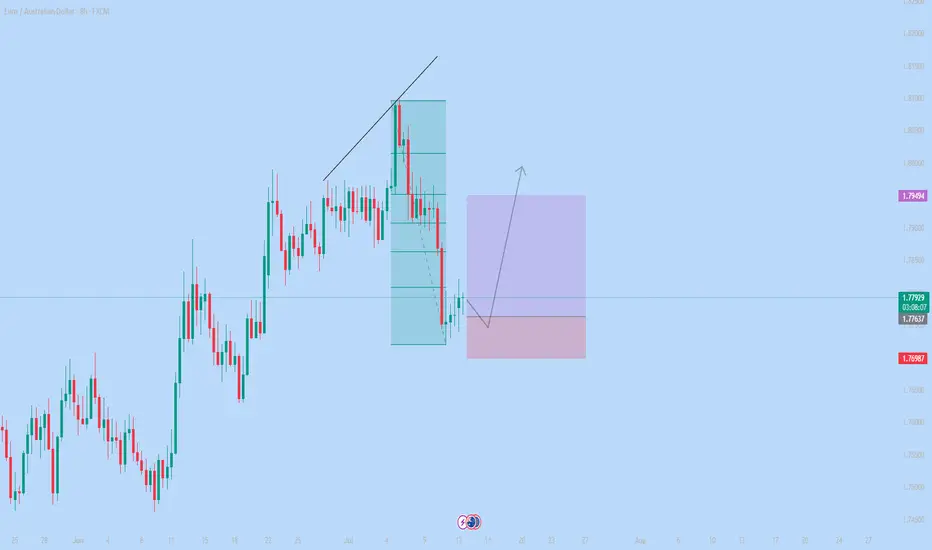
#009: EUR/AUD Long Investment Opportunity
We placed a buy limit order at 1,776, waiting for a bearish spike that would allow us to enter alongside the institutions, not against them.
Why this entry?
🔻 We're waiting for a false breakout at 1,776, a key level where big players are accumulating liquidity with technical stop hunts.
🔐 The SL is below the levels where banking systems have protective orders for the future.
📊 Retailers are still heavily short and aren't exiting, confirming that the upside movement hasn't started yet.
📈 Open interest shows anticipation of an imminent breakout, with progressive loading by large players.
⏳ We're staying out now to avoid being victims of the retracement, but ready to enter on the institutional bearish spike.
A violent expansion toward 1.79, with a directional candlestick that will start as soon as the retail cleanup below 1.776 is completed.
The trade has all the hallmarks of a perfect institutional entry: early positioning, patience, and a defensive stop.
My Take on the EURUSD H1 Setup (July 14, 2025)
This is a classic textbook-quality TCB setup forming right at a critical confluence zone. Here's a full breakdown from a trader's lens:
🔵 1. Trend
Bias: Bullish
The macro structure from June shows a strong uptrend, and the most recent impulse was explosive — indicating active buyers.
H4 and D1 show no trend break yet.
🔵 2. Countertrend
The descending channel is neat and controlled — no erratic spikes or liquidity wicks that signal confusion.
Compression into the demand zone (gray box) around 1.1652–1.1710 shows sellers are weakening.
This is typical of pre-breakout structure when buyers are loading up under the radar.
🔵 3. Breakout
Price just broke cleanly above the channel and is sitting slightly above the horizontal resistance (1.1710).
A retest and bullish candle confirmation would be ideal — don't rush in yet, let the market prove its intent.
🧠 Strategic Entry Zone (My Plan)
EP: 1.1710–1.1720 (after bullish retest candle)
SL: 1.1650 (just below demand and structure low)
TP: 1.1840 zone (clean R:R ≈ 1:2)
⚠️ Risk Watch
DXY inverse correlation should support this (if DXY is breaking lower, that adds confidence).
Make sure there's no high-impact news within next 4–6 hours (like US CPI, FOMC).
Session timing is favorable — NY open approaching, which brings momentum.
✅ Verdict
High-probability long setup (TCB Score: 8/10).
Wait for a bullish retest candle on the 1H or even 15M before entry. If that happens, the probability of hitting 1.1840 is strong — particularly if volume confirms.


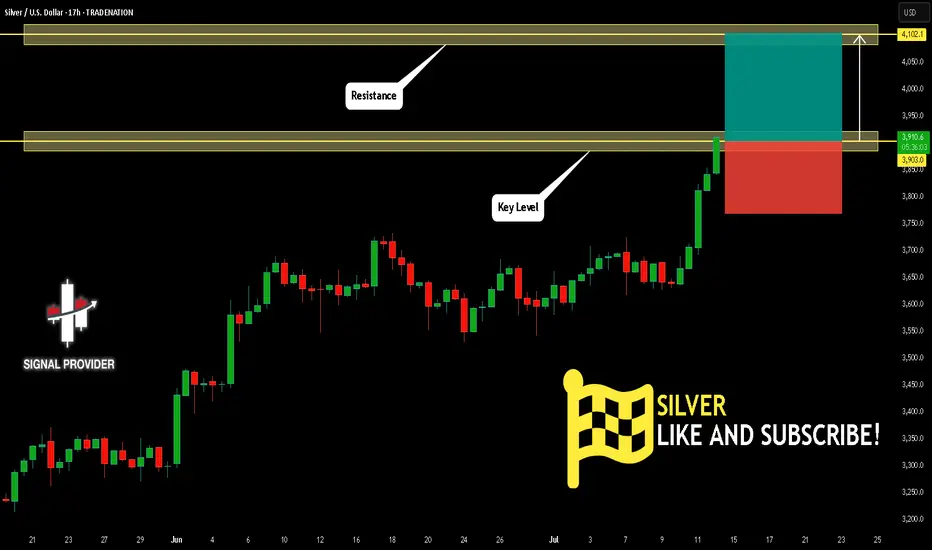
SILVER Will Go Up From Support! Buy!
Please, check our technical outlook for SILVER.
Time Frame: 17h
Current Trend: Bullish
Sentiment: Oversold (based on 7-period RSI)
Forecast: Bullish
The market is approaching a key horizontal level 3,903.0.
Considering the today's price action, probabilities will be high to see a movement to 4,102.1.
P.S
Overbought describes a period of time where there has been a significant and consistent upward move in price over a period of time without much pullback.
Disclosure: I am part of Trade Nation's Influencer program and receive a monthly fee for using their TradingView charts in my analysis.
Like and subscribe and comment my ideas if you enjoy them!
GBPUSD Will Go Up! Long!
Take a look at our analysis for GBPUSD.
Time Frame: 6h
Current Trend: Bullish
Sentiment: Oversold (based on 7-period RSI)
Forecast: Bullish
The market is on a crucial zone of demand 1.347.
The oversold market condition in a combination with key structure gives us a relatively strong bullish signal with goal 1.358 level.
P.S
The term oversold refers to a condition where an asset has traded lower in price and has the potential for a price bounce.
Overbought refers to market scenarios where the instrument is traded considerably higher than its fair value. Overvaluation is caused by market sentiments when there is positive news.
Disclosure: I am part of Trade Nation's Influencer program and receive a monthly fee for using their TradingView charts in my analysis.
Like and subscribe and comment my ideas if you enjoy them!

Gold prices are under pressure at $3,380 todayGold prices are under pressure at $3,380 today
Safe-haven demand rises
Trump announced that he will impose a 30% tariff on EU and Mexican goods from August 1, and a 20% to 50% tariff on Canada, Japan, Brazil and other countries. The market is worried about the escalation of the trade war, pushing up gold prices.
Gold prices soared to $3,374 in the Asian session today (the highest since June 23).
Fed policy expectations
The minutes of the June FOMC meeting showed that there were differences within the Fed on the issue of interest rate cuts, and the probability of keeping interest rates unchanged in July was 93.3%. Market expectations for interest rate cuts have cooled, limiting the rise in gold prices.
US dollar trend
Last Friday, the US dollar index closed up 0.3% at 97.85, approaching the 98 mark, which puts pressure on gold in the short term.
3. Technical analysis
Short-term trend
Support: $3,340-3,350 (21-day moving average), $3,326 (50-day moving average).
Resistance level: $3377 (23.6% Fibonacci retracement level), $3400 (psychological barrier).
MACD golden cross formed, indicating that there is still room for growth.
Key observation points
If the gold price stands above $3377, it may challenge $3400;
If it falls below $3340, it may test the support level of $3320-3300.
Comprehensive analysis from the current sentiment:
Day trading ideas: Try to go long at a low price, and treat it with a volatile long-term idea. Today's gold price is likely to break through 3380, and today's target is likely to be 3400+
Fourth, pay attention to the market outlook
Trump issued a policy statement on Russia today (may involve new sanctions).
US June CPI data (released on Tuesday, affecting the Fed's policy expectations).
Subsequent development of the trade war (the EU and Mexico may take countermeasures).

Ethereum (ETH): Looks Good, We Are Going For $3300-3400 EasilyWe are flying; Ethereum seems strong, so we are bullish on it. Our target of $3K was reached and broken easily, and now we are looking for the next resistance area to be reached, which is $3300-3400.
Targets are set; the first one got reached, and now we're heading towards the other 2 targets of ours!
Time for BINGX:ETHUSDT.P to shine.
Swallow Academy

Hbar |Trade Setup📌 After the breakout from the last high at $0.23, a bullish sequence (green) has now been activated.
📊 These setups typically occur no more than twice per year on any given altcoin, so I’ll be aggressively buying each level at the B-C retracement area.
Trademanagement:
- I'm placing long orders at each level. ((If the price continues climbing, I’ll adjust the trend reversal level (green) accordingly and update my limit orders.)
- Once the trade reaches a 2 R/R, I’ll move the stop-loss to break-even.
- From a 3 R/R onward, I’ll start locking in profits.
✅ I welcome every correction from here on —
but I won’t enter any new positions at these top levels.
Stay safe & lets make money

GBPUSD INTRASDAY corrective pullback support at 1.3430The GBPUSD remains in a bullish trend, with recent price action showing signs of a corrective pullback within the broader uptrend.
Support Zone: 1.3430 – a key level from previous consolidation. Price is currently testing or approaching this level.
A bullish rebound from 1.3430 would confirm ongoing upside momentum, with potential targets at:
1.3600 – initial resistance
1.3670 – psychological and structural level
1.3730 – extended resistance on the longer-term chart
Bearish Scenario:
A confirmed break and daily close below 1.3430 would weaken the bullish outlook and suggest deeper downside risk toward:
1.3370 – minor support
1.3300 – stronger support and potential demand zone
Outlook:
Bullish bias remains intact while the FTSE holds above 1.3430. A sustained break below this level could shift momentum to the downside in the short term.
This communication is for informational purposes only and should not be viewed as any form of recommendation as to a particular course of action or as investment advice. It is not intended as an offer or solicitation for the purchase or sale of any financial instrument or as an official confirmation of any transaction. Opinions, estimates and assumptions expressed herein are made as of the date of this communication and are subject to change without notice. This communication has been prepared based upon information, including market prices, data and other information, believed to be reliable; however, Trade Nation does not warrant its completeness or accuracy. All market prices and market data contained in or attached to this communication are indicative and subject to change without notice.
