Trend Analysis

FARTCOIN — Perfect Swing Long Up 27%, Dips Are for BuyingDips into $1.06–1.09 (1H FVG + BOS) are for buying.
Still bullish while above $0.92–0.93 OB. Eyeing $1.43 next.

CHILLGUY Breaking Out — Rotating Gains Into Next Meme Runner🎯 Trading Plan:
Watch for a sweep into the red box and LTF reclaim for spot entry
Targets: $0.117 (yearly high), then $0.129–$0.158 if strong momentum
Manual invalidation: 1D close below red box
🚨 Risk Warning:
No spot entry unless sweep/reclaim at supply zone
Exit if 1D candle closes below supply zone

MSTR Daily Chart Analysis: Key Price LevelsThis analysis focuses on the daily chart of MicroStrategy (MSTR), highlighting significant price action, identified patterns, and predefined support and resistance levels.
Price Action Overview:
Starting from late 2024/early 2025, MSTR experienced a notable downtrend, characterized by a series of lower highs and lower lows, leading to a test of the "Strong Support" zone, illustrated by the grey shaded area around the 230-240 price level.
Following this decline, the chart illustrates a distinct "W" pattern formation, often interpreted as a potential bullish reversal signal. This pattern culminated in a decisive breakout above the overhead descending trendline (marked in red), indicating a shift in market structure from downtrend to a more bullish posture.
Post-breakout, the price saw a strong upward move into May. A subsequent pullback found significant support within the "Key Support 360 to 370" zone, which appears to have acted as a crucial pivot point, preventing further decline. More recently, the price has consolidated and is current
ly trading above the "1st Support 390 to 400" area.
Key Levels Identified:
Key Resistance / Target Level (435 to 450): The red shaded area at the top represents a significant overhead resistance zone. This level aligns with a previous peak and is identified as a potential target if the current upward momentum continues.
1st Support (390 to 400): This green shaded area serves as the immediate support level. The price has recently traded above this zone, suggesting it has transitioned into a new support area after potentially acting as resistance previously. Sustaining price action above this level would be a key observation.
Key Support (360 to 370): Located below the first support, this green zone has demonstrated its importance in recent price action, coinciding with the lows seen in June, where buyers stepped in.
Feb 50% Retracement & Flip Zone (330 to 340): This lower green shaded area represents a significant structural level, identified as a potential 50% Fibonacci retracement level from a previous move and a historical "flip zone" where price action shifted between support and resistance.
Strong Support (approx. 230-240): The grey shaded box at the bottom indicates a strong historical support level, representing the lowest point observed within this timeframe, acting as a critical long-term floor.
Current Observations:
The current price of 405.09 indicates MSTR is trading above its immediate "1st Support 390 to 400" zone. The dotted blue line on the chart illustrates a hypothetical continuation of the current upward momentum, projecting a potential move towards the "Key Resistance / Target Level 435 to 450."
Disclaimer:
The information provided in this chart is for educational and informational purposes only and should not be considered as investment advice. Trading and investing involve substantial risk and are not suitable for every investor. You should carefully consider your financial situation and consult with a financial advisor before making any investment decisions. The creator of this chart does not guarantee any specific outcome or profit and is not responsible for any losses incurred as a result of using this information. Past performance is not indicative of future results. Use this information at your own risk. This chart has been created for my own improvement in Trading and Investment Analysis. Please do your own analysis before any investments.

The bearish trend is confirmed, it’s time to participate.Gold overnight short orders have been stopped at a loss, because it broke through the key pressure of 3325. However, we must grasp the trend of the market, adhere to the idea of technical analysis as the main and news as the auxiliary, and make a comprehensive judgment. Don't be at a loss about the market analysis because of the stop loss. There is nothing wrong with waiting for the market to step back and do more, but the market does not give opportunities, but forces you to chase the rise. Of course, from the perspective of risk ratio, high altitude is definitely more stable than chasing more.
From the current gold trend analysis, the focus on the upper side is the 3340-3350 line of pressure, the short-term support on the lower side is around 3310-3320, and the key support on the 3295-3301 line is focused. Relying on this range as a whole, the main tone of high-altitude and low-multiple participation remains unchanged. In the middle position, it is recommended to wait and see, chase orders cautiously, and wait patiently for key points to enter the market.
Operation strategy 1: Short gold near 3340-3350, target 3325-3315.
Operation strategy 2: Go long on gold around 3310-3320, target 3330-3340.

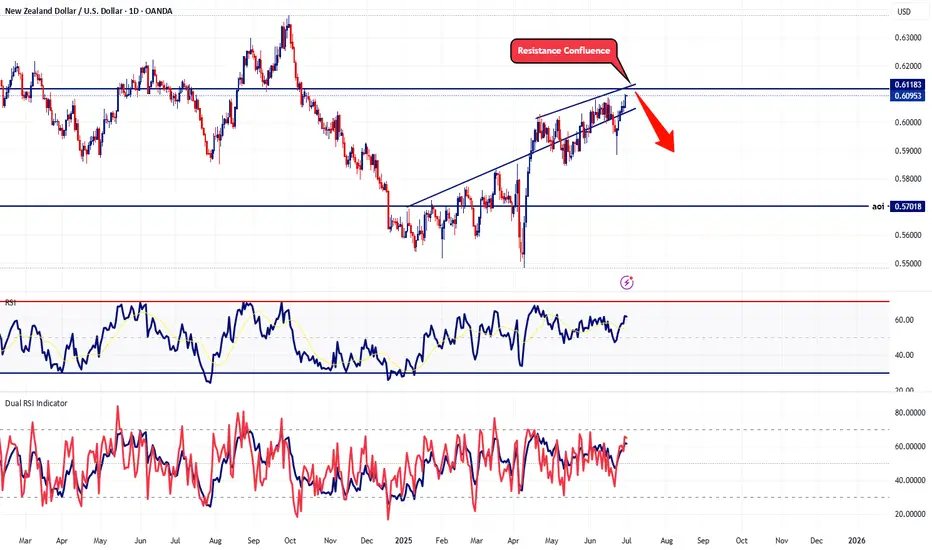
Preparing to Short Sell NZDUSD - Large LotsThis pair doesn't really get much attention but the fact is that the US is the strongest country of the majors while New Zealand is actually the weakest. When I pooled together all the economic data, these are the facts.
With that said, this pair is approaching a significant confluence resistance territory and it's highly unlikely to break above. Needless to say, I'm preparing to start scaling shorts with this pair. As I mentioned in the title, since this pair doesn't get much daily pip action, I'll be increasing my lot sizes to make up the difference.
That's it - That's all
Trade Safe

SOL Breakout — Eyeing $180 NextCRYPTOCAP:SOL | Breakout above channel — main target $180 next.
Watch $140–145 for retest/bounce. If failed, $112 is major support.
Trend: Bullish | Next stop: $180

The Pattern That Could Launch Bitcoin, pt. 2There appears to be an IH&S pattern forming inside of the larger IH&S's right shoulder (see my previous post for the larger one). I've seen this happen a few times and then a break out upwards! Results may vary of course lol.
If it drops from here support could be at around $102k and then $100,500.

HolderStat┆SOLUSD aims for the $170 levelBINANCE:SOLUSDT has broken above triangle resistance, retesting the $146.60 level as new support. The breakout echoes earlier consolidation-based rallies, opening the path toward $170. As long as the structure remains intact, bulls could extend the climb over the next few sessions.

BTC 2HOURS BEARSH ANALYSISThe chart hasred and green bars showing price changes our 2 hours. tow arrows point to a red green box, indicating a possible trading plan. the also has lines and lable to help traders anderstand the market. its like a graph showing how the dollers value is changes .

GBPAUD - Trading The Range!Hello TradingView Family / Fellow Traders. This is Richard, also known as theSignalyst.
📈GA has been hovering within a big range.
This week, GA is retesting the upper bound of the range acting as a resistance.
As long as the resistance holds, we will be looking for shorts on lower timeframes, targeting the lower bound of the range.
📚 Always follow your trading plan regarding entry, risk management, and trade management.
Good luck!
All Strategies Are Good; If Managed Properly!
~Rich
Disclosure: I am part of Trade Nation's Influencer program and receive a monthly fee for using their TradingView charts in my analysis.

GOLD Bouncing from Trendline, Breakout Ahead?GOLD BOTTOM IS HERE 🔥
Gold has taken support from the rising trendline and is now close to breaking a key resistance. The chart is showing an ascending triangle, which usually means a big move is coming.
If price breaks above the resistance, we might see a strong rally of 13% or more.
The setup looks positive as long as the support stays strong.
Looks like Gold is ready to shine again!
Retweet if you're bullish.
Like and follow for more updates!
#GOLD TVC:XAU

RIOT / 3hAccording to the adjusted wave count in this 3h-frame, the continuous advance in NASDAQ:RIOT may be considered as an ending diagonal in the 5th wave of the one larger degree leading diagonal as wave (1), which could have remained in the late stages!
Wave Analysis >> The Minor degree wave 5 might continue to advance just to 7.7% >> 12.12 as an extreme high of the entire leading diagonal pattern as wave (1).
Trend Analysis >> The entire pattern in a leading diagonal as wave (1) quite well indicates a bullish view in the medium term, at the beginning of an ongoing UPTrend!
#CryptoStocks #RIOT #BTCMining #Bitcoin #BTC

BTC - High Probability Trade Idea Here we have a major resistance at this upper level. And market seems to create a "Double Top Patter". So its indicating a possible bearish move.
Target and Sl on chart. Follow risk and money management.
BINANCE:BTCUSDT BITSTAMP:BTCUSD BINANCE:BTCUSDT.P INDEX:BTCUSD BYBIT:BTCUSDT.P BINANCE:BTCUSD

$ETHBTC: Correction is over?Ethereum vs Bitcoin shows that the strong surge that kicked off during May might not be a one off...
If you take a look at monthly BITSTAMP:ETHUSD and BITSTAMP:BTCUSD , both charts show a bullish trend that is active until EOY at least (maybe even during the first half of the whole of 2026 depending on how you look at it). But lately, it became clear that the pivot in the EF foundation, capitulation of Bankless who used to be cheerleaders for ETH at all times and started cozying up to Solana people at the bottom, and the insane level of hatred it accumulated from everyone in Crypto circles were the sign of a bottom signal.
This made sense to me as the monthly down trend active in BINANCE:ETHBTC was coming to an end while price retested the level where it had turned bullish during 2016-2017, which led to the most massive 'Alt season' ever which made CT coin the term in hindsight after, something imbued in the crypto trader genome at this point. It was bound to be a signifcant level and indeed price bottomed very close to it in a climactic manner.
Recently, crypto endured a correction manifested in a daily timeframe down trend in most coins, but that trend is turning around once more it seems. The market has favored coins that have profitable protocolos/dapps since the bottom in BINANCE:ETHBTC and BITSTAMP:ETHUSD , specially those returning $ to token holders like GETTEX:HYPE , CRYPTOCAP:ETHFI , and others that will or might do so ( CRYPTOCAP:AAVE , BME:UNI , to name a few).
If you were sidelined you had and still have a decent chance to reposition into crypto for the next long term bullish swing.
Best of luck!
Cheers,
Ivan Labrie.

BUY TRAP OR TREND ?xauusd is supposed to frame bearish zone by faking bullish trend. the current candle sticks momentum indicate seller control. the dollar performance and high intererst rate along with geopolitical peace full events are likely to encourage a seller control.
the resistance is 3370 if market did not break it then it will fall on the last target i set up for you.
target 1 ( 3330)
target 2 (3302)

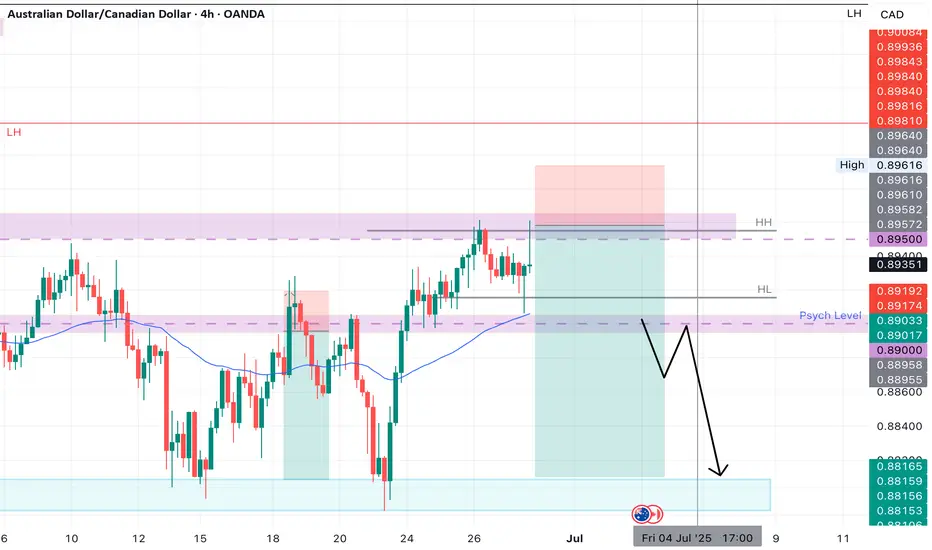
AUDCAD SHORT Market structure bearish on HTFs DW
Entry at both Daily and Weekly AOi
Weekly Rejection At AOi
Previous Weekly Structure Point
Weekly EMA retest
Daily Rejection at AOi
Previous Structure point Daily
Around Psychological Level 0.89500
H4 Candlestick rejection Y
Levels 4,17
Entry 95%
REMEMBER : Trading is a Game Of Probability
: Manage Your Risk
: Be Patient
: Every Moment Is Unique
: Rinse, Wash, Repeat!
: Christ is King.
Bitcoin Short-Term Outlook – Coming Week📈 Bitcoin Short-Term Outlook – Coming Week
Currently, Bitcoin is expected to gather liquidity around the $106,000 zone, potentially initiating a move toward the $110,000 resistance level.
This area will be crucial in determining the next directional move.
🔍 The market's reaction around $110,000 will be closely monitored, and the analysis will be updated once that level is reached.
📌 Note: This outlook is based on current market conditions and may require adjustments if sentiment or price structure changes.

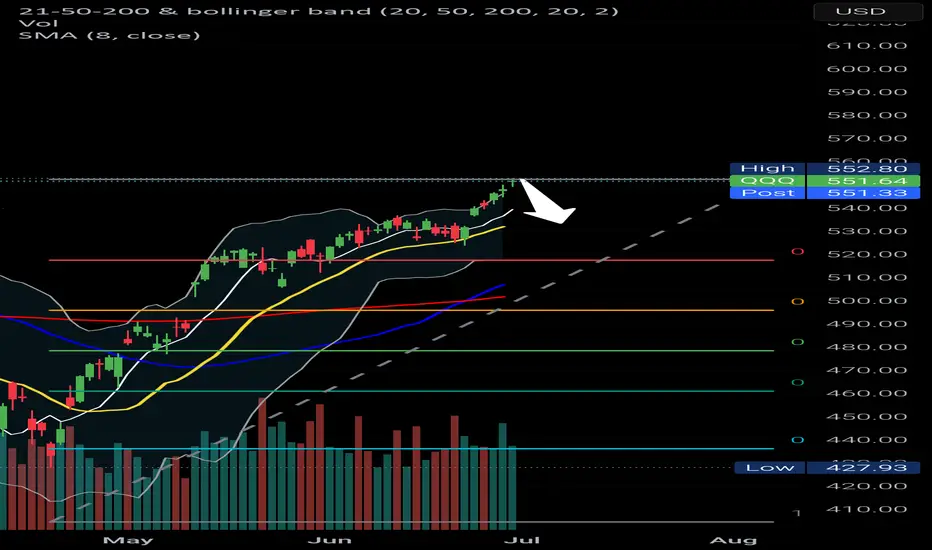
Qqq short Qqq short 532
Bounce LH and another dump
No need to complicate things too much .
Good luck
#XAUUSD 30MIN 📉 #XAUUSD 30m Sell Setup – Bearish Continuation Ahead
Gold is currently retracing after a strong drop, consolidating within a short-term Supply Zone. We anticipate a temporary bullish push toward the 3345–3350 premium area, where the broader bearish trend is expected to resume.
🔻 Sell Zone: 3345 – 3350 (Supply / OB Zone)
🎯 Targets: 3300 → 3260
❌ Stop Loss: Above 3358
⚠ Note: This is a short-term retracement, not a trend reversal.
We expect selling pressure to return once price taps into the 3350 Order Block, in line with the higher timeframe bearish structure.
#gold #XAUUSD #forexsignals #SmartMoney

Gold Approaching Key Support – Reversal Zone at $3,200 in SightGold has entered a corrective phase after topping out around the $3,450 region. Price action is steadily pulling back, but it’s now approaching a critical support level near $3,200 — a zone we’ve highlighted in recent updates as a potential area for bullish interest.
From a technical standpoint, the $3,200 level is a confluence zone:
- 0.618 Fibonacci retracement from the recent swing
- VWAP support anchored from the prior impulse move
- This cluster of technical factors strengthens the probability of a reaction here.
The broader context shows gold trading within a high time frame range, oscillating between resistance near $3,450 and support around $3,200. These two boundaries define a clear trading range, where rotations between key levels have been consistently respected.
For the next leg higher to materialize, we need to see signs of accumulation or bullish structure forming on the lower time frames. Without this confirmation, the risk of further downside remains. However, if price can find a foothold here, a rotation back toward resistance is the likely outcome — continuing the established range dynamics.

AAPL Poised for Continued GrowthIf you haven`t bought AAPL before the rally:
What to consider now:
1. AI-Driven iPhone Upgrade CycleApple’s integration of Apple Intelligence, its proprietary AI platform, is set to catalyze a significant iPhone replacement cycle. Posts on X highlight positive sentiment around AI-driven demand, with estimates suggesting a 40% year-over-year surge in iPhone shipments in China during May 2024, signaling strong consumer interest. New AI features, such as on-device processing for enhanced privacy and functionality, are expected to drive accelerated hardware upgrades. Analysts, including Bernstein, project these features could boost upgrade rates, with even a 1% increase in upgrades driving meaningful revenue growth. With the iPhone 15 and future iterations leveraging AI, Apple is likely to capture pent-up demand, as noted by industry observers who see long-term revenue growth from its 7% year-over-year increase in active installed base.
2. Strong Ecosystem and Services GrowthApple’s ecosystem—spanning iPhones, iPads, Macs, and wearables—continues to drive customer loyalty and recurring revenue. The company reported record services growth in Q2 2025, with revenue reaching $95.4 billion, up 5% year-over-year. Services like Apple Music, iCloud, and Apple TV+ benefit from the growing active device base, which ensures sticky, high-margin revenue streams. This ecosystem strength mitigates concerns about short-term iPhone sales fluctuations, as Apple captures upgrade revenue over time. The seamless integration of hardware and services creates a moat that competitors struggle to replicate, reinforcing AAPL’s long-term growth potential.
3. Technical Bullish MomentumFrom a technical perspective, AAPL exhibits strong bullish patterns across multiple timeframes. TradingView analyses point to a rising bullish channel, with higher highs and higher lows signaling sustained upward momentum. Key bullish patterns, such as an ascending wedge and triangle, are forming around current price levels, suggesting potential breakouts. For instance, if AAPL clears $203.21 with volume, it could target $204.98 or higher, with some analyses eyeing $240 as a near-term resistance. Technical indicators like a rising RSI and MACD convergence further support short-term bullish momentum. Despite recent consolidation, reduced volatility and a strong setup pattern indicate AAPL is primed for a breakout.
4. Analyst Optimism and Market SentimentAnalyst sentiment remains overwhelmingly positive, with a consensus “Buy” rating and a 12-month price target of $228.85, implying a 14.05% upside from the current price of $200.66 as of June 2025. Hedge funds like Third Point see “significant” upside, driven by AI features that could meaningfully boost earnings. Bernstein’s raised price target to $240 reflects confidence in Apple’s ability to monetize AI through hardware and services. Posts on X also highlight investor optimism, with AAPL’s $350 billion market cap increase in a single day underscoring strong market confidence in its AI-driven growth chapter.
5. Global Expansion and Emerging MarketsApple’s growth in emerging markets, particularly India and China, bolsters its bullish case. Improved guidance for December 2023, driven by iPhone 15 adoption and India’s market potential, signals untapped opportunities. Apple’s ability to penetrate these high-growth regions, combined with its premium brand appeal, positions it to capture a larger share of global smartphone and tech markets.
Disclosure: I am part of Trade Nation's Influencer program and receive a monthly fee for using their TradingView charts in my analysis.
