XAU/USD analysis & outlookWeekly Outlook: GOLD (XAUUSD)
This week, I’ll be monitoring different scenarios, as price is currently far from any of my key Points of Interest (POIs).
My nearest potential buy is around the 3-hour demand zone. While it's not the most ideal entry—since it isn’t located in a discounted area—I’ll still keep an eye on it.
That said, I would prefer to see a deeper retracement into the 6-hour demand zone, which is in a far more discounted region. This zone offers a stronger setup, and I could see price launching from there again if tapped.
We’ve already seen a strong bullish reaction from last week’s demand zone, and based on current momentum, I could see price continuing upward until it reaches my next sell opportunity—the 3-hour supply zone, which sits at a premium level.
Confluences for GOLD Buys:
✅ Bullish structure — price has broken to the upside and remains overall bullish.
✅ Fresh 3H and 6H demand zones formed, which price could return to.
✅ Liquidity above — including trendline liquidity and previous Asia highs.
✅ Fundamentals — potential tariff cuts could fuel long-term bullish momentum for gold.
✅ Bearish Dollar Index (DXY) aligns with the bullish gold outlook.
📌 If price doesn’t retrace and instead continues to push higher, I’ll wait for another break of structure to the upside on the way toward the supply zone before reassessing entries.
Let’s stay focused and let the market come to us. Wishing everyone a great trading week ahead! 👊📈
Trend Analysis

Natural Gas is in the Buying DirectionHello Traders
In This Chart NATGAS HOURLY Forex Forecast By FOREX PLANET
today NATGAS analysis 👆
🟢This Chart includes_ (NATGAS market update)
🟢What is The Next Opportunity on NATGAS Market
🟢how to Enter to the Valid Entry With Assurance Profit
This CHART is For Trader's that Want to Improve Their Technical Analysis Skills and Their Trading By Understanding How To Analyze The Market Using Multiple Timeframes and Understanding The Bigger Picture on the Charts

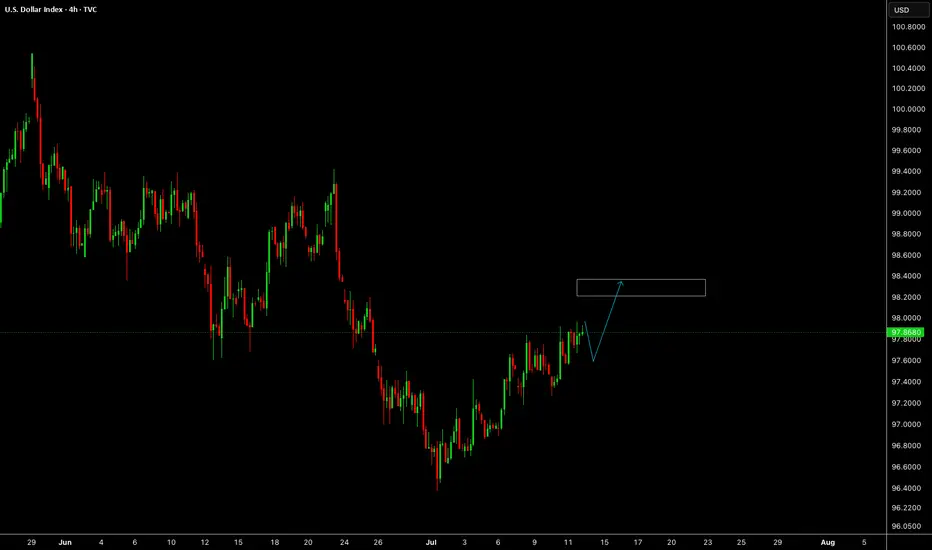
DXYDXY is still having some more correction to the upside before the major drop.
Disclosure: We are part of Trade Nation's Influencer program and receive a monthly fee for using their TradingView charts in our analysis.
GBP/USD Shorts from 3hr/5hr supply zoneMy analysis this week centers around the continuation of the bearish trend we've been observing. Recently, there was a break of structure, and a new supply zone has formed—indicating a potential continuation of the downtrend.
I’ll be waiting for price to retrace back into these Points of Interest (POIs), where I’ll look for lower time frame confirmations to catch potential sell entries and ride the move down.
I believe there’s still some bearish pressure left, and I expect price to continue falling until it reaches the 6-hour demand zone. Once we approach that area, I’ll begin looking for Wyckoff accumulation patterns as a signal for a potential reversal or rally to the upside.
Confluences for GBP/USD Sells:
✅ GBP/USD has been bearish over the past few weeks, and this trend may continue.
✅ Breaks of structure have occurred, forming fresh supply zones ideal for entries.
✅ Liquidity exists below current price, which may get swept before a reversal.
✅ The lower demand zone still needs to be mitigated, suggesting more downside movement first.
📌 If price fails to react properly at the 3-hour supply, I’ll be watching for a move into the 5-hour supply zone, which sits in a more premium area and may offer a cleaner reaction.
Let’s stay patient and focused — wishing everyone a profitable trading week ahead! 📉💼

EURJPY POSSIBLE EXPECTED MOVEIn this analysis we're focusing on 1H time frame. Today I'm looking for a potential buy move from my marked key levels. This is a higher time frame analysis. Let's analyze more deeply into smaller timeframe and potential outcomes. Confirmation is very important.
Always use stoploss for your trade.
Always use proper money management and proper risk to reward ratio.
This is my analysis.
#EURJPY 1H Technical Analysis Expected Move.

DOW JONES-MYM -SELL PREDICTIONThe market has created a new weekly high. Im expecting a short sell off in the upcoming week down into the weekly FVG. Then possible move to the upside.

SHORT ON SILVER XAG/USDSilver has given us a CHOC (change of character) on the lower timeframe with a nice retest to the supply zone.
Bears have shown up and I expect silver to drop seeking sell side liquidity to the next demand level.

Back above $3,300, GOLD may remain neutral, tax focusOANDA:XAUUSD reclaimed the psychologically important level of $3,300/ounce last week, but while gold is still receiving some support as a safe haven amid economic and geopolitical risks, its upside momentum may be limited as the market shifts its attention to other commodities.
Gold prices ended last week on a generally bullish note, rising back above $3,300 an ounce after US President Trump unexpectedly announced a series of new trade policies. Spot gold prices rose about 0.5% last week on Friday.
Although the market initially doubted Trump’s self-imposed July 9 deadline, the overall market reaction remained steady and the renewed risk appetite helped the S&P 500 hit a new record high, somewhat undermining gold’s safe-haven appeal. The July deadline has been pushed back to August 1, but the global trade conflict is far from over. Gold has regained support after initial pressure after Trump announced a new trade policy on copper imports, along with a series of news stories about the relationship between Trump and the FED sent to readers throughout the past week.
A sharp rise in copper prices will also add to inflationary pressures, exacerbate economic uncertainty and raise concerns about recession and stagflation. In this context, gold is expected to continue to receive support from potential risks.
In addition to fierce competition in the commodity market, gold may remain fundamentally neutral in the short term, as economic data will support the Fed's neutral monetary policy. The key market focus next week will be the June Consumer Price Index (CPI). The Fed has made it clear that it is in no rush to raise interest rates while inflation risks remain high.
However, traders still need to be cautious and closely monitor the situation surrounding the tariff war initiated by Trump, which will directly affect the price of gold. In case of negative news, the gold price will receive support and vice versa if positive news appears in the market.
Over the weekend, US President Trump once again used the tariff tactic, announcing that he would impose a 30% tax on imports from the EU and Mexico, causing a strong reaction from the international community. This move not only casts a shadow over the relationship between Europe and the United States, as well as between the United States and Mexico, but also adds further uncertainty to the global trade model. EU politicians, businesses and academics were quick to respond, calling for unity to protect their interests, while Mexico stressed the need to maintain national sovereignty and pledged to respond calmly.
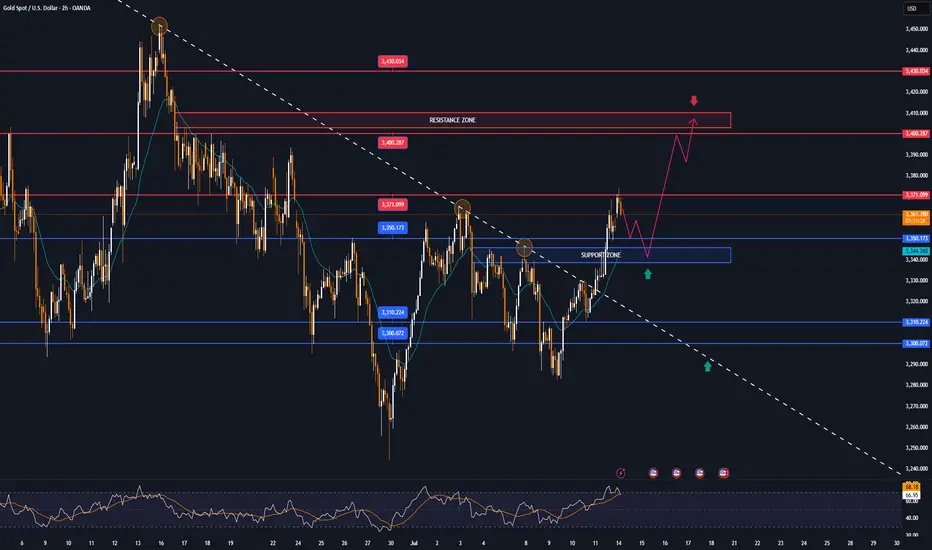
Technical Outlook Analysis OANDA:XAUUSD
On the daily chart, gold has a 3-day rally, and the upside momentum has reached the important target resistance at the 0.236% Fibonacci retracement level. Gold's upside momentum is also limited by this Fibonacci retracement level, specifically it has slightly dropped to $3,355/oz.
But overall, gold is still not in a position to form a specific trend, and the indicators and positions are mainly showing the possibility of continuing to accumulate sideways.
For gold to have the conditions for a new bullish cycle, it needs to bring price activity above the 0.236% Fibonacci retracement level, then the target will be around $3,400 in the short term, more than $3,430.
Meanwhile, a pullback, which sees gold sell below the 0.382% Fibonacci retracement, would open the door to a bearish cycle, with a target of around $3,246 in the short term, rather than the 0.50% Fibonacci retracement.
RSI hovering around 50 also suggests a hesitant market sentiment, so the short-term bias for gold is neutral.
Along with that, notable positions will also be listed as follows.
Support: $3,350 – $3,310 – $3,300
Resistance: $3,371 – $3,400 – $3,430
SELL XAUUSD PRICE 3406 - 3404⚡️
↠↠ Stop Loss 3410
→Take Profit 1 3398
↨
→Take Profit 2 3392
BUY XAUUSD PRICE 3340 - 3342⚡️
↠↠ Stop Loss 3336
→Take Profit 1 3348
↨
→Take Profit 2 3354
BTC NEXT TARGET BUY 110K MORE Bitcoin Alert! 🚨
BTC is showing strong momentum and the market is heating up! 🔥
Current levels present a strategic buy opportunity before the next big move.
📈 Targeting $110K–$115K in the coming wave — and the breakout could be explosive.
💰 Accumulate now before the FOMO kicks in.
📊 Smart traders are already positioning.
⏳ Time is limited — don’t watch from the sidelines.
This could be the move that defines the next phase of the bull run.
Stay ahead. Stay informed. Stay invested. 🧠🚀
#Bitcoin #BTC #CryptoAlert #BullRun #CryptoNews #BitcoinTarget #BTCNextMove #CryptoTradin

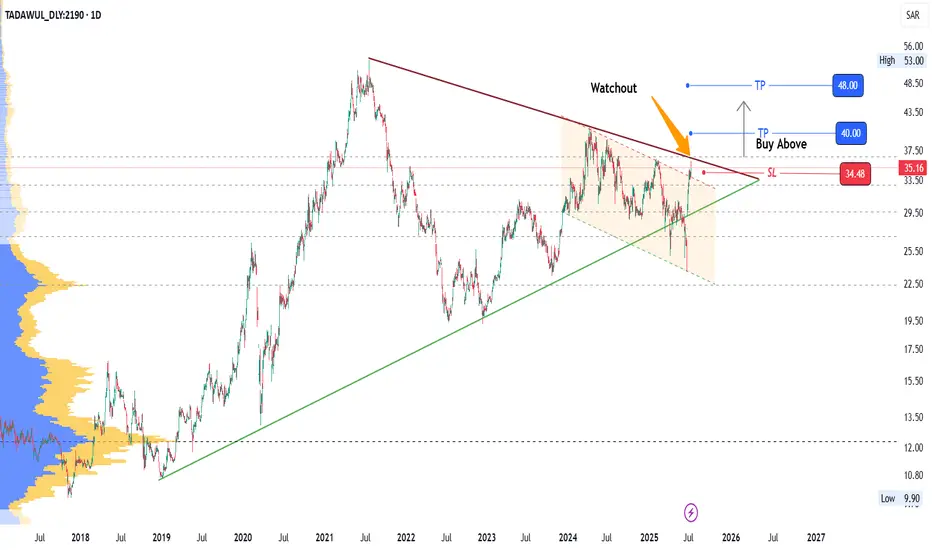
2190: Watch for Breakout2190 has reached Triangle Top (Trendline resistance) breaching a descending parallel channel resistance recently.
Watchout for the breakout of resistance.
Levels are marked.
Manage your risk with proper SL.
Enjoy the ride!
GBP_USD RISING SUPPORT AHEAD|LONG|
✅GBP_USD is going down now
But a strong rising support level is ahead
Thus I am expecting a rebound
And a move up towards the target of 1.3600
LONG🚀
✅Like and subscribe to never miss a new idea!✅
Disclosure: I am part of Trade Nation's Influencer program and receive a monthly fee for using their TradingView charts in my analysis.

DXY Previous weeks analysis and July 13 week ahead ideasDXY
July 13
July 7 to 11 DELIVERY NOTES
I suspected that price would gravitate for higher prices in last Sundays analysis, celebrate on
*up closed candle on the weekly, rebalancing SIBI from June 23 week
*Price retraced to close on equilibrium on the current range
*Monday delivered an expansion
*Tuesday retraced to Monday CE of the daily candle
*Wednesday consolidation
*Thursday retraced to a discount then reversed to take Mondays buy stops
*Friday expansion to make the high of the week closing on the CE of the FVG from Wed June 25
July 14 to 18 Ideas
Bear bias
*Since July 2 Price has been seeking higher prices, further example of trending market
*Price reaching equilibrium on the HTF range and buy side taken last week
*I suspect that price will retrace for sell side liquidity this week
*I anticipate for Price to gravitate towards the EV at 97.430 for the low target this week, possibly the noted equal lows from Monday July 7
*Friday's delivery was a in consolidation pattern
*Sundays delivery could gravitate to the noted equal highs and noted FVG
*I suspect that Price will expand to seek lower Prices for Mondays delivery
*Price expand higher in Sundays delivery, we could see Price retrace Fridays in FVG
No News Monday and Friday

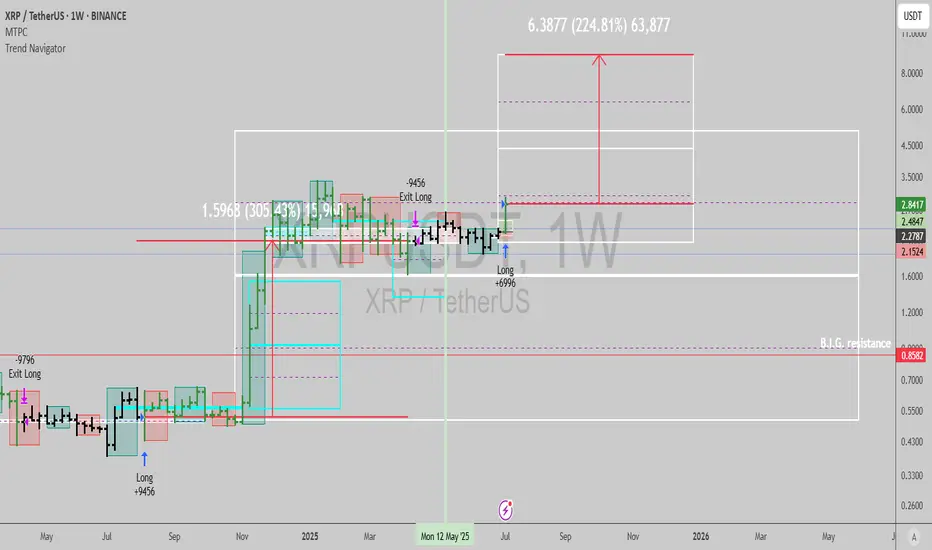
$XRP: Long term buy signalGN gents, interestingly, Ripple is one of the strongest charts in crypto currently, and it has flashed long term buy signals indicating the bull market continues NOW.
The last trade netted 305% upside, I estimate at least 224% can be achieved from here, with very low risk.
Best of luck!
Cheers,
Ivan Labrie.
BEARISH DOLLAR AHEADTechnically expecting a bearish dollar, looking at how the pullback was corrective to the 4h supply. The 4h supply zone is currently holding and is at the equilibrium of the fib. Although we also have an opening gap above that is at the discount array, I will observe that in case the 4h supply is violated. I expect the 4h supply to be respect and push prices lower. I will be flexible in case of any shifts. I expect the trend line liquidity to be swept to the origin.


KLV / Usdt GATEIO:KLVUSDT
📊 **Technical Analysis – KLV/USDT (4H):**
* 📍 **Current Price:** \$0.001968
* ⛔ **Immediate Resistance:** \~\$0.001980 – \$0.002000
* ✅ **Support Levels:**
* Minor support: \~\$0.001940
* Stronger support zone: \~\$0.001900
---
📈 **Market Structure & Scenario:**
The red lines and arrows in your chart show a **projected bullish scenario** with a **short-term dip** and **higher low** forming before a breakout.
1. 🔄 **Expected Retracement:**
A pullback to around **0.001940–0.001920** is expected, where price may build a **base or liquidity grab**.
2. 🔼 **Bullish Continuation:**
If that support holds, a strong move upward could follow — potentially retesting **0.002060–0.002100** area (previous highs).
3. ❗ **Invalidation Zone:**
A close **below \$0.001900** may break the structure, making the bullish scenario less likely.
---
🧠 **Summary:**
* Structure suggests **accumulation**, not a confirmed breakout yet.
* Market might form a **W pattern** (double bottom) before a launch.
* Wait for a retest + bullish confirmation candle if you’re entering long.
---
⚠️ **Not Financial Advice** – use proper risk management and always check volume & news for confirmation.

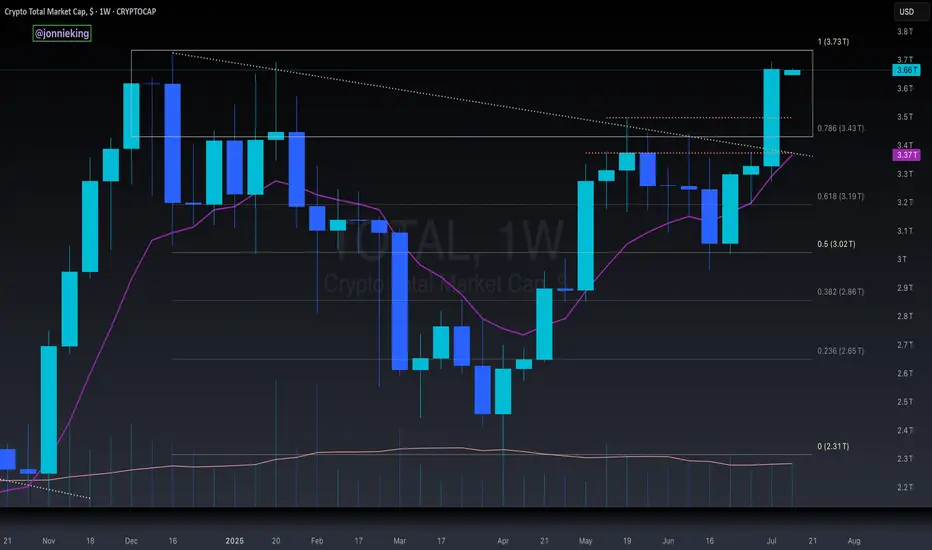
$TOTAL CRYPTO MARKET CAP BREAKOUT CONFIRMEDWhat a FILTHY Weekly Close back within the POI 🚀
Bulls are back in biz, for at least the next few weeks.
I’m expecting a bit of sideways chop here, and the next leg up the first or second week of August.
This is in no way, shape or form a call for “ALT SEASON”, yet.
Still need to see what happens in the next few weeks,
BUT IT LOOKS PROMISING 🙏
Will Ethereum reach 15K soon?In my video I share why is it possible for Eth to reach 14-17K in the next months.
Disclaimer: Not a financial advice

AUDCAD | Weekly Outlook | July 14, 2025🟦 AUDCAD | Weekly Outlook | ICT-Based Analysis
📅 Week Starting: July 14, 2025
🧠 "Don't chase — let the trade come to you."
🧭 Market Context (1H + HTF Alignment)
This chart outlines a clear Smart Money framework for AUDCAD using ICT principles. The market recently completed a manipulation phase below a major accumulation zone, forming a clear SMT divergence and respecting a CISD (Clean Internal Sell-side Displacement).
After manipulation and SMT confirmation, price respected the CISD and showed willingness to displace bullishly, suggesting a potential re-accumulation phase on the lower timeframes.
🔍 Key Observations
Accumulation + SMT:
We had a prolonged accumulation phase that led to a smart money manipulation (fakeout), marked by SMT divergence. This was followed by a bullish shift in structure, confirming intent.
CISD + CE Reaction:
Price respected the CISD zone and formed a bullish W reversal + OB/BI setup. This is a common ICT pattern before major expansions.
Re-Accumulation Area:
The current consolidation near ERL levels shows signs of controlled accumulation, with price respecting previous liquidity levels.
This area may act as a springboard for expansion towards HTF objectives.
📈 HTF Targeting: Reversal Area + EQH
The chart marks a High Time Frame Reversal Area (HTF) above the current price, potentially acting as a premium inefficiency or sell-side liquidity target.
EOH (Expansion Objective High) is drawn in that same region, providing a long-term magnet for price.
This aligns with the broader Monthly Cycle expectation.
🔄 Monthly Cycle Analysis
“Monthly Cycle is Created — Open, Low... Now We Wait for the High and Close.”
This suggests:
Monthly Open and Low are already formed.
A bullish monthly cycle is anticipated — meaning we're waiting for the High to form next.
Once the high is set, a retracement towards the Close level is expected by the end of the month.
This macro view gives us context for aiming long positions on pullbacks — buying dips within the re-accumulation range.
⚠️ Trader's Insight
Don’t Chase — Let the Trade Come to You.
The setup is not about chasing price. Instead, the idea is to:
Wait for price to return to favorable zones (e.g., CE of OB inside CISD)
Confirm intent with LTF SMT, FVGs, or M15 structural shifts
Target HTF inefficiencies and liquidity zones (EOH & Reversal Area)
🎯 Bias for the Week
Bullish, based on:
Monthly cycle direction (expecting HIGH)
Price behavior post-CISD respect
Clear smart money accumulation and displacement
Re-accumulation on LTFs suggesting continuation

EUR-CHF Local Long! Buy!
Hello,Traders!
EUR-CHF is about to retest
The strong horizontal support
Of 0.9298 and as the pair
Is locally oversold we will be
Expecting a local bullish
Rebound and a move up
Buy!
Comment and subscribe to help us grow!
Check out other forecasts below too!
Disclosure: I am part of Trade Nation's Influencer program and receive a monthly fee for using their TradingView charts in my analysis.

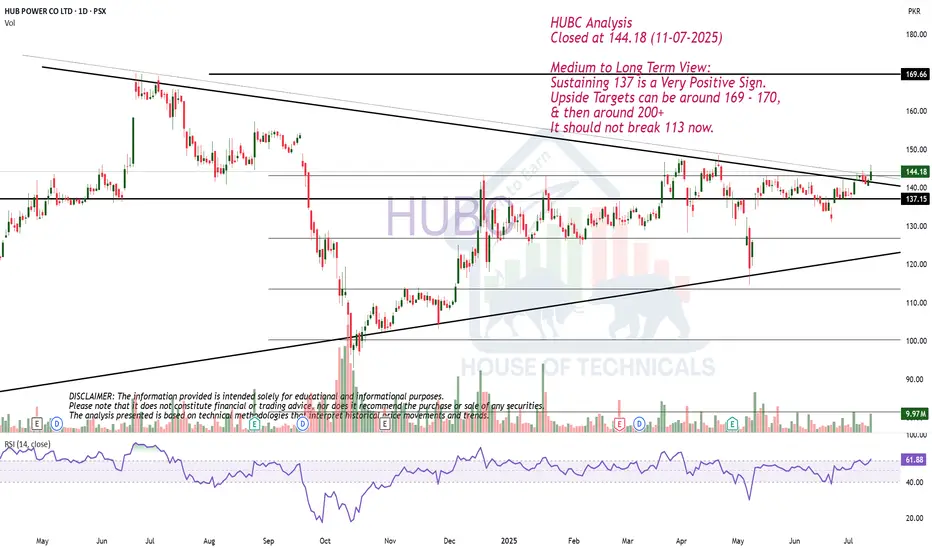
Medium to Long Term View.HUBC Analysis
Closed at 144.18 (11-07-2025)
Medium to Long Term View:
Sustaining 137 is a Very Positive Sign.
Upside Targets can be around 169 - 170,
& then around 200+
It should not break 113 now.
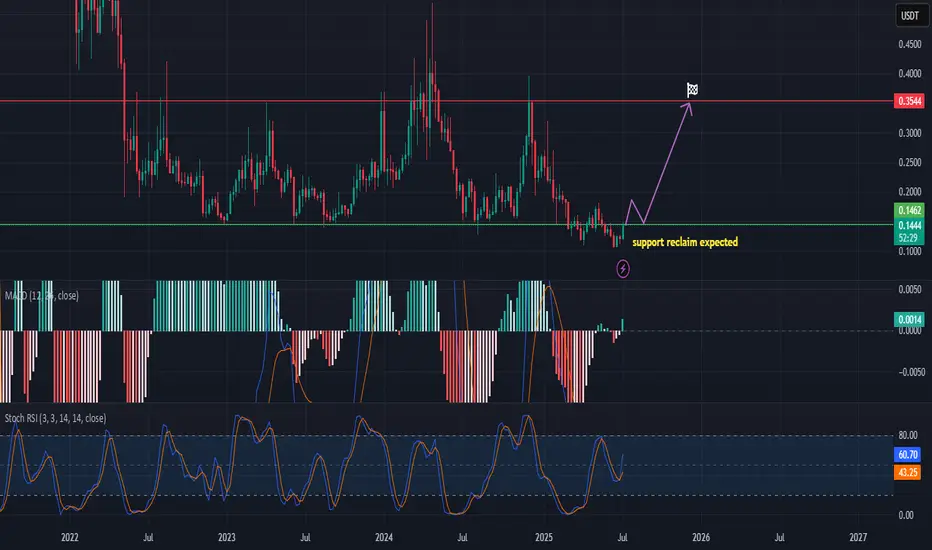
ONTUSDT may turn bullish soonhi traders
The chart suggests that ONT has reached a critical support level around $0.146, which has historically acted as a significant zone for both support and resistance. The price is currently attempting to reclaim this level, and a bullish reversal is expected if it holds.
Indicators Analysis:
MACD (Moving Average Convergence Divergence):
The MACD line has recently crossed above the signal line.
Histogram bars have flipped to green, suggesting a shift in momentum toward the upside.
This crossover is typically seen as an early bullish signal.
Stochastic RSI:
The Stochastic RSI is recovering from the oversold region.
%K line (blue) is at 60.63, and %D (orange) is at 43.22.
This upward crossover reinforces a potential trend reversal and momentum building for the bulls.
Prediction & Strategy:
The purple projection line on the chart suggests a possible upward move:
Short-term pullback and retest of the support zone (~$0.146).
Followed by a strong breakout toward the $0.35 level, marking a potential 2.4x gain from current levels.
The chart is annotated with “Support reclaim expected,” indicating that if ONT successfully retests and confirms this support, it would present a buy opportunity.
Conclusion:
📌 Buy signal is triggered if ONT/USDT confirms a reclaim of the $0.146 support level.
📈 Both the MACD and Stochastic RSI support a bullish reversal.
🎯 The next major resistance sits at $0.3544, offering significant upside potential.
Watch closely for confirmation of support holding before entering a long position.