Apple (AAPL) Shares Jump Following Earnings ReportApple (AAPL) Shares Jump Following Earnings Report
Yesterday, after the close of the regular trading session, Apple released its earnings report, which surpassed analysts’ expectations:
→ Earnings per share: actual = $1.57, forecast = $1.43;
→ Revenue: actual = $94.04 billion, forecast = $89.35 billion.
As a result, AAPL shares surged in the post-market, rising from $207.57 to $212.51.
Media Commentary:
→ The company reported a 13% year-on-year increase in iPhone sales.
→ However, according to Tim Cook, tariffs have already cost the company $800 million and this figure could exceed $1 billion in the next quarter.
Technical Analysis of the Apple (AAPL) Stock Chart
Following the volatility in April 2025, price action has justified the construction of an ascending channel (marked in blue). The $216 level, which has acted as a key reference point since March, remains a significant resistance area, because:
→ It has consistently prevented AAPL from reaching the upper boundary of the channel;
→ Even in the wake of a strong earnings report, the price failed to break through this level in post-market trading.
If the $216 level continues to cap gains in the coming days – despite the positive report – the stock might pull back towards the median line of the blue channel (following the post-market rally). This zone often reflects a balance between supply and demand. While such a retracement would appear technically justified, it may raise concerns among shareholders, particularly when compared to the more aggressive price rallies seen in the shares of other tech giants, such as Microsoft (MSFT), as we discussed yesterday.
From a more pessimistic perspective, peak A may turn out to be yet another lower high within a broader bearish structure that has been forming on the AAPL chart since December 2024, when the stock reached its all-time high around the $260 level.
This article represents the opinion of the Companies operating under the FXOpen brand only. It is not to be construed as an offer, solicitation, or recommendation with respect to products and services provided by the Companies operating under the FXOpen brand, nor is it to be considered financial advice.
Trend Analysis

#DATA (SPOT) BINANCE:DATAUSDT
#DATA/ USDT
Entry range (0.01500- 0.01600)
SL 4H close below 0.00.01498
T1 0.0180
T1 0.0198
_______________________________________________________
Golden Advices.
********************
* collect the coin slowly in the entry range.
* Please calculate your losses before the entry.
* Do not enter any trade you find it not suitable for you.
* No FOMO - No Rush , it is a long journey.

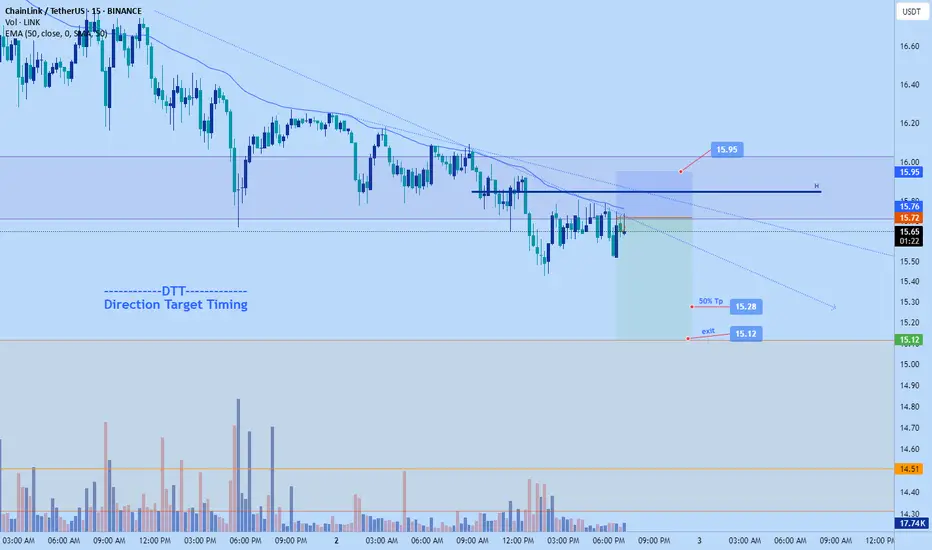
Chainklink further dump to $15.12Just now opened a short position on chainlink.
Aiming for $15.12 area
2-2.61RR
DTT strategy applied.
Time sensitive
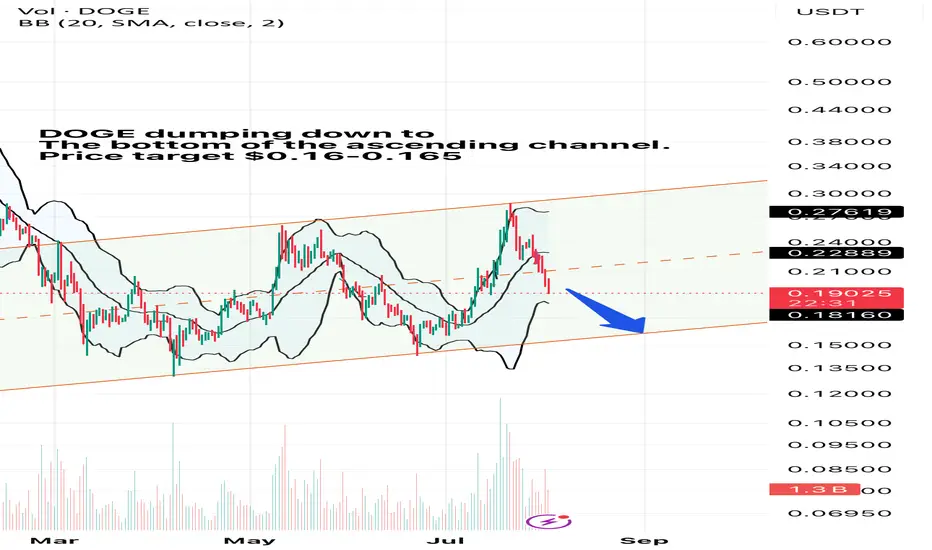
DOGE dumping will end soon.DOGE has been moving within the ascending channel. After hitting the upper resistant level of the channel, it has been dumping since then. Currently heading down to the bottom of the channel. Price Target $0.16-0.165
Bitcoin Still has Room to Run - Here's One Reason WhyWhen we zoom out and look at Bitcoin on a logarithmic scale, a clear pattern emerges.
In this chart, I’ve marked each cycle top with a vertical blue line. These peaks are almost perfectly spaced — roughly four years apart, aligning with Bitcoin’s halving cycles. From 2013 to 2017 to 2021, and now projecting into the next expected top near late 2025 or early 2026, this cyclical rhythm has held remarkably steady.
But it’s not just time — it’s structure.
Overlayed on the chart is a standard deviation framework, with the center line acting as a mean reversion anchor. Every major cycle has seen Bitcoin reach the second standard deviation above the mean before topping out.
Where are we now?
Still below the halfway mark.
As of today, Bitcoin hasn’t even reached the +1 standard deviation level. Historically, price accelerates toward the upper bounds of this channel as the cycle matures — and we haven’t seen that blow-off phase yet.
In other words:
Bitcoin still has room to grow.
We’re not late — we’re mid-cycle.
Let the headlines panic. The structure is calm.
And the structure says: higher.

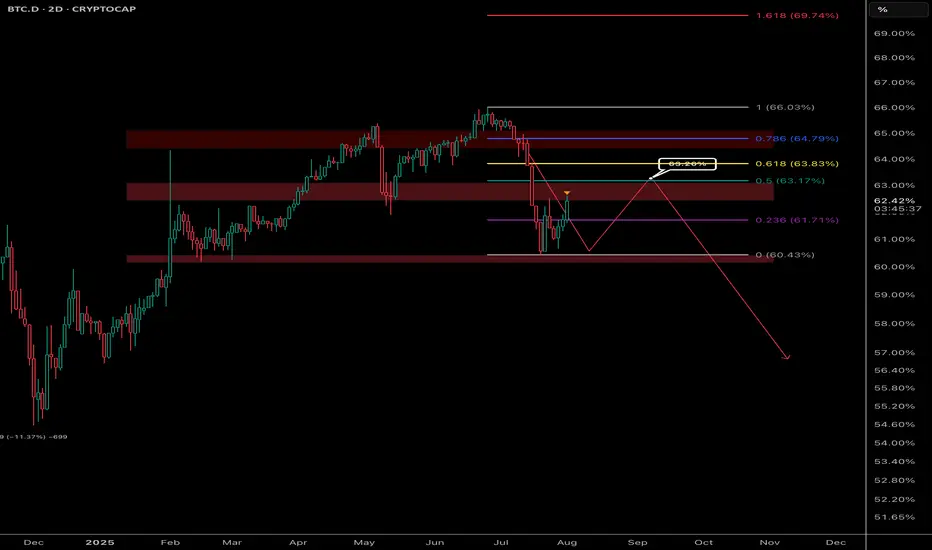
Bitcoin Dominance (BTC.D) – Key Levels Ahead
BTC dominance is climbing into a major resistance zone after a steep drop. The current structure hints at a possible lower high forming, which could be bearish if it gets rejected around 63.2%.
🟥 If rejected from resistance:
Could mark a continuation of the downtrend in BTC dominance.
This may signal money rotating out of BTC and into altcoins — potential altseason vibes ahead.
🟩 If it breaks above:
The dominance trend may continue higher.
That would indicate capital flowing back into BTC, possibly showing risk-off sentiment or market uncertainty.
🎯 Key zones to watch are where dominance stalls or breaks — market rotation depends on this move.
Trumpcoin short to $8.292Just now opened up a short position on Trumpcoin. Market is low and soon I anticipate reversal to the upside but not just yet. Based on my DTT analysis market is likely to make new lows ago.
Sl: $8.745
Time sensitive

TON is bearish now and many Traders don't see it !The fact that most cryptocurrencies are bearish while Toncoin hasn't seen a significant drop yet is somewhat suspicious, and sooner or later, the price is likely to fall. I expect the price to be bearish by the start of the new week.

btcThis is not a signal.
Just my outlook on BTC based on data
No fluff
No fancy indicators
And definetly no rectangles
Just watch and see how it plays out, as we are currently in a big indecision zone as well as the weekend I would not enter any positions now but rather wait for monday-wednesday to enter.


Inflection Zone, Do or Die levelI've drawn up a couple of major pivot points that I expect BITSTAMP:BTCUSD to consolidate at before continuing either up or down.
The market is in my opinion currently feeling a little bit confused and not quite fearful yet but a little bit doubtful anyway. The melt up has been real, and for some painful, as directional movement is at most only half of what matters. So this injection of volatility is welcomed at least by me, and I've been fairly exposed to growth stocks in my port lately.
Based on fibonacci phi channels and other confluences of support locations, it looks like we've turned a corner and are on the way down, but I'd be surprised if we breached 107k and as shown, if that did happen, there is a LOT of underlying supply.
I don't know where we go from here but I wanted to point out this level highlighted in light blue, as its historically been a major line in the sand for BTC.


Bitcoin Overall: Still Expecting new ATHIndicated are the supports I’m watching. If price goes below the ‘invalidation leg’ I consider the btc bull market to be over.

[ayana] TFPS Report: Is Bitcoin Ignoring a Clear Warning?⚡️ TFPS Report: Is Bitcoin Ignoring a Clear Warning from Wall Street?
Analysis for: #Bitcoin (INDEX:BTCUSD, 4H) | August 02, 2025
Traditional financial markets (TradFi) are sending a clear bearish signal, and they're leading Bitcoin's price moves with high confidence. A significant divergence has appeared: while the long-term strategic link to crypto is very strong, the immediate tactical influence is currently low.
📊 Data Snapshot in Detail:
▪️ TFPS Score: -26.59 (Bearish Pressure) 🔴
▪️ Wall St. Influence (R²): Tactically Low (16% over 24h), but Strategically Very High (78% over 30d).
▪️ Market Condition (Z-Score): Normal (0.2).
▪️ Pacesetter (Lead/Lag): TradFi is leading Crypto by 6 bars (24 hours) with High Confidence (56.1% CI).
▪️ Key Drivers: A mix of declining Risk Appetite ( AMEX:SPY at 30.21%) and rising Market Stress ( TVC:VIX at 29.75%).
🎯 Actionable Insight for Traders:
The environment signals an underlying Risk-Off Phase. Caution is advised; be wary of the divergence. The high strategic R² (78%) and high-confidence lead from TradFi suggest the underlying bearish pressure is significant and should not be ignored. The current low tactical R² (16%) could be a temporary lag before Bitcoin's price realigns with the broader market sentiment. Watch the key drivers ( AMEX:SPY , TVC:VIX ) closely for signs that this divergence is closing.
#Bitcoin #TFPS #MacroAnalysis #TradFi BITSTAMP:BTCUSD

BONKUSDT – Let the Market Come to YouIn a possible Q3 correction, BONKUSDT may retest the green box zones below.
These areas are not predictions — they’re prepared zones where I’ll be waiting, not chasing.
🟩 I don’t buy strength blindly. I buy value with structure.
All risk-on markets typically experience significant corrections in the third quarter of the year and struggle to recover from this correction until the end of the year.
🎯 My Strategy
🔔 Set alerts for the green boxes
🕐 Switch to the 1-hour timeframe when triggered
📈 Wait for upward breakout + positive CDV
🎯 Only then: take the shot — one bullet, risk-managed
“Markets reward those who wait with a plan, not those who rush with emotion.”
Let’s stay patient, structured, and consistent.
— UmutTrades 💙
📌I keep my charts clean and simple because I believe clarity leads to better decisions.
📌My approach is built on years of experience and a solid track record. I don’t claim to know it all but I’m confident in my ability to spot high-probability setups.
📌If you would like to learn how to use the heatmap, cumulative volume delta and volume footprint techniques that I use below to determine very accurate demand regions, you can send me a private message. I help anyone who wants it completely free of charge.
🔑I have a long list of my proven technique below:
🎯 ZENUSDT.P: Patience & Profitability | %230 Reaction from the Sniper Entry
🐶 DOGEUSDT.P: Next Move
🎨 RENDERUSDT.P: Opportunity of the Month
💎 ETHUSDT.P: Where to Retrace
🟢 BNBUSDT.P: Potential Surge
📊 BTC Dominance: Reaction Zone
🌊 WAVESUSDT.P: Demand Zone Potential
🟣 UNIUSDT.P: Long-Term Trade
🔵 XRPUSDT.P: Entry Zones
🔗 LINKUSDT.P: Follow The River
📈 BTCUSDT.P: Two Key Demand Zones
🟩 POLUSDT: Bullish Momentum
🌟 PENDLEUSDT.P: Where Opportunity Meets Precision
🔥 BTCUSDT.P: Liquidation of Highly Leveraged Longs
🌊 SOLUSDT.P: SOL's Dip - Your Opportunity
🐸 1000PEPEUSDT.P: Prime Bounce Zone Unlocked
🚀 ETHUSDT.P: Set to Explode - Don't Miss This Game Changer
🤖 IQUSDT: Smart Plan
⚡️ PONDUSDT: A Trade Not Taken Is Better Than a Losing One
💼 STMXUSDT: 2 Buying Areas
🐢 TURBOUSDT: Buy Zones and Buyer Presence
🌍 ICPUSDT.P: Massive Upside Potential | Check the Trade Update For Seeing Results
🟠 IDEXUSDT: Spot Buy Area | %26 Profit if You Trade with MSB
📌 USUALUSDT: Buyers Are Active + %70 Profit in Total
🌟 FORTHUSDT: Sniper Entry +%26 Reaction
🐳 QKCUSDT: Sniper Entry +%57 Reaction
📊 BTC.D: Retest of Key Area Highly Likely
📊 XNOUSDT %80 Reaction with a Simple Blue Box!
📊 BELUSDT Amazing %120 Reaction!
📊 Simple Red Box, Extraordinary Results
📊 TIAUSDT | Still No Buyers—Maintaining a Bearish Outlook
📊 OGNUSDT | One of Today’s Highest Volume Gainers – +32.44%
📊 TRXUSDT - I Do My Thing Again
📊 FLOKIUSDT - +%100 From Blue Box!
📊 SFP/USDT - Perfect Entry %80 Profit!
📊 AAVEUSDT - WE DID IT AGAIN!
I stopped adding to the list because it's kinda tiring to add 5-10 charts in every move but you can check my profile and see that it goes on..


BTC at Make-or-Break: Rejection or Liftoff to $130K?
Bias/Summary
BTC is at a critical zone between 109K–112K. Price is currently showing hesitation after initial rejection at the Yearly L3 (112K), and I’m leaning short unless we see a strong breakout and hold above that level. However, if bulls reclaim it, we could see a fast move to 130K before many can react.
Technical Context:
Yearly L3 sits around the $112K zone – a historically significant level.
Price faced rejection at $112K and is now hovering near $109K.
Lower timeframe showing indecision, possible bearish bias.
Watching for:
Rejection + lower high below $112K = short setup.
Clean breakout + retest of $112K = shift to long bias.
Trade Idea / Setup:
🟥 Scenario A – Short Bias (Current Leaning):
Entry: 110K–111.5K (if rejection confirms)
Stop Loss: Above 112.5K
Targets:
TP1: 104K
TP2: 99K
TP3: 94K
R:R: Up to 3.5:1 depending on entry and target
🟩 Scenario B – Breakout Long (Contingent Setup):
Entry: 113K+ (after breakout and solid retest)
Stop Loss: Below 111K
Targets:
TP1: 120K
TP2: 130K
R:R: ~3:1 or more if momentum confirms
Risk & Patience Reminder:
⚠️Let price lead. No breakout = no long. No clear rejection = no short. Wait for confirmation, and don’t force entries in the chop.
Patience > Prediction.
NFA. DYOR. Manage your risk.

HBARUSDT – Planning Ahead, Not Reacting Late In the event of a potential Q3 correction, I believe HBARUSDT could revisit the green box zones below.
These areas aren’t guaranteed bounce points — but they represent fair value in a market pullback scenario.
🧭 How I’m Preparing
📌 No blind orders
📌 Set alerts at the green zones
📌 When price hits, switch to 1-hour
📌 Wait for upward breakout + rising CDV
If it aligns, I take the trade — one bullet only.
"The smart investor doesn’t fear the correction — they prepare for it."
No rush. No panic. Just discipline.
Let’s stay ready.
— UmutTrades 💙
📌I keep my charts clean and simple because I believe clarity leads to better decisions.
📌My approach is built on years of experience and a solid track record. I don’t claim to know it all but I’m confident in my ability to spot high-probability setups.
📌If you would like to learn how to use the heatmap, cumulative volume delta and volume footprint techniques that I use below to determine very accurate demand regions, you can send me a private message. I help anyone who wants it completely free of charge.
🔑I have a long list of my proven technique below:
🎯 ZENUSDT.P: Patience & Profitability | %230 Reaction from the Sniper Entry
🐶 DOGEUSDT.P: Next Move
🎨 RENDERUSDT.P: Opportunity of the Month
💎 ETHUSDT.P: Where to Retrace
🟢 BNBUSDT.P: Potential Surge
📊 BTC Dominance: Reaction Zone
🌊 WAVESUSDT.P: Demand Zone Potential
🟣 UNIUSDT.P: Long-Term Trade
🔵 XRPUSDT.P: Entry Zones
🔗 LINKUSDT.P: Follow The River
📈 BTCUSDT.P: Two Key Demand Zones
🟩 POLUSDT: Bullish Momentum
🌟 PENDLEUSDT.P: Where Opportunity Meets Precision
🔥 BTCUSDT.P: Liquidation of Highly Leveraged Longs
🌊 SOLUSDT.P: SOL's Dip - Your Opportunity
🐸 1000PEPEUSDT.P: Prime Bounce Zone Unlocked
🚀 ETHUSDT.P: Set to Explode - Don't Miss This Game Changer
🤖 IQUSDT: Smart Plan
⚡️ PONDUSDT: A Trade Not Taken Is Better Than a Losing One
💼 STMXUSDT: 2 Buying Areas
🐢 TURBOUSDT: Buy Zones and Buyer Presence
🌍 ICPUSDT.P: Massive Upside Potential | Check the Trade Update For Seeing Results
🟠 IDEXUSDT: Spot Buy Area | %26 Profit if You Trade with MSB
📌 USUALUSDT: Buyers Are Active + %70 Profit in Total
🌟 FORTHUSDT: Sniper Entry +%26 Reaction
🐳 QKCUSDT: Sniper Entry +%57 Reaction
📊 BTC.D: Retest of Key Area Highly Likely
📊 XNOUSDT %80 Reaction with a Simple Blue Box!
📊 BELUSDT Amazing %120 Reaction!
📊 Simple Red Box, Extraordinary Results
📊 TIAUSDT | Still No Buyers—Maintaining a Bearish Outlook
📊 OGNUSDT | One of Today’s Highest Volume Gainers – +32.44%
📊 TRXUSDT - I Do My Thing Again
📊 FLOKIUSDT - +%100 From Blue Box!
📊 SFP/USDT - Perfect Entry %80 Profit!
📊 AAVEUSDT - WE DID IT AGAIN!
I stopped adding to the list because it's kinda tiring to add 5-10 charts in every move but you can check my profile and see that it goes on..

EURCAD ShortConfluence
1. Break and retest of the trendline
2. Order block in 1H
3. 61.8% Fib zone
It's a good spot to catch a clean 1:2. Wait for confirmation on either 1H or 2H timeframe to enter.
Good luck...

Ethereum - The moment of truth!🔬Ethereum ( CRYPTO:ETHUSD ) trades at a key breakout level:
🔎Analysis summary:
Ethereum - after consolidating for the past four years - is once again retesting the previous all time high. And before we will witness another bearish rejection, Ethereum has the chance to finally break out of the long term triangle pattern. It's time for us to start praying.
📝Levels to watch:
$4.000
SwingTraderPhil
SwingTrading.Simplified. | Investing.Simplified. | #LONGTERMVISION

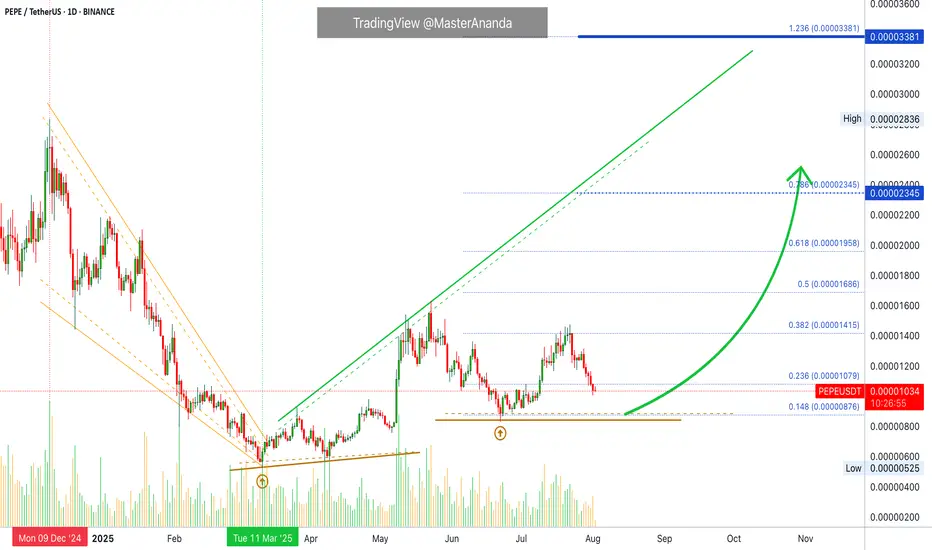
PEPE Will Turn Bullish · Strong Chart StructureThe market is one. We are all one and the same.
Crypto is one, and all the pairs move in the same way. Not in the exact same manner but the broader direction always tend to be the same.
PEPE is great because it reveals that the market isn't likely to go much lower. Since they all move together, the fact that PEPE will recover reveals that the others will recover.
PEPE grew in late 2024 together with the rest of the market. The first part of 2025 was a correction and the lows started to come-in in March and April. The first high in May, exactly the same as the rest of the market. A higher low in June and another high in July. Now a new retrace.
PEPEUSDT is trading on a very strong structure. We have a higher low from June but also from March. This makes it very unlikely that PEPE will produce a new low in this correction, which means that even now the correction is reaching its end. Volume is very low. If it isn't over then one major flash crash and the next day full green. That's how close we are from change.
Technical analysis
The market downtrend ended in March this year. From a low point PEPEUSDT switched from bearish to bullish. The trading is now happening within a bullish chart.
The main move peaked in May and the market is consolidating before additional growth. The action stays kind of sideways, mid-range, which shows that we are seeing consolidation. Consolidation always precedes a wave of growth, specially when the action is happening across marketwide support.
Namaste.
ETHUSD Break- Test- GO!!! Nothing Changed! 3rd EditionI have been warning about this for some time. Please visit my previous two posts for more info and updates.
Magic!
Click boost, follow, and subscribe for more. Let's get to 5,000 followers ))

SolSolana is currently in a correction phase, and a strong demand is forming near the 151 area.
As per the rules, the market should ideally start buying from here.
