Trend Analysis
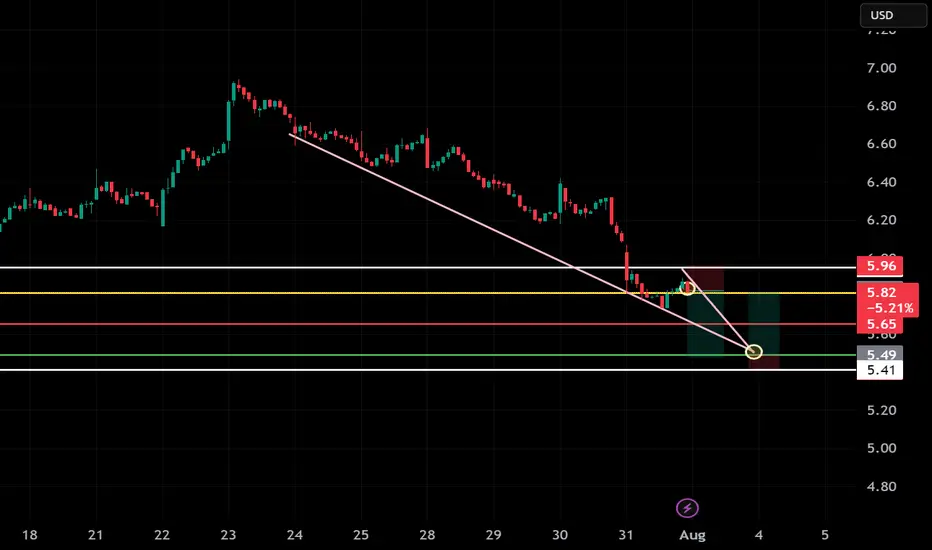
“STKL Rejection — Short Trade in Control”📉 Trade Setup (30m Chart):
STKL is in a strong downtrend, showing rejection at the falling trendline and horizontal resistance. Price is respecting structure — clean short setup.
🎯 Short Plan:
→ Entry: $5.82
→ Stop Loss: $5.96
→ Target: $5.41
📌 Breakdown continuation + trendline resistance = short with solid R:R. @tcarpenter1227
Still bullish in the higher time frames Solana has been struggling to break and stay above $170-200 zone this cycle.
It has been a very difficult asset to trade, however, I can see more bullish setups than bearish setups in higher timeframe charts.
Monthly:
1) July monthly candle closed above Fib 0.618 and formed higher high higher low.
2) RSI and MACD are still in the bull zone.
3) Stochastic are in the bear zone, but they are pointing to the upside.
Weekly:
1) EMA21 is still above EMA55.
2) The current weekly candle is forming bearing engulfing candle, however, there are two more days before it closes. It is still above EMA 21.
3) RSI orange line (RSI based moving average) is moving upwards and entering the bull zone.
4) MACD is about to enter the bull zone.
5) Stochastic hasn't reached overbought territory yet.
6) The set up of these three momentum indicators is very similar to the set up in Oct 23 before Solana started a massive bull trend. (see red vertical line)
Daily:
1) EMA21>EMA55>EMA200
2) As I said in the previous articles, EMA 55 and 200 don't cross easily. But when they do, the price often pulls back significantly before it starts to move in the direction of the trend.
3) Daily candle broke below EMA21, however, the price is reacting strongly to EMA55.
4) The price is still higher high higher low.
I will wait and see if the price is going to bounce off from $143 -157 region. (see blue rectangular block).

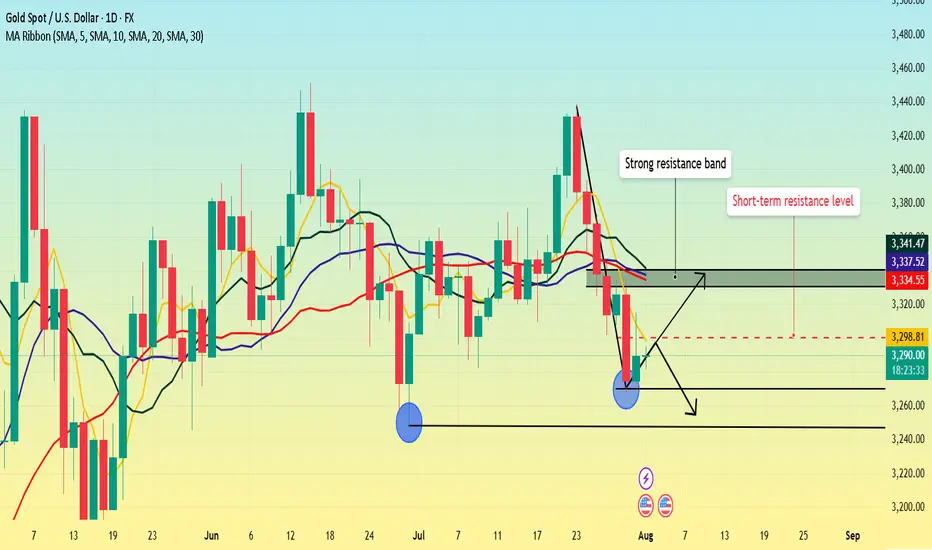
Non-farm payrolls are coming. What's the gold trend?Gold fell sharply on Wednesday, but Thursday's market didn't continue the downward trend as some investors expected. Instead, it showed a trend of rising and then falling.
From the daily perspective, we first need to focus on the resistance level near 3300 where the 5-day moving average is located. This position is not only a short-term technical resistance, but also reflects the market's psychological expectations to a certain extent. If prices can successfully break through this level and stabilize above it, it will indicate that bullish momentum is strengthening, potentially boosting market sentiment. At this point, the next resistance area to watch is the 3330-3340 range. This area converges the 10-day, 20-day and 30-day moving averages, forming a strong resistance band.
As for the support below, the primary focus is Wednesday's low of 3268. However, if this level is lost and the price continues to fall, the next support area will be around 3245, which is the previous low.
Trading strategy:
Short around 3300, stop loss at 3310, profit range 3280-3260.
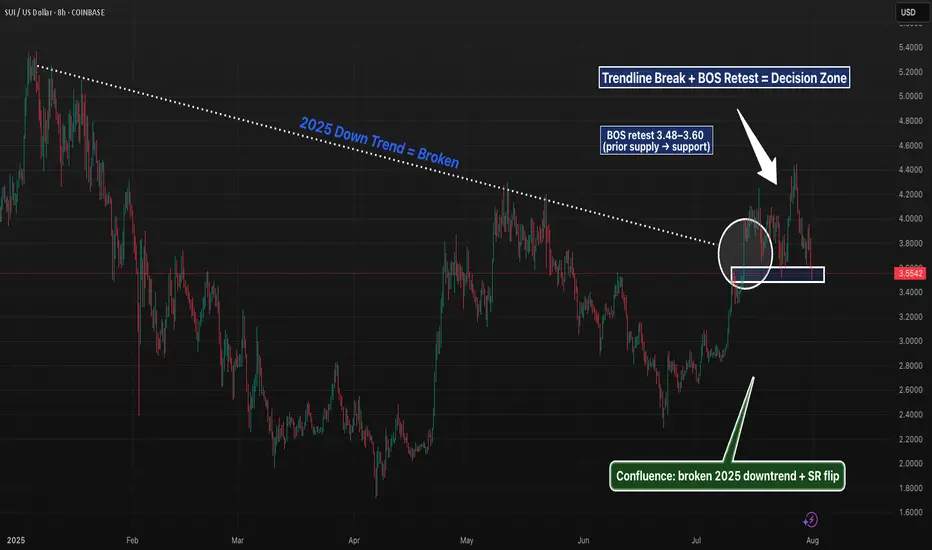
SUI 8H – Trendline Break, BOS Retest, and SR FlipSUI is at a pivotal level after cleanly breaking its 2025 downtrend and flipping prior supply into potential support. The current zone ($3.48–$3.60) marks a textbook BOS retest, aligning with the broken trendline and a clear structure shift.
Price has already printed a higher high, and if this zone holds, it could establish a higher low — a key confirmation for bullish continuation. Momentum traders may watch for reclaim of $3.70 for confluence, while invalidation sits below $3.32.
A break lower opens the door to deeper retracement targets around the 0.618 zone ($3.32–$3.38), but structure remains intact until then. Clean price action, strong confluence, and a clear invalidation level make this an actionable zone to watch.
📊 Structure: BOS → Retest
🧠 Bias: Bullish if $3.48–$3.60 holds
📉 Invalidation: 8H close below $3.32
🔔 Next key levels: $3.90, $4.10, $4.45
When the Fed cuts rates, it's bad news for Markets SPXIn 2000, 2007 and 2020, the markets crashed when the Fed started cutting rates or 1-2 months after.
Sell your stocks and crypto close to the time the Fed starts cutting rates.
History will repeat.

XRP 4H + 67% From MACD Trend Entry, But Is the Pullback Real?This XRP move was a masterclass in filtered momentum trading. The MACD Liquidity Tracker Strategy (Normal Mode) skipped early chop, then fired long once MACD aligned with a reclaim of the 60/220 EMAs — signaling a clean directional shift.
The strategy held through a +67.18% rally, exiting only when MACD flipped bearish and price lost EMA support. From ~$2.12 to ~$3.54, the move was captured in full with zero re-entries or second guessing.
Now price is under pressure, printing pink bars and sitting below both EMAs. The $2.90–$3.00 zone may determine if this is a healthy pullback — or the start of a reversal.
📊 MACD: 25 / 60 / 220
Trend Filter: 60/220 EMA
Mode: Normal | Timeframe: 4H
Educational chart. Drop your take.

GOLD & BTC analysisWe did a detailed analysis on Gold and BTC to have our directional bias and we kick off the month of August with a profitable setup.

GBPJPY – Losing control zone, downtrend taking shapeGBPJPY is still trading within a long-term ascending price channel. However, what’s concerning is that recent price action has broken out of the previously established price box – which had acted as a stabilizing structure for the uptrend. Buyers failed to maintain momentum, repeatedly getting rejected at the top of the box.
Currently, GBPJPY is showing signs of breaking below the short-term support inside the price box, raising the risk of a deeper correction toward the lower boundary of the channel. A “lower high” structure is clearly forming, confirming that selling pressure is taking over.
From a news perspective, the Japanese yen is gaining strength as risk-off sentiment increases, while the pound is losing ground due to cautious tones from the Bank of England following a string of weak economic data. This shift is weakening GBP's appeal and could accelerate the bearish trend.
Strategy:
Wait to SELL if price pulls back to the former resistance zone within the price box and shows rejection signals. The downtrend will be confirmed if the recent low is broken. Stay out if there’s no clear confirmation.
What do you think will happen next with GBPJPY?

EURUSD plunges without brakes – The bears take full control!EURUSD continues its steep decline as both macroeconomic and technical pressures mount. A trade deal unfavorable to the EU, combined with the Fed’s hawkish stance, has fueled USD strength and dragged the euro sharply lower. At the same time, strong U.S. labor data and rising employment costs further reinforce the bearish outlook.
On the H1 chart, EURUSD is clearly moving within a descending channel. Key price zones have been broken with no significant bullish reaction, indicating that sellers remain firmly in control. The market is heading toward a psychological support area, with no signs of reversal as RSI stays weak.
I remain biased toward SELL setups on any short-term pullbacks, avoiding countertrend trades in this environment. If downside momentum continues, deeper targets may still be ahead.
In a market dominated by bearish sentiment, trading with the trend remains the smartest and safest approach.

XAUUSD – Downtrend Confirmed, Bears in ControlOn the H4 timeframe, gold has completely broken its short-term uptrend structure and formed a series of lower highs and lower lows. Every bounce is rejected at the strong resistance zone of 3,326 – 3,333 USD, confirming the clear downtrend.
Although the recently released Core PCE index was lower than expected, this is not enough to drive a recovery as other data, such as the Employment Cost Index and statements from the Fed, still show persistent inflationary pressure. Therefore, the monetary policy remains hawkish, causing money to flow out of gold.
Currently, the price is approaching the critical support zone of 3,247. If this level is broken, the scenario of further declines to 3,192 is entirely possible.

HEAD & SHOULDER DAILY TIME FRAME! (DOUBLE WHAMMY!!!!)The market has previously created a left shoulder. Now, it has broken out of the top of the Resistance and broken back into the support and resistance, about to form the right shoulder.
Wait for retest of the resistance then sell to the support, AND THEN BUY IT BACK TTHE RESISTANCE!! DOUBLE WHAMMMY!!


GOLD (XAUUSD) -Monthly Analysis & Trading Plan (Aug 2025)GOLD (XAUUSD) -Monthly Analysis & Trading Plan (Aug 2025)
Title: XAUUSD: Correction in Progress, Patience is Key for the Next Move
Chart: XAUUSD Monthly (1M)
Analysis Type: ICT/SMC, Price Action, & Moving Average
Summary:
After a historic and powerful bull run that saw Gold (XAUUSD) breach all-time highs in the first half of 2025, the market has entered a significant corrective phase. The massive red candle in June signaled a strong reversal of momentum, and the current July candle confirms that sellers remain in control, albeit with less intensity. This is a critical juncture for long-term traders, and a strategic approach is required.
Key Observations & Analysis
1. **Price Action & Market Structure:**
The move from late 2024 through May 2025 was a textbook "impulsive leg." The sharp reversal in June 2025, with a powerful bearish candle, likely acted as a **liquidity grab** or a **high-volume distribution event**, trapping late buyers. The market is now in a clear **break in market structure (BOS)** to the downside on this long-term timeframe, suggesting the correction is not over.
2. **ICT/SMC Concepts:**
* **Imbalance/Fair Value Gap (FVG):** The rapid bullish move created significant imbalances on the monthly chart. Price often returns to fill these gaps. The current correction is likely heading to fill or test these inefficiencies.
* **Order Block (OB):** The massive bullish move in late 2024/early 2025 likely created a strong bullish order block. The current sell-off is heading toward this potential institutional demand zone.
* **Liquidity:** The lows from late 2024 and early 2025 will be key liquidity pools. Smart money will likely be targeting these areas for a potential reversal or accumulation.
3. **Moving Average Analysis (MMA):**
* The price is currently trading above both the purple and yellow moving averages, which are still pointing upward. This confirms the long-term trend remains bullish, and the current move is a correction within that trend.
* The **purple moving average** is a key support level to watch. A test of this level would be a high-probability event, and its reaction will be crucial for the next major move.
Suggested Entry & Exit Levels
1. Aggressive Entry (Short)
Rationale
The bearish momentum, though slowing, is still the dominant force. An aggressive trader could look for a continuation of the short-term bearish trend.
Entry/b]
A short entry could be considered on a pullback to the recent highs around **$3,400 - $3,500** if a strong bearish candlestick pattern forms on a lower timeframe (e.g., weekly or daily).
Stop Loss
A tight stop-loss placed just above the recent high, for example, **$3,600**. This is a high-risk entry, so position sizing should be small.
Target
The first major target would be the **moving average support level**, roughly in the **$3,000 - $3,100** zone. The ultimate target for a full correction would be the order block from late 2024, around **$2,800**.
2. Conservative Entry (Long)
Rationale
The long-term trend is still bullish. The current move is a correction. The most prudent approach is to wait for a high-probability long entry at a key support level.
Entry/b]
Wait for price to reach the **purple moving average support zone (around $3,000 - $3,100)**. Look for a clear reversal signal on this level, such as a large bullish "pin bar" or "engulfing candle" on the monthly or weekly chart. This would be a high-probability demand zone for a reversal.
Stop Loss
A stop-loss should be placed below this key support level, perhaps around **$2,850 - $2,900**, giving the trade room to breathe.
Target
The first target for a new bullish leg would be the New swing high around **$3,800**. The ultimate long-term target would be a new all-time high above **$4,000**.
Conclusion
The Gold market is in a crucial phase. The bullish party from earlier in 2025 is over for now, and a healthy correction is underway. **The most logical and safe approach is to wait for the market to complete its corrective move.** Do not attempt to catch a falling knife. Instead, be patient and wait for price to reach a key institutional demand zone (our moving average support or the late 2024 order block) and show a clear sign of reversal. This will present a high-probability, low-risk long entry for the next impulsive move up.
Disclaimer
This is not financial advice. Please perform your own due diligence and risk management. Trading involves a significant risk of loss.

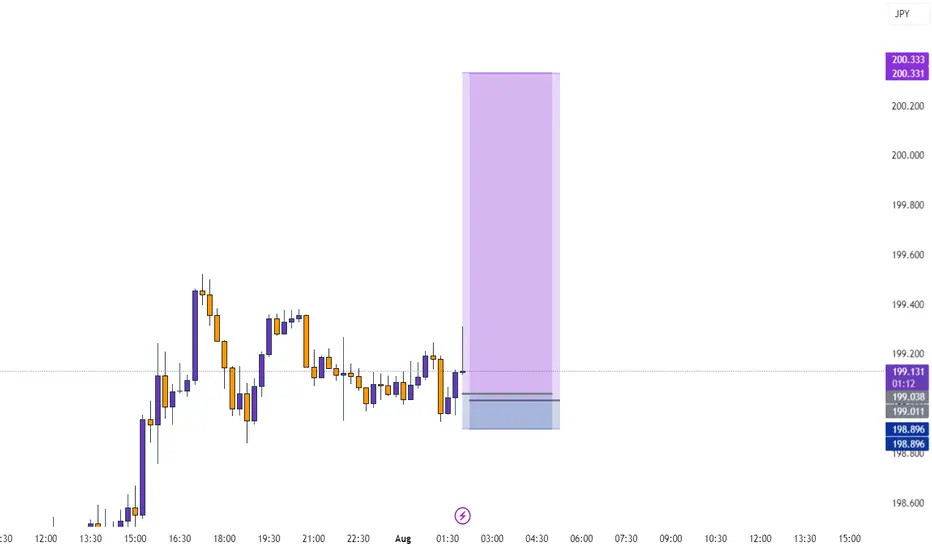
USDJPY breaks out as US data crushes forecastsHello traders! Do you think USDJPY will continue its upward momentum?
From a technical perspective, after several sessions of "building pressure," this pair has finally broken through a key resistance zone—opening the door to what could be the next bullish breakout.
Current price action suggests the uptrend remains firmly intact. The market continues to respect the rising trendline and finds strong support near the 34 & 89 EMA – a powerful technical combination that buyers often rely on. This isn’t just a typical breakout; it could be the start of a brand-new bullish cycle.
On the fundamental side, the U.S. dollar remains strong, supported by a string of solid economic data: employment, PCE, and consumer spending have all exceeded expectations. Meanwhile, the Japanese yen remains in “hibernation” as the Bank of Japan shows no sign of shifting away from its ultra-loose monetary policy. This divergence makes USDJPY one of the hottest pairs on the radar right now.
What’s next? If bullish momentum continues, the 151.25 level is likely the next short-term target. However, if the price encounters strong resistance at that level, a minor pullback could occur before the uptrend resumes.
So, what do you think? Is this the beginning of a major rally – or just a false breakout? Share your thoughts in the comments!
Wishing you successful and well-timed trades ahead!

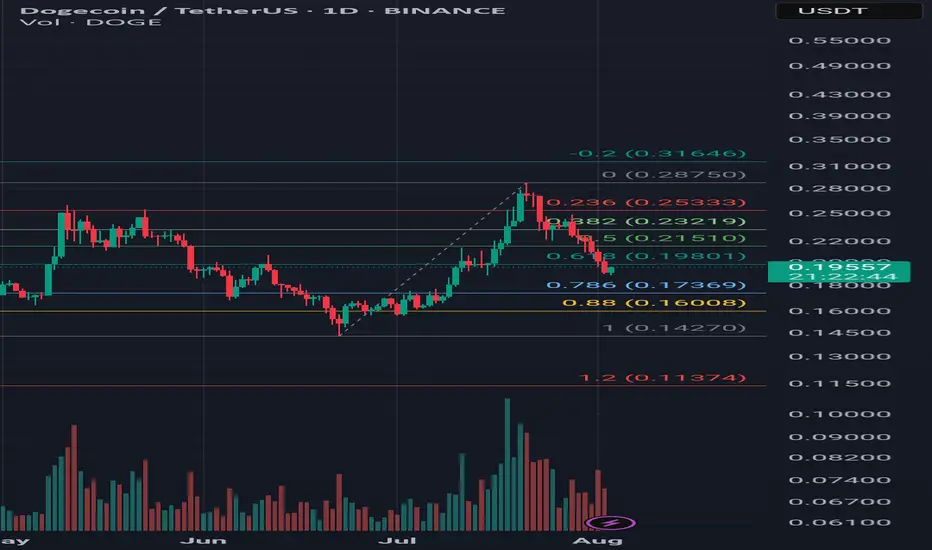
DOGE/USDT Trade Idea – Potential Cup & Handle Pattern Timeframe: Technical Analysis:
Price rallied from 0.142 to 0.287 and is currently forming the handle of a potential cup & handle pattern.
Price is sitting at the key 0.618 Fibonacci retracement level (0.198 USDT).
If this support holds and price breaks above resistance levels with strong volume, the cup & handle pattern may activate.
---
🎯 Targets:
1. First resistance: 0.215 USDT (50% Fib)
2. Second resistance: 0.232 USDT (38% Fib)
3. Key breakout level: 0.287 USDT
4. Classic pattern target: 0.432 USDT
---
🛡 Stop Loss:
Below 0.170 USDT (slightly under the 0.786 Fib & handle bottom)
---
✅ Entry Confirmation Criteria:
1. Hold above 0.198 support
2. Break and close above 0.215
3. Breakout above 0.287 with strong volume
---
💡 This analysis is for educational purposes only and is not financial advice. Always use proper risk management.
BTC LONGAfter major pullback Bitcoin takes Support. Our Algo-based Indicators also showing their first BUY-Signal with Alert.

BITCOIN LONG FROM SUPPORT|
✅BITCOIN has retested a key support level of 112k
And as the coin is already making a bullish rebound
A move up to retest the supply level above at 115k is likely
LONG🚀
✅Like and subscribe to never miss a new idea!✅
Disclosure: I am part of Trade Nation's Influencer program and receive a monthly fee for using their TradingView charts in my analysis.

NZD-CHF Risky Long! Buy!
Hello,Traders!
NZD-CHF keeps falling and
Will hit the horizontal support
Of 0.4738 on Monday from
Where we will be expecting
A local rebound and a
Bullish move up
Buy!
Comment and subscribe to help us grow!
Check out other forecasts below too!
Disclosure: I am part of Trade Nation's Influencer program and receive a monthly fee for using their TradingView charts in my analysis.

Next week's gold price target is above $3,400.Next week's gold price target is above $3,400.
Continue buying on dips.
Any pullback in gold prices next week will be an optimal buying opportunity.
Gold Technical Analysis:
This week's non-farm payroll data demonstrated significant bullish momentum, directly driving gold prices soaring. The price increase has completely erased all of this week's losses, demonstrating exceptionally strong upward momentum.
The current trend shows a significant shift in the balance of power between bulls and bears in the gold market, completely reversing the previous bull-bear pattern.
Gold prices broke through the $3,300 mark and have surged strongly, climbing to $3,362 so far, with no signs of stopping.
Based on this strong performance, it's not impossible for gold prices to test the $3,370 level next week. Bullish forces are clearly dominant in the market.
It's worth noting that the rapid market rally was driven by these strong data.
If you didn't buy in on the initial rally or go long when the price broke through support, subsequent pullbacks may provide few entry opportunities.
Therefore, investors need to be more proactive when selecting entry points.
Specifically for next week's trading:
If the price falls back to 3340, we recommend continuing to buy and maintain a bullish outlook.
Upward resistance levels include 3375-3385.
Overall, the short-term gold strategy for next week recommends buying on dips.
Upward resistance levels are 3377-3382.
Downward support levels are 3345-3335.

BHP holds steady as copper cracksCopper has been on a rollercoaster in 2025. It broke above US$5/lb in May, driven by strong demand signals from China and clean energy projects. Then came the reversal. US tariffs on Chinese copper goods triggered a sharp selloff. Futures dropped more than 20% in days.
Traders reacted to headlines. But the long-term story remains intact.
BHP, one of the world’s largest copper miners, just delivered record output—over 2 million tonnes in FY25, up 8% year-on-year. Its Escondida and Spence mines are performing strongly. Copper is becoming a key pillar of BHP’s future production and revenue.
The stock is currently trading on the ASX near its 200-day moving average, around AU$39. This is a technical and psychological level that often acts as support in long-term trends. It’s a point where value investors typically step in.
The investment case for copper hasn’t changed. Electrification, energy transition, and AI-driven infrastructure will need vast amounts of copper. Supply remains constrained. New projects are few, and development timelines are long.
Short-term shocks create long-term opportunities. The tariff-driven selloff may shake out weak hands, but it doesn’t weaken the structural demand for copper.
BHP offers a cleaner way to invest in the copper story. It has scale, operational discipline, and a strong dividend yield. Investors get exposure to copper without the risks that come with smaller miners or speculative plays.
We believe this pullback is an entry point. BHP near its long-term average, with strong fundamentals, looks attractive for medium to long-term investors.
Copper may stay volatile. But the direction is clear. BHP is well-placed to ride the next leg higher.
The forecasts provided herein are intended for informational purposes only and should not be construed as guarantees of future performance. This is an example only to enhance a consumer's understanding of the strategy being described above and is not to be taken as Blueberry Markets providing personal advice.

GBPUSD: The Bears Have it! Sell it!Welcome back to the Weekly Forex Forecast for the week of Aug 4 - 8th.
In this video, we will analyze the following FX market:
GBPUSD
Even against a weakened USD, the GBP is weaker.
July ended with an aggressive bearish candle. August may see more of the same.
Then there is talk of interest rate cuts coming.....
Enjoy!
May profits be upon you.
Leave any questions or comments in the comment section.
I appreciate any feedback from my viewers!
Like and/or subscribe if you want more accurate analysis.
Thank you so much!
Disclaimer:
I do not provide personal investment advice and I am not a qualified licensed investment advisor.
All information found here, including any ideas, opinions, views, predictions, forecasts, commentaries, suggestions, expressed or implied herein, are for informational, entertainment or educational purposes only and should not be construed as personal investment advice. While the information provided is believed to be accurate, it may include errors or inaccuracies.
I will not and cannot be held liable for any actions you take as a result of anything you read here.
Conduct your own due diligence, or consult a licensed financial advisor or broker before making any and all investment decisions. Any investments, trades, speculations, or decisions made on the basis of any information found on this channel, expressed or implied herein, are committed at your own risk, financial or otherwise.

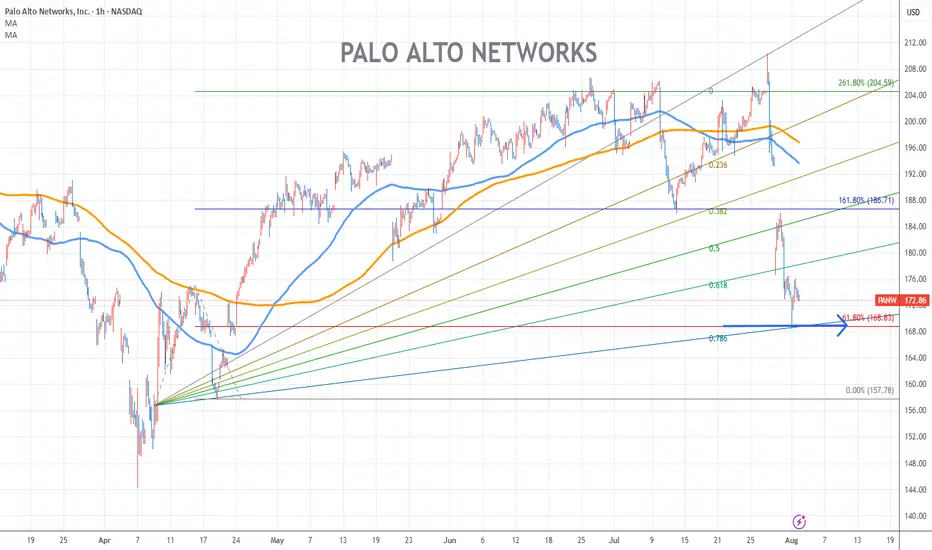
Palo Alto Networks Chart Fibonacci Analysis 080125Trading Idea
1) Find a FIBO slingshot
2) Check FIBO 61.80% level
3) Entry Point > 169/61.80%
Chart time frame:B
A) 15 min(1W-3M)
B) 1 hr(3M-6M)
C) 4 hr(6M-1year)
D) 1 day(1-3years)
Stock progress:C
A) Keep rising over 61.80% resistance
B) 61.80% resistance
C) 61.80% support
D) Hit the bottom
E) Hit the top
Stocks rise as they rise from support and fall from resistance. Our goal is to find a low support point and enter. It can be referred to as buying at the pullback point. The pullback point can be found with a Fibonacci extension of 61.80%. This is a step to find entry level. 1) Find a triangle (Fibonacci Speed Fan Line) that connects the high (resistance) and low (support) points of the stock in progress, where it is continuously expressed as a Slingshot, 2) and create a Fibonacci extension level for the first rising wave from the start point of slingshot pattern.
When the current price goes over 61.80% level , that can be a good entry point, especially if the SMA 100 and 200 curves are gathered together at 61.80%, it is a very good entry point.
As a great help, tradingview provides these Fibonacci speed fan lines and extension levels with ease. So if you use the Fibonacci fan line, the extension level, and the SMA 100/200 curve well, you can find an entry point for the stock market. At least you have to enter at this low point to avoid trading failure, and if you are skilled at entering this low point, with fibonacci6180 technique, your reading skill to chart will be greatly improved.
If you want to do day trading, please set the time frame to 5 minutes or 15 minutes, and you will see many of the low point of rising stocks.
If want to prefer long term range trading, you can set the time frame to 1 hr or 1 day.