might be going insanebasically ive been thinking way too much and i am trying to be in set and forget mode because i think this is what happens
Trend Analysis

GBPJPY: Bearish Market StructureLook to sell after the correction...
(H4)
✅ Confirmed BOS below 197.20
✅ LHs
✅ Supply Zone: 196.10 – 196.60
(H1)
✅ Nice impulse down from 197.30 to 195.50
✅ Short-Term Supply Zone: 195.90 – 196.20 (H1 OB inside H4)
Looking for price to tap this zone and form a new LH
(M15)
✅ Price consolidating after the drop
✅ No bullish BOS
✅ New LH
Expecting liquidity sweep above 195.90, then bearish BOS below 195.70 to confirm entry
❌ Invalidation: Bullish BOS above 196.70 on M15.

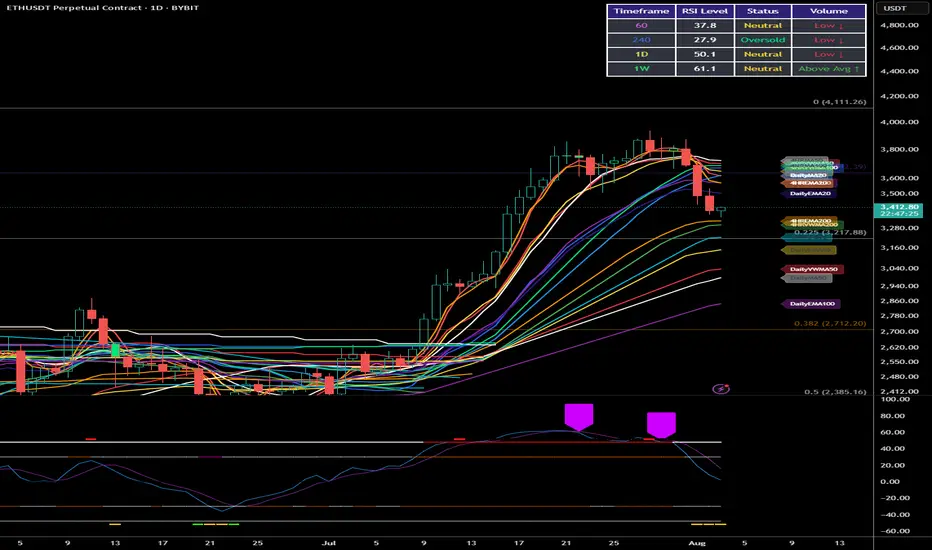
ETH Market Analysis: Where Are We Heading?Current Situation
Ethereum has been on quite a journey in 2025. After climbing steadily since January and reaching nearly $4,000 in July, we're now seeing a pullback with prices around $3,400. This isn't unusual - even in strong uptrends, prices don't move in straight lines.
What The Data Tells Us
Looking at the price patterns and technical indicators:
The big picture remains positive: Despite recent dips, Ethereum is still in an uptrend when looking at the longer timeframe. We're significantly higher than where we started the year.
We're at a decision point: The price is currently sitting at an important level where buyers and sellers have previously shown strong interest.
Support and resistance zones are clear: There have been consistent price levels where Ethereum tends to bounce (support) or struggle to break through (resistance).
Three Possible Paths Forward
Path 1: Resuming the Climb (45% likelihood)
If buyers regain control, we could see Ethereum push back above $3,500, then challenge the recent highs near $3,900. Breaking that level could open the door to the psychologically important $4,000 mark and potentially beyond.
Path 2: Further Pullback (40% likelihood)
If selling pressure continues, Ethereum might drop toward $3,200 first, with stronger support around $3,000. In a deeper correction scenario, we could test the $2,800 area where many buyers stepped in during previous dips.
Path 3: Sideways Movement (15% likelihood)
Sometimes markets need time to digest gains. Ethereum could spend several weeks trading sideways between roughly $3,300 and $3,600 before making its next significant move.
What To Watch For
Breakout signals: A strong move above $3,550 with increasing trading volume would suggest the uptrend is resuming.
Breakdown signals: Falling below $3,350 with conviction could indicate more downside ahead.
Volume patterns: Higher volume on up-days versus down-days would suggest stronger buyer interest.
This analysis is based purely on price patterns and technical indicators, looking at what the market has actually done rather than predictions based on news or sentiment.
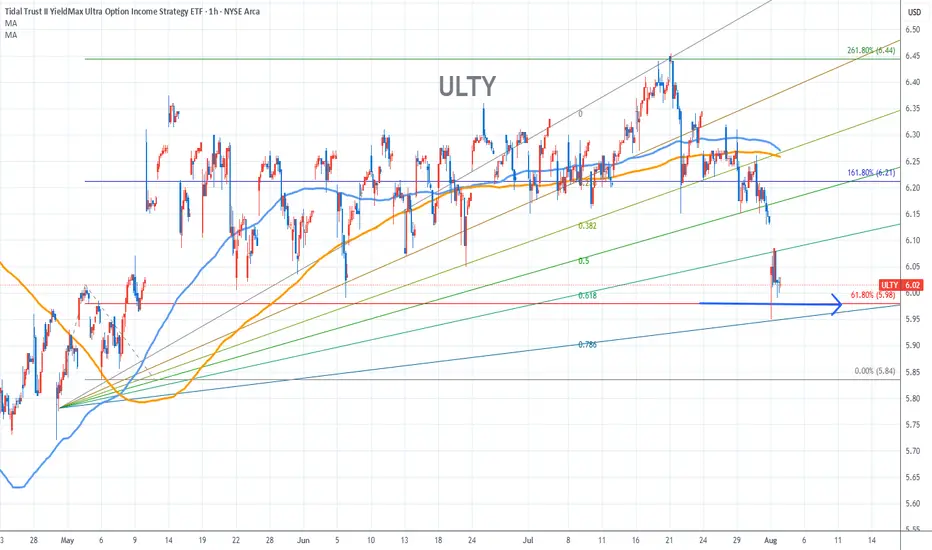
Ulty Stock Chart Fibonacci Analysis 080125Trading Idea
1) Find a FIBO slingshot
2) Check FIBO 61.80% level
3) Entry Point > 6.0/61.80%
Chart time frame:B
A) 15 min(1W-3M)
B) 1 hr(3M-6M)
C) 4 hr(6M-1year)
D) 1 day(1-3years)
Stock progress:C
A) Keep rising over 61.80% resistance
B) 61.80% resistance
C) 61.80% support
D) Hit the bottom
E) Hit the top
Stocks rise as they rise from support and fall from resistance. Our goal is to find a low support point and enter. It can be referred to as buying at the pullback point. The pullback point can be found with a Fibonacci extension of 61.80%. This is a step to find entry level. 1) Find a triangle (Fibonacci Speed Fan Line) that connects the high (resistance) and low (support) points of the stock in progress, where it is continuously expressed as a Slingshot, 2) and create a Fibonacci extension level for the first rising wave from the start point of slingshot pattern.
When the current price goes over 61.80% level , that can be a good entry point, especially if the SMA 100 and 200 curves are gathered together at 61.80%, it is a very good entry point.
As a great help, tradingview provides these Fibonacci speed fan lines and extension levels with ease. So if you use the Fibonacci fan line, the extension level, and the SMA 100/200 curve well, you can find an entry point for the stock market. At least you have to enter at this low point to avoid trading failure, and if you are skilled at entering this low point, with fibonacci6180 technique, your reading skill to chart will be greatly improved.
If you want to do day trading, please set the time frame to 5 minutes or 15 minutes, and you will see many of the low point of rising stocks.
If want to prefer long term range trading, you can set the time frame to 1 hr or 1 day.
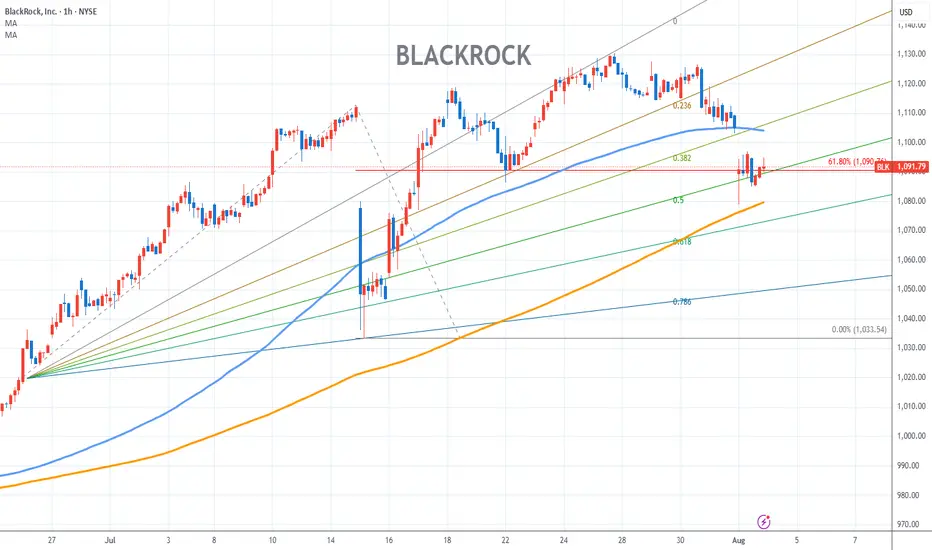
BlackRock Stock Chart Fibonacci Analysis 080125Trading Idea
1) Find a FIBO slingshot
2) Check FIBO 61.80% level
3) Entry Point > 1090/61.80%
Chart time frame:B
A) 15 min(1W-3M)
B) 1 hr(3M-6M)
C) 4 hr(6M-1year)
D) 1 day(1-3years)
Stock progress:C
A) Keep rising over 61.80% resistance
B) 61.80% resistance
C) 61.80% support
D) Hit the bottom
E) Hit the top
Stocks rise as they rise from support and fall from resistance. Our goal is to find a low support point and enter. It can be referred to as buying at the pullback point. The pullback point can be found with a Fibonacci extension of 61.80%. This is a step to find entry level. 1) Find a triangle (Fibonacci Speed Fan Line) that connects the high (resistance) and low (support) points of the stock in progress, where it is continuously expressed as a Slingshot, 2) and create a Fibonacci extension level for the first rising wave from the start point of slingshot pattern.
When the current price goes over 61.80% level , that can be a good entry point, especially if the SMA 100 and 200 curves are gathered together at 61.80%, it is a very good entry point.
As a great help, tradingview provides these Fibonacci speed fan lines and extension levels with ease. So if you use the Fibonacci fan line, the extension level, and the SMA 100/200 curve well, you can find an entry point for the stock market. At least you have to enter at this low point to avoid trading failure, and if you are skilled at entering this low point, with fibonacci6180 technique, your reading skill to chart will be greatly improved.
If you want to do day trading, please set the time frame to 5 minutes or 15 minutes, and you will see many of the low point of rising stocks.
If want to prefer long term range trading, you can set the time frame to 1 hr or 1 day.
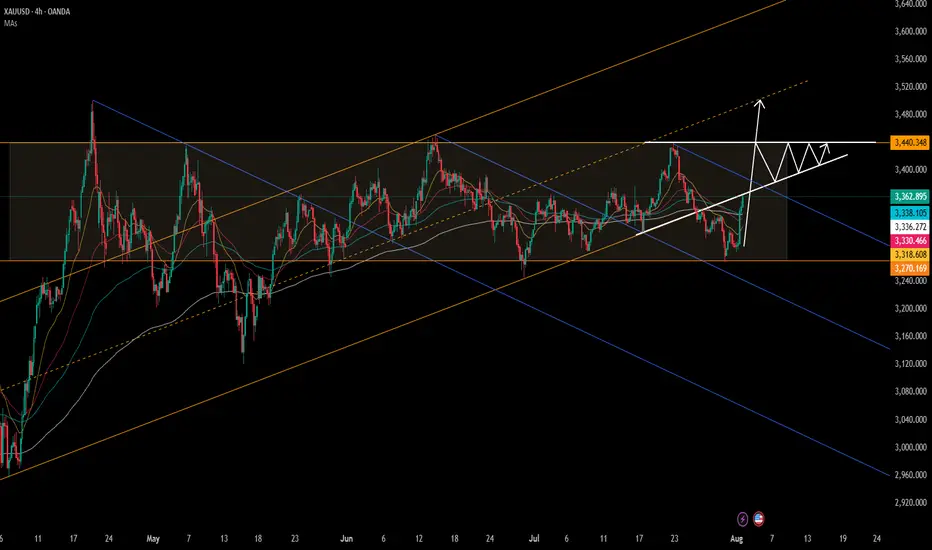
Go long on gold at low prices, targeting above 3400.Go long on gold at low prices, targeting above 3400.
Gold 4-Hour Chart:
As shown in the chart, from a macroeconomic perspective, despite the rise in gold prices, it remains trapped within a trend channel.
Currently, gold prices are under pressure in the 3370-3380 range.
On Friday, driven by risk aversion, gold prices briefly rose to $3363. With the Federal Reserve resuming its rate hikes over the weekend, expectations for a September rate hike have risen to 80%.
The most robust strategy for gold prices next week: enter long at low prices and manage your position accordingly.
Going long at current prices is not recommended. Instead, watch for potential declines due to profit-taking after the price dips.
Upward resistance lies near 3370 and 3380, where previous reversals occurred.
Every waterfall pattern offers a buying opportunity on the decline.
Although gold is currently strong, if we are bullish, we should not chase the gains. Simply wait patiently for prices to fall back to lower levels before going long.
Short-term intraday trend
Upside focus: Resistance at 3372-3385
Downside focus: Support at 3345-3340 and 3315-3320.
Gold Strategy:
1: Buy on the first dip into the 3338-3343 range, with a small stop-loss and a target price of 3370-3380.
2: Go long at low prices and control position size. This is definitely the most stable trading strategy. Patiently maintain a swing strategy. Target 3400+.
3: Continue to monitor resistance near 3440 next week. As shown in the chart, a converging triangle pattern may form.

ZM: Cross-Cycle Knot in Triangle🏛️ Research Notes
Original
Alternative Interconnection Experimenting with cross-cycle interconnection so coordinates of the 3 point of fib channels are placed on structure's latest connecting point while abiding its original angles.
When elements are extended we have a projection that looks like this:
Other aspects of the shape are being tested
Fibonacci Channels based on angle of the trend fragments the cycle creating probabilistic levels. (The steeper the angle of the FC the more it relates to time axis.)

NZDUSD: Look Out for Bullish Movement This Upcoming WeekThe NZDUSD currency pair is showing signs of potential bullish movement as we approach the new trading week. Several technical and fundamental factors align to support a possible upward momentum, making NZDUSD a pair to watch closely.

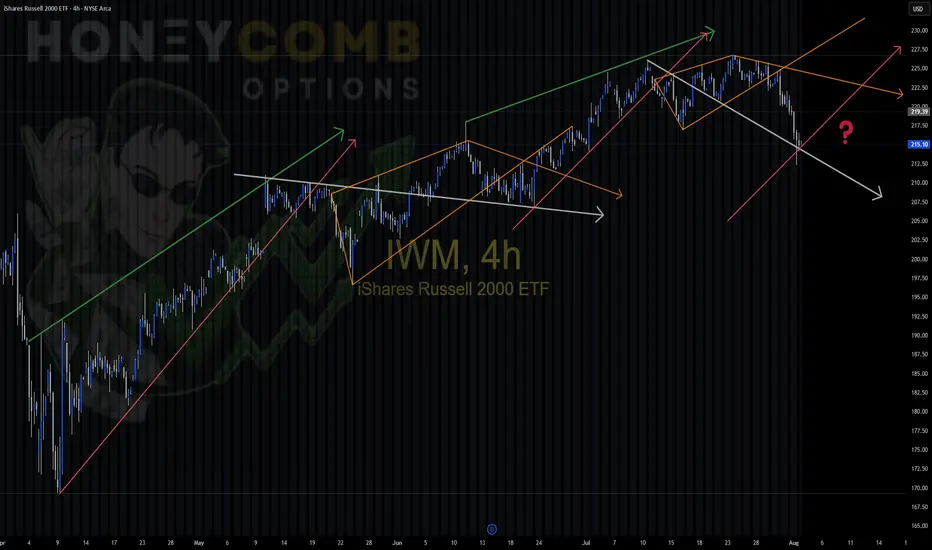
IWM repeating patterns IWM Playing around today noticed similar patterns in this uptrend, color coded for you convenience. Different sizes,, but the patterns are the same. Will we enter a new trend and start a different pattern, or will we stay in the same cycle?
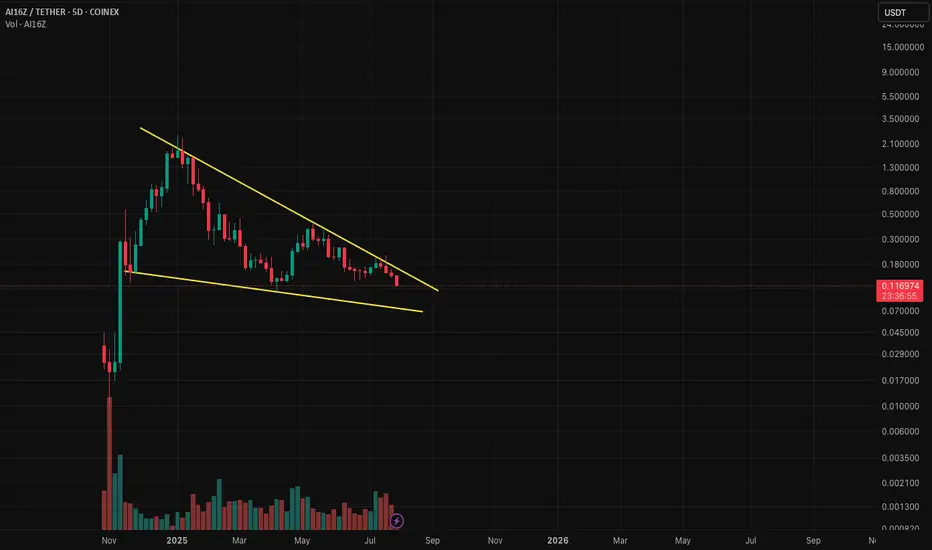
Ai16Z on a falling wedgeai16z has been in a bullish falling wedge for the past roughly 200 days. Right now as bitcoin and other cryptos are having a pull back, ai16z is forming a double bottom formation. The pattern is not complete as of yet please wait for a potential break out above the wedge resistance level to enter trade. However if anyone wish to catch the double bottom trade to maximise return you could enter at 10c but like always high risk high return the double bottom could fall further and void this idea. Happy Trading
TOTAL - Gonna Hold My Coins, Wait & See...This is my own experiment, gonna buy the most underrated top 30 coin, the most hated one. Put $5k on it right now and wait until this happens. Maybe this wont work but we will see!

EURUSD: Eu Looking to Make Gains Vs Weakened USDWelcome back to the Weekly Forex Forecast for the week of Aug 4 - 8th.
In this video, we will analyze the following FX market:
EURUSD
The USD pushed higher on keeping it's interest rate unchanged, but gave back those gains on weak job numbers. This allowed the EU to recover some of the previous weeks losses and show some resiliency.
Now analyst are betting there is a 66% chance for rate cuts in Sept by the Fed. This is negative for the USD, allowing the EURO to move higher.
It is worth mentioning, the EU inked a highly criticized tariff deal with the US, which was not at all positive for the currency.
The market is at a pivotal area that could go either way. Wait for a definitive break of structure before committing to a bias.
Enjoy!
May profits be upon you.
Leave any questions or comments in the comment section.
I appreciate any feedback from my viewers!
Like and/or subscribe if you want more accurate analysis.
Thank you so much!
Disclaimer:
I do not provide personal investment advice and I am not a qualified licensed investment advisor.
All information found here, including any ideas, opinions, views, predictions, forecasts, commentaries, suggestions, expressed or implied herein, are for informational, entertainment or educational purposes only and should not be construed as personal investment advice. While the information provided is believed to be accurate, it may include errors or inaccuracies.
I will not and cannot be held liable for any actions you take as a result of anything you read here.
Conduct your own due diligence, or consult a licensed financial advisor or broker before making any and all investment decisions. Any investments, trades, speculations, or decisions made on the basis of any information found on this channel, expressed or implied herein, are committed at your own risk, financial or otherwise.

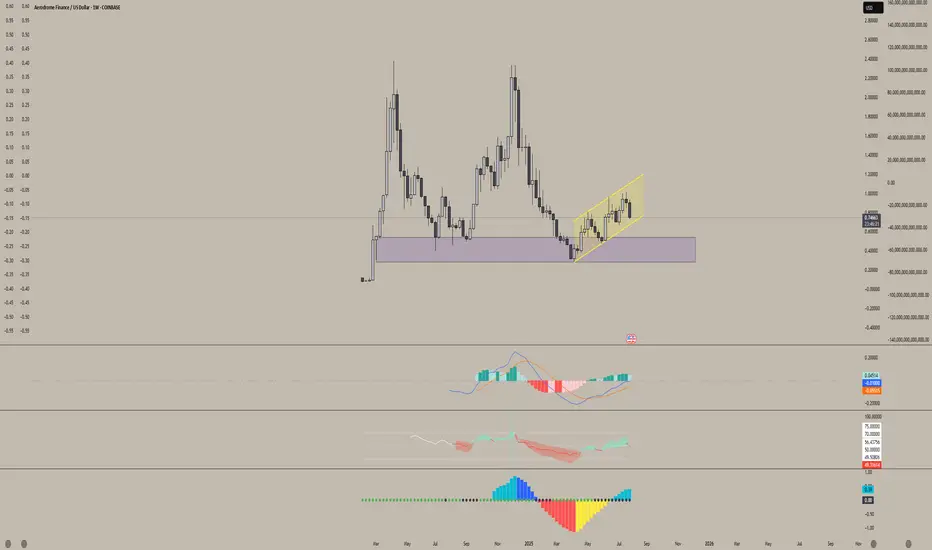
Aerodrome Finance (AERO)Aerodrome (AERO) is showing strong signs of accumulation.
We've been trading within this parallel channel for nearly three months, and it's repeatedly respected both the upper and lower bounds. As we approach the bottom of this range again, it looks like an ideal accumulation zone for long-term holders.
I'm very bullish on this project. Aerodrome is the leading DEX on Base — Coinbase’s Layer 2 network — and with no native Base token currently, AERO is in a prime position to claim that top spot. There's a vacant throne on Base, and AERO is well-positioned to sit on it.
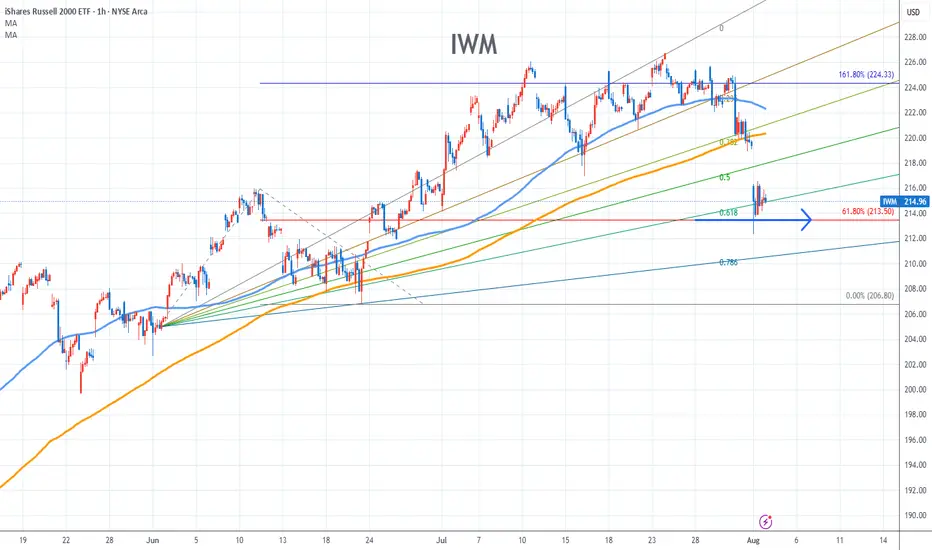
IWM Stock Chart Fibonacci Analysis 080125Trading Idea
1) Find a FIBO slingshot
2) Check FIBO 61.80% level
3) Entry Point > 214/61.80%
Chart time frame:B
A) 15 min(1W-3M)
B) 1 hr(3M-6M)
C) 4 hr(6M-1year)
D) 1 day(1-3years)
Stock progress:C
A) Keep rising over 61.80% resistance
B) 61.80% resistance
C) 61.80% support
D) Hit the bottom
E) Hit the top
Stocks rise as they rise from support and fall from resistance. Our goal is to find a low support point and enter. It can be referred to as buying at the pullback point. The pullback point can be found with a Fibonacci extension of 61.80%. This is a step to find entry level. 1) Find a triangle (Fibonacci Speed Fan Line) that connects the high (resistance) and low (support) points of the stock in progress, where it is continuously expressed as a Slingshot, 2) and create a Fibonacci extension level for the first rising wave from the start point of slingshot pattern.
When the current price goes over 61.80% level , that can be a good entry point, especially if the SMA 100 and 200 curves are gathered together at 61.80%, it is a very good entry point.
As a great help, tradingview provides these Fibonacci speed fan lines and extension levels with ease. So if you use the Fibonacci fan line, the extension level, and the SMA 100/200 curve well, you can find an entry point for the stock market. At least you have to enter at this low point to avoid trading failure, and if you are skilled at entering this low point, with fibonacci6180 technique, your reading skill to chart will be greatly improved.
If you want to do day trading, please set the time frame to 5 minutes or 15 minutes, and you will see many of the low point of rising stocks.
If want to prefer long term range trading, you can set the time frame to 1 hr or 1 day.