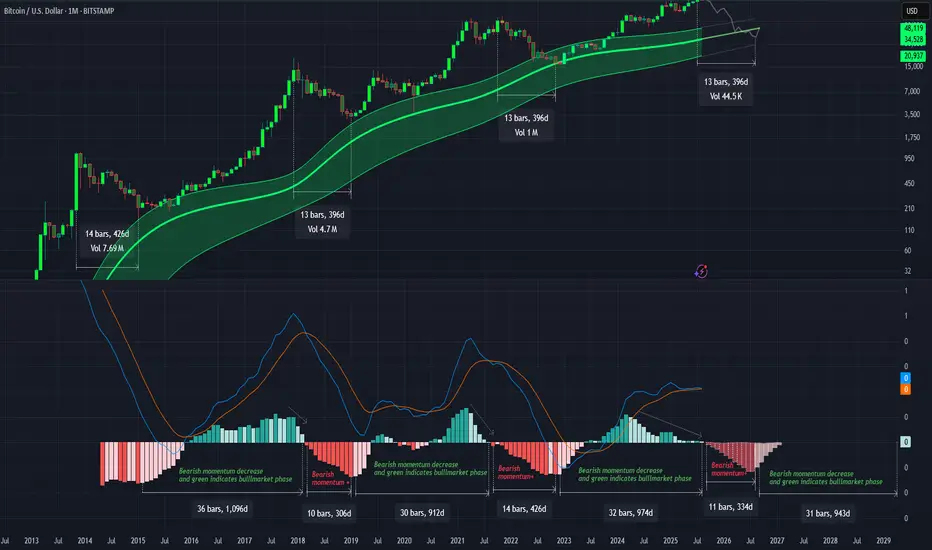
Gaussian and the LMACD deep dive!As you can see LMACD is showing signs of exhaustion. Histogram has been compressing or decreasing in momentum while the price has been climbing up. This divergence wont last for too long and a change in the trend seem very likely. BTC might be entering in the bear market pretty soon and you might start seeing the histogram turning red and increasing in bearish momentum before changing the trend once we approach to the core of the Gaussian or even bellow this time. Breaking bellow the core would mean range bellow 40k as bear market bottom.
Trend Analysis
#XAUUSD: Gold is likely to create a record highGold will be bullish since the US and Russia tension rises, creating uncertainty within the global investors. As of now gold rejected nicely due to negative NFP data affected the US Dollar. We have now two strong fundamentals views that is supporting our view. Please use accurate risk management while trading gold.
Good luck and trade safe. Please like and share for more
Team Setupsfx

Lingrid | AUDCAD Swap Zone. Potential Selling OpportunityThe price perfectly fulfilled my last idea . FX:AUDCAD is rebounding from a strong support area after a fake break below 0.88805 and is now moving toward the descending trendline. The price is expected to test the swap zone near 0.89421, where prior support may flip to resistance. This setup favors a SELL scenario from the lower high structure within the flag and downtrend. A rejection from the trendline could resume the bearish continuation back toward support.
📌 Key Levels
Sell zone: 0.89421 – 0.89500
Buy zone: 0.88805 – 0.88600
Target: 0.88805
Invalidation: Break and close above 0.89550
💡 Risks
Bullish breakout through the descending trendline
Sharp reversal from macroeconomic news
Short-term consolidation above 0.89100 weakening momentum
If this idea resonates with you or you have your own opinion, traders, hit the comments. I’m excited to read your thoughts!

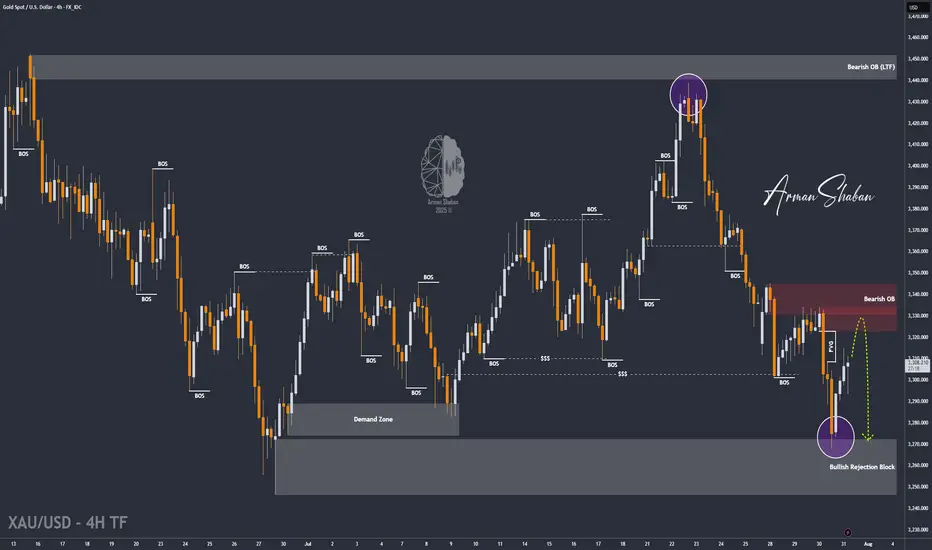
XAU/USD | Next Key Zone: Watch for Rejection at $3334! (READ)By analyzing the gold chart on the 4-hour timeframe, we can see that, just as expected, the price dropped from $3310 to $3288 in the first leg, where it hit a demand zone and bounced up to $3305, delivering a 170-pip rally. The main bearish move from $3333 to $3288 yielded 450 pips, bringing the total return on this analysis to over 620 pips!
In the second phase, gold dropped sharply again to $3268, and once more found demand, currently trading around $3307. If the price holds above $3294, we could expect further upside toward the $3322–$3334 zone. Once gold reaches this area, a strong bearish rejection is likely, with a potential return of 250 to 400 pips.
All key supply and demand levels are marked on the chart — make sure to monitor them closely and study the chart in detail. Hope you’ve made the most of this powerful analysis!
Please support me with your likes and comments to motivate me to share more analysis with you and share your opinion about the possible trend of this chart with me !
Best Regards , Arman Shaban
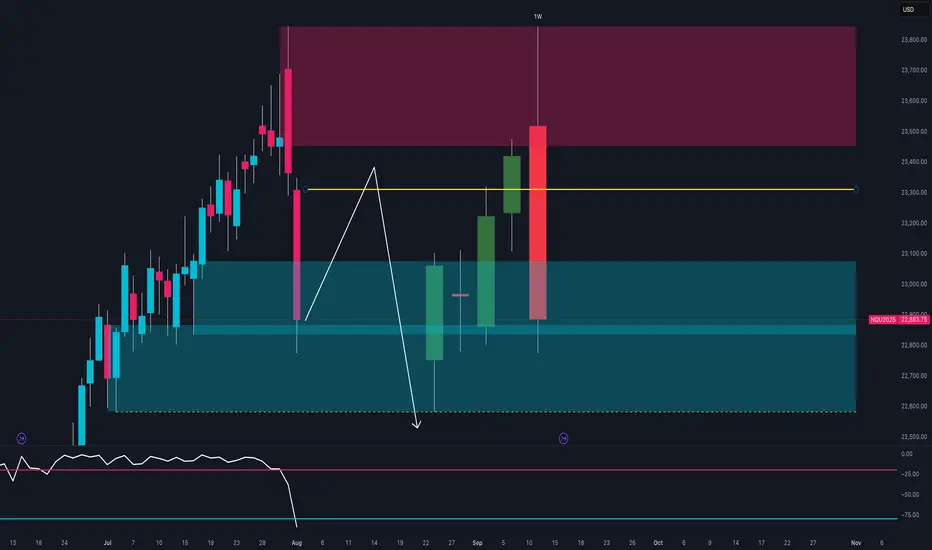
NASDAQ at Key Turning Point 🔍Technical Context
After testing the 23,600–23,800 supply zone, price printed a strong bearish rejection with a weekly engulfing candle.
The RSI broke decisively below the midline, signaling a clear loss of momentum.
Price is now trading back within the weekly demand zone between 22,800 and 22,950.
If a pullback toward 23,200 occurs, it could offer a fresh short opportunity, with downside targets around 22,600.
🪙 COT Report – July 29
Non-Commercials (speculators):
Long: +8,581
Short: +4,355
Commercials (hedging):
Long: +4,955
Short: +8,556
The market remains net long, but commercials are increasingly hedging with shorts.
The current imbalance — 88.6% long vs 11.3% short — suggests excessive bullish positioning, raising the risk of a correction.
🗓️ Seasonality – August
August is historically strong for the NASDAQ:
+222 pts (10Y)
+400 pts (5Y)
+912 pts (2Y)
While the trend is clearly bullish seasonally, caution is warranted:
Tops are often formed during the first half of August, followed by more pronounced corrections in September.
📉 Operational Summary
Primary scenario:
Wait for a retest of the 23,200–23,250 area
Look for rejection signals → enter short
Target 1: 22,800
Target 2: 22,600
Alternatively:
If 22,800 breaks on a strong weekly close, deeper downside scenarios may unfold.

GBP/NZD POTENTIONAL SHORT OPPORTUNITYThis is an idea for GBPNZD's potential short opportunity based on what the technicals indicate.
The trend has been emphasising its bullish approach for almost three years.
Price respected almost 11 times due to the strong resistance within 150 days between 2.265 & 2.275 and bounced off bullish OB on the daily chart and FVG on the weekly chart.
An institutional sharp decline on the weekly chart, followed by a clear wedge, can support a further drop once swept by bearish daily OB. A breakout to the micro wedge (orange) within a macro wedge can also help further down move.
Given that a bearish pin bar followed by a bearish doji is a strong warning signal of potential reversal or bearish continuation that appears inside the micro wedge.
TP1 is considered the first support at the bottom, where the daily OB and the weekly FVG meet at around 2.22000 or the area close to the trendline. If the price breaks through the trendline, TP2 and TP3 will be expected to be achieved.
TP2 may be located at the micro accumulation around 2.20000, and TP3 at the following major support around 2.15000-2.17000 that previously acted as both support and resistance.
Good luck and have a great weekend.

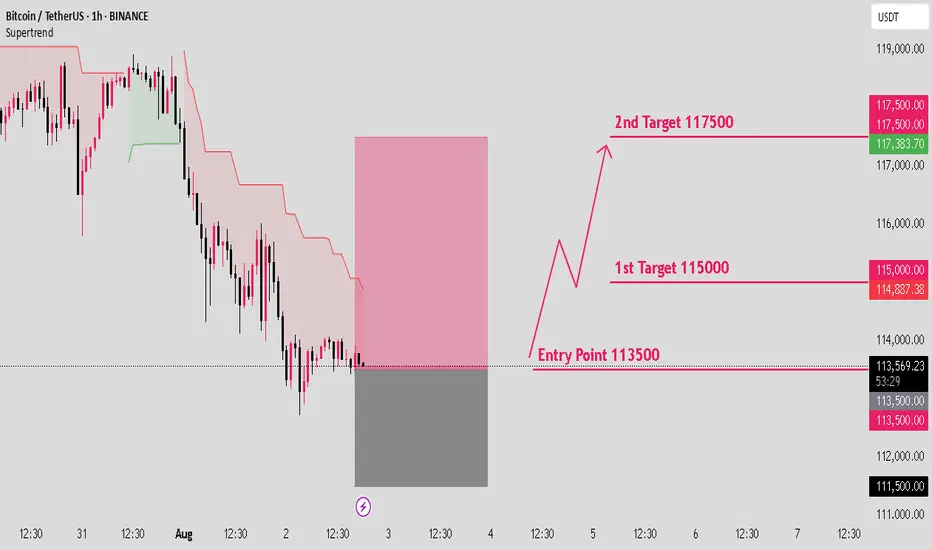
BTCUSD long setup: Targeting the next bull move.Hello IGT FOLLOWERS
Here is my BTCUSD overview, Bitcoin is showing bullish momentum after holding strong support near $112,000. A breakout above the $115000 resistance suggests buyers are regaining control. RSI is turning upward, and volume is increasing on green candles signaling demand. As long as price holds above $113,000, bulls may push toward the $117,500 target.
Key points :
Entry point : 113500
1st Target : 115000
2nd Target : 117500
Follow me for more latest updates and signals
DOTUSDTThe first higher high after a downtrend indicates a potential trend reversal to the upside. It shows that buyers are starting to regain control, signaling the possibility of a new bullish trend.
Trendline Break: A break above a significant trendline further confirms the shift in sentiment from bearish to bullish. The trendline break signifies that selling pressure has weakened, and the market is poised for further upward movement.

GBPJPY Will Move Higher! Long!
Take a look at our analysis for GBPJPY.
Time Frame: 1h
Current Trend: Bullish
Sentiment: Oversold (based on 7-period RSI)
Forecast: Bullish
The market is approaching a key horizontal level 195.702.
Considering the today's price action, probabilities will be high to see a movement to 197.050.
P.S
Please, note that an oversold/overbought condition can last for a long time, and therefore being oversold/overbought doesn't mean a price rally will come soon, or at all.
Disclosure: I am part of Trade Nation's Influencer program and receive a monthly fee for using their TradingView charts in my analysis.
Like and subscribe and comment my ideas if you enjoy them!

SOL/USD Last Level before $143Using a simple fib retracement from June Low to July High, mid 150s is a good buy after we lost $165, but it all depends on BTC. If BTC loses 112k-110, we are going to $140s and potentially the June low. God Speed

Potential Sell Opportunity on EURGBPReasons I think this pair will fall.
- RSI was overbought on 4H
- Bearish RSI Divergence on 4H
- Lower high potentially being printed on 4H
Looking to sell on the retest once price breaks though previously printed low.
What do you think?

Why ETH Remains Bullish and Its Next Potential Move !It appears that the price is forming a cup and handle pattern, and if this occurs, it could push the price above $4K.
Best regards CobraVanguard.💚

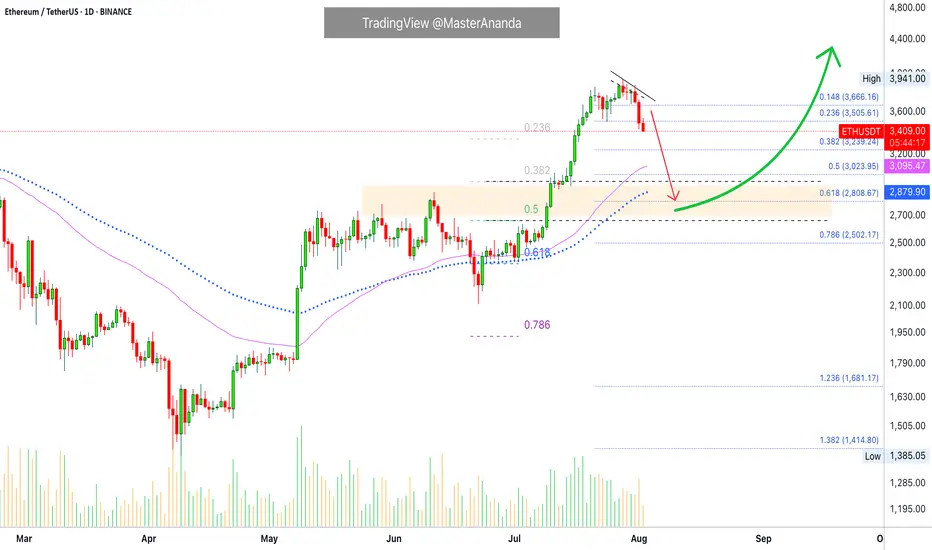
Ethereum Market Flush, Retrace & Support ZoneEthereum is now on its third consecutive red day and bearish action is fully confirmed. The market is preparing for a strong drop.
As I've been mentioning, this move looked up from a broader perspective is part of a small correction for the last major advance. Ethereum moved up from $2,500 to almost $4,000. Now we get a retrace that ends in a higher low followed by additional growth.
The retrace is now confirmed as Ether needs to test EMA55 and EMA89 as support. If these levels hold, you can count on a reversal right away. If these levels are compromised strongly, then prices can linger lower before a recovery shows up. It should be fast and strong. It should all happen within a few days, the crash and bottom, and the reversal a long-term process; sustained long-term growth, the market will be removing some of the weak hands.
We are going to be experiencing a bull run, are you sure you want to stay?
Protect your positions at all cost. We've seen nothing yet. $8,000 or more by the end of the bull run phase.
Namaste.
Let`s play some pokkerThere`s a pattern ;) So why not..
There`s room to grow min till pre-earnings
Trade safe!

EURUSD short to 1.121Hello Traders,
Factoring in the fundamentals such as US EUR trade deal, $600 billion of investment into US, $350 billion investment from South Korea.
4hr chart, trading under 1 day up trendline.
Was strong sell signal from 1.177 last Thursday.
200ema starting to turn downwards
Still close to upper regression channel that began July 1st, believe it is still in play.
6 hr and 12 hr block still support, strong rejection at 4h bearish block. not expecting much else today since it's Friday. Still targeting 1.121 in August
Originally entered trade at 1.172 area, added 3 times on the way down, originally targeting 1.143 but with the ever evolving trade deal news that I believe to be bullish for the USD I moved target to 1.121.
Goodluck to you all.

Price breakout below Keltner bandThe price has shown a breakout after the squeeze below the keltner band and may signal a more bullish trend.

MAGICUSDT.P 15m – Short Setup at Key Fib ResistancePrice sharply rejected from the 0.2042 high and is now breaking below the 50%–61.8% Fibonacci retracement zone after a lower high. The move shows strong selling interest, aligning with MACD histogram momentum shift into the negative.

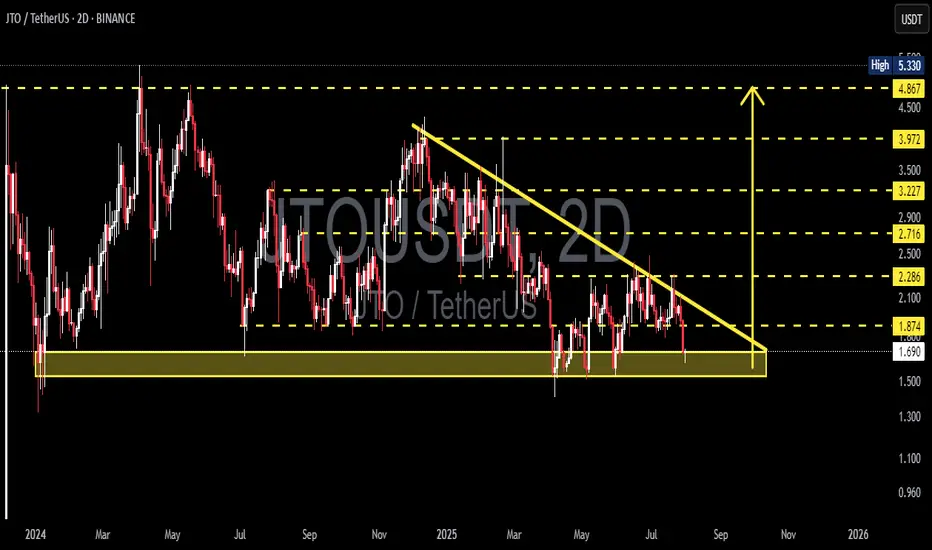
JTO/USDT at the Edge of Pressure – Breakout or Breakdown Ahead?🧠 Detailed Technical Analysis (2D Timeframe):
JTO/USDT is currently consolidating at a critical support zone within a well-defined Descending Triangle pattern that has been forming for over 6 months.
Key observations:
Price has been making lower highs, forming a downward-sloping resistance trendline.
Meanwhile, strong buying interest has held up the support zone between $1.69 and $1.87, suggesting accumulation.
This creates a classic Descending Triangle, often leading to a sharp breakout or breakdown.
---
📌 Key Levels:
Level Description
$1.69–$1.87 Major Demand Zone / Key Support
Descending Trendline Dynamic Resistance (from Lower Highs)
$2.29 First Resistance (Breakout Trigger)
$2.71 Key Mid-Term Resistance
$3.22 – $3.97 Major Upside Targets
$1.50 & $1.30 Breakdown Targets
---
📈 Bullish Scenario (Breakout):
If the price holds the support and successfully breaks the descending trendline, we could see a strong bullish reversal:
Confirmation breakout may lead to a rally toward $2.29 → $2.71 → $3.22 → up to $3.97.
Breakout strength increases if accompanied by volume surge.
Bullish Catalysts:
Positive project fundamentals.
Volume squeeze near triangle apex.
RSI/MACD divergence (if present).
---
📉 Bearish Scenario (Breakdown):
If price closes below the $1.69 zone with conviction:
Descending triangle confirms as a bearish continuation.
Target downside to $1.50 and potentially $1.30.
Could signal distribution phase by larger players.
Bearish Confirmation: Strong 2D candle close below $1.69 with high volume.
---
🧩 Pattern Breakdown – Descending Triangle:
The pattern represents price compression between lower highs and a horizontal support.
Statistically, 70% of descending triangles resolve to the downside.
However, in oversold conditions or with bullish catalysts, it may lead to a powerful short squeeze breakout.
---
🧭 Summary & Strategy Insight:
JTO/USDT is nearing a decision point. At the edge of the triangle’s apex, volatility is likely to spike — with a strong move in either direction.
💡Possible Strategy:
Conservative entry: Wait for breakout confirmation above the trendline with volume.
Aggressive entry: Speculative buy near $1.70 with tight stop loss.
Avoid heavy positions until the breakout or breakdown confirms.
---
🧲 Suggested Post Title:
> "JTO/USDT at a Crossroads – Descending Triangle Set for Explosive Move?"
A breakout is imminent. Will you be ready?
#JTOUSDT #CryptoBreakout #DescendingTriangle #AltcoinSetup #TechnicalAnalysis #CryptoStrategy #ChartPatterns
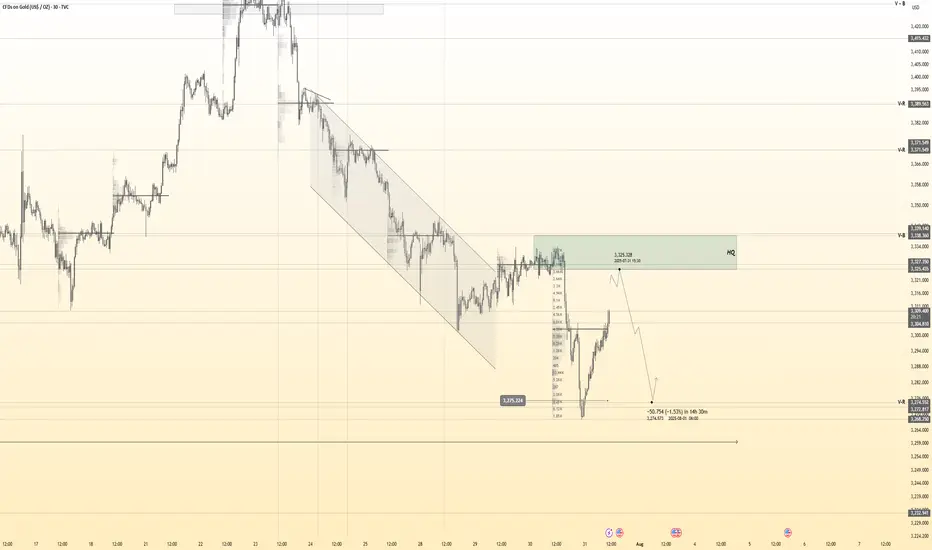
Gold 30Min Engaged ( Bearish Reversal Entry Detected )Time Frame: 30-Minute Warfare
Entry Protocol: Only after volume-verified breakout
🩸Bearish Reversal - 3325
➗ Hanzo Protocol: Volume-Tiered Entry Authority
➕ Zone Activated: Dynamic market pressure detected.
The level isn’t just price — it’s a memory of where they moved size.
Volume is rising beneath the surface — not noise, but preparation.
🔥 Tactical Note:
We wait for the energy signature — when volume betrays intention.
The trap gets set. The weak follow. We execute.
XAUUSD ANNASIS OUTLOOK BULLISH 1/8/2025 XAUUSD – Trade in Progress
Long from $3,295 – targetting $3,355 / $3,365
+600+ pips potential on extended breakout
Bulls gaining strength above $3,300
Holding with confidence – structure supports it
#XAUUSD #GoldTrade #LiveSetup #TargetPending

Warning: SPX500 May Have Peaked—Here’s What the Charts SayThe S&P 500 (SPX500) may have reached its peak. In this video, I reveal the technical evidence pointing to a potential reversal—including monthly bearish divergence, daily and weekly reversal candles, and confirmation from key indicators.
This isn’t just noise—these signals align across timeframes, suggesting a shift in momentum that could lead to significant downside. I’ll walk you through the charts, explain the implications for traders and investors, and highlight critical support levels to watch.
Thank you for watching and have a great trading week. Cheers!!

EUR_USD POTENTIAL SHORT|
✅EUR_USD has been growing recently
And the pair seems locally overbought
So as the pair is approaching
A horizontal resistance of 1.1632
Price decline is to be expected
SHORT🔥
✅Like and subscribe to never miss a new idea!✅
Disclosure: I am part of Trade Nation's Influencer program and receive a monthly fee for using their TradingView charts in my analysis.
