S&P500 corrective pullback key support at 6200Key Support and Resistance Levels
Resistance Level 1: 6316
Resistance Level 2: 6374
Resistance Level 3: 6430
Support Level 1: 6200
Support Level 2: 6112
Support Level 3: 6073
This communication is for informational purposes only and should not be viewed as any form of recommendation as to a particular course of action or as investment advice. It is not intended as an offer or solicitation for the purchase or sale of any financial instrument or as an official confirmation of any transaction. Opinions, estimates and assumptions expressed herein are made as of the date of this communication and are subject to change without notice. This communication has been prepared based upon information, including market prices, data and other information, believed to be reliable; however, Trade Nation does not warrant its completeness or accuracy. All market prices and market data contained in or attached to this communication are indicative and subject to change without notice.
Trend Analysis

We might be changing the trend in the coming months!I found this indicator extremely accurate for the past tops. We are focusing on the histogram today and looking once that green candles starts growing momentum taking BTC down the hill. If this idea proves right we might be bottoming around 400 days perhaps August 2026 ~45k

Be prepared to be liquidated.Be prepared to be liquidated.
Be prepared to be liquidated.
Ada =0.18
Shiba =0.000005
،Doge =0.05
Ethereum =900
Dot=1.30
Dydx=0.39
Fil=1.20
Sand=0.15
Mana=0.13
...........

Solana Update · Retrace, Bears & The Bullish BiasSolana had a retrace in May. Notice the 19-May date on the chart. This retrace produced four weeks red. The bullish move that led to this retrace lasted 6 weeks. The last rise lasted five weeks and the current retrace might last only two weeks, can be less.
We are seeing Solana rising but this rise is not a one-time off event, this is a trend that is developing. An uptrend as a long-term phenomena is different to a short-term bullish moves. A short-term move tends to be really fast, one strong burst and that's it. A long-term move is different. Instead of seeing 2-3 candles and Solana trading at $1,000, we see dozens and dozens of candles with prices slowly rising. There are strong fluctuations but the end result is always up. And that's how you see the fluctuations on the chart.
Solana moved up and then immediately started to retrace. Then another rise and another retrace again. This retrace will end and prices will continue to grow long-term. The bulls are in. The bull market is on. Solana, Bitcoin, Crypto and the rest of the Altcoins market is going up.
Namaste.

AUDCAD / GBPAUD Trade Recaps 01.08.25A tester trade on AUDCAD with the reasons explained as to why this was a test position, and a short position executed on GBPAUD. Solid setup that this time around just didn't commit.
Full explanation as to why I executed on these positions and the management plan with both.
Any questions you have just drop them below 👇


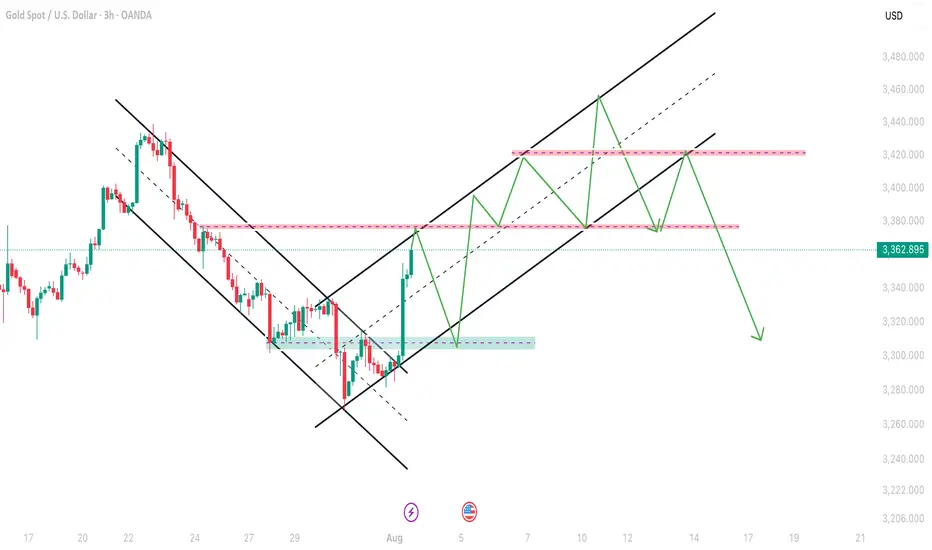
Gold next prediction Aug 4 onwardsAs you can see in this chart gold was moving in a downtrend channel and after a big breakout in Non-Farm Gold moves to 3362 so now it will make a new Bullish channel in which first hurdle will be 3374-3380 and then can retrace till 3H and 4H chock point and then can continue to bullish side overall move can be done upto 3452-3460 which is last resistance of the market as my analysis this can be plan A.I will update about Plan B in my next analysis.
AGT Looks good hereI am long - lets follow the trend!
my chart has been "cleaned" but i have several confluences here.

HBAR Momentum Hbar has gained some momentum lately. This is the ideal rally setup.
It has also yet to see real price discovery past .5
Large trade already opened.
DYOR, I believe this coin has a ton of potential.
Hederas' Council consists of entities like Google, IBM, Boeing Through VentureX, Standard bank.. Just to name a few.
But you all don't care about that.

Fakeout before huge breakout in EURUSD#EURUSD Fakeout before huge candle breakout.
Just a learning experience how fakeouts are very frequent on forex and crypto market

EURUSD - New Bearish Move!Hello Traders !
The EURUSD broke the support level (1.14810 - 1.14463).
This key level becomes new resistance!
So, I expect a bearish move📉
_______________
TARGET: 1.12955🎯

DXY Just Broke Through the Lock… Where’s the Market Headed Now?🌅 Good Morning, Friends!
A few days ago, I marked 98.950 as a key threshold for the DXY index. As of today, that level has officially been broken—and the bullish momentum we anticipated is now kicking in. 📈
The next target? 101.000.
That said, it’s crucial to remember: DXY is heavily influenced by fundamental data. Stay alert and keep a close eye on key economic developments—they’re essential for navigating this move.
This breakout validates the analysis I shared with you all. And it wasn’t just about charts—it was about discipline, precision, and timing.
Every single like from you is a huge boost to my motivation. Thanks from the heart—your support drives me to keep sharing these insights! 💙

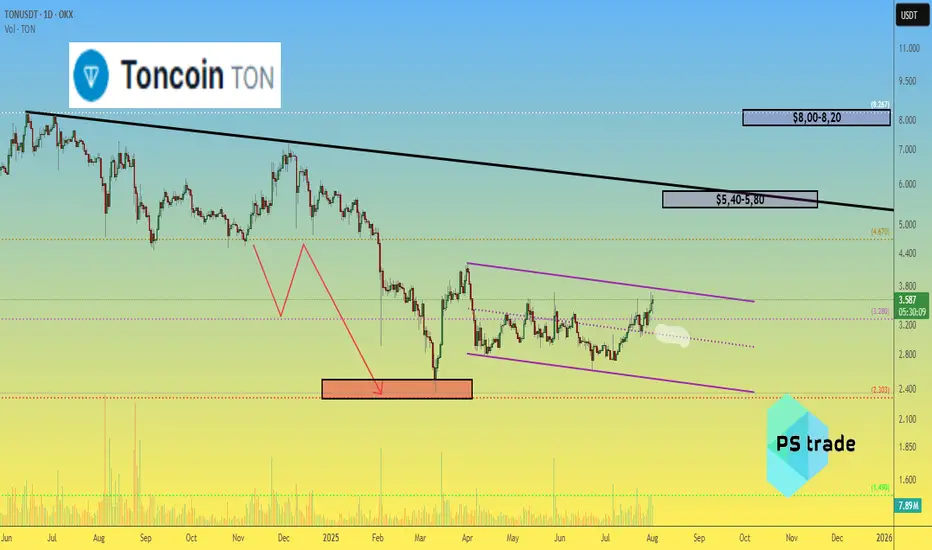
Toncoin TON price analysis💎 CRYPTOCAP:TON didn’t become a legend over the past 9 months — but at least our correction target of $2.30–2.50 played out with precision.
While most of the crypto market is currently going through a correction, #Toncoin keeps pushing upward. Still, we remain realistic:
🎯 First target: $5.40–5.80
🎯 Second target: $8.00–8.20
🚀 It’s not a “to the moon” scenario, but a potential 2x–3x from current levels is attractive.
The key support level OKX:TONUSDT remains at $3.00 — as long as it holds, the bullish trend remains valid.

Big money coming? Here, NFP data XAUUSD Technical Analysis PredDXY forecast today
XAU USD forecast today
EURUSD forecast today
NFP Data Forecast: Xauusd buys SELV sales for mass profit! Your latest gold trade guide confidently during the production of this most important wages is not related to the farm. In this video you will receive technical analysis from XaUUSD experts and proven adjustments for XaUUSD sales. It breaks down how you interpret forecasts for NFP data, how it affects gold prices, and where the best opportunities are. Whether you're a day trader or swing, this video gives you real information to plan your trade and plan your risk management as an expert. Don't miss this opportunity to turn your data into profits ahead of the market. Now look, trade more intelligently and go ahead with the crowd!
#NFPDATAFORECAST
#xauusd
#GoldTrading
#technicalalyasis
#forexsignals
#GoldPrice
#daytrading
#swingtrading
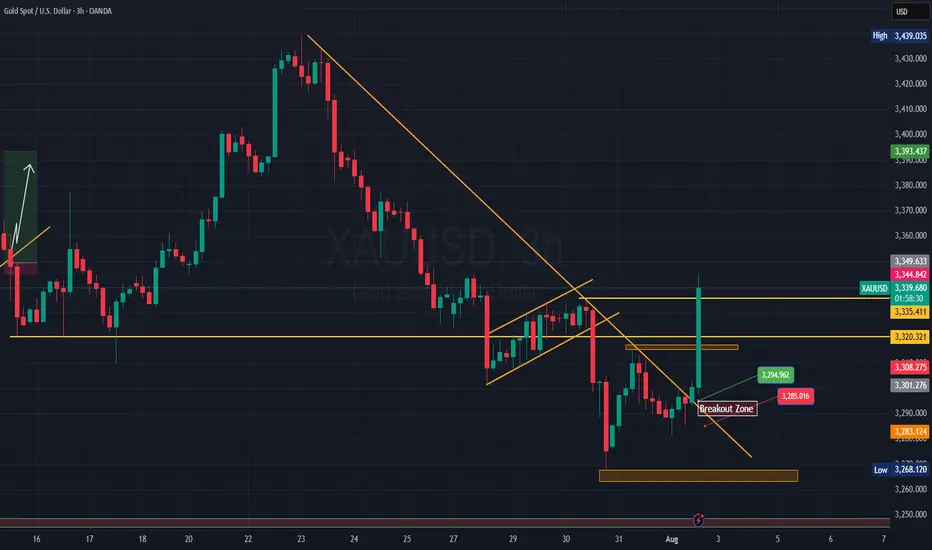
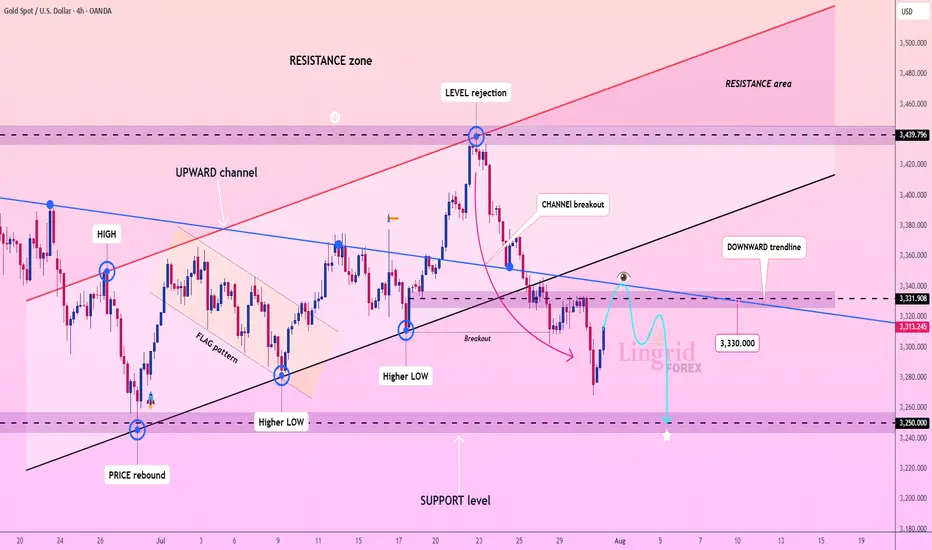
Lingrid | GOLD Possible Retest of the Major Support ZoneThe price perfectly fulfilled my previous idea . OANDA:XAUUSD is bouncing from recent lows but remains under pressure below the key resistance at 3,331.90 and the downward trendline. The prior rejection near 3,440 led to a steep selloff with a clean break below the upward channel. Current action shows a potential lower high forming near the broken trendline. A rejection there could send gold tumbling toward the 3,250.00 support zone.
📌 Key Levels
Sell trigger: Failure to reclaim 3,331.90
Sell zone: 3,330 – 3,340
Target: 3,250.00
Invalidation: Strong bullish breakout above 3,340 and descending trendline
💡 Risks
Bullish reversal breaking above downward trendline
Dovish Fed news boosting gold
Unexpected macroeconomic shocks increasing safe-haven demand
If this idea resonates with you or you have your own opinion, traders, hit the comments. I’m excited to read your thoughts!
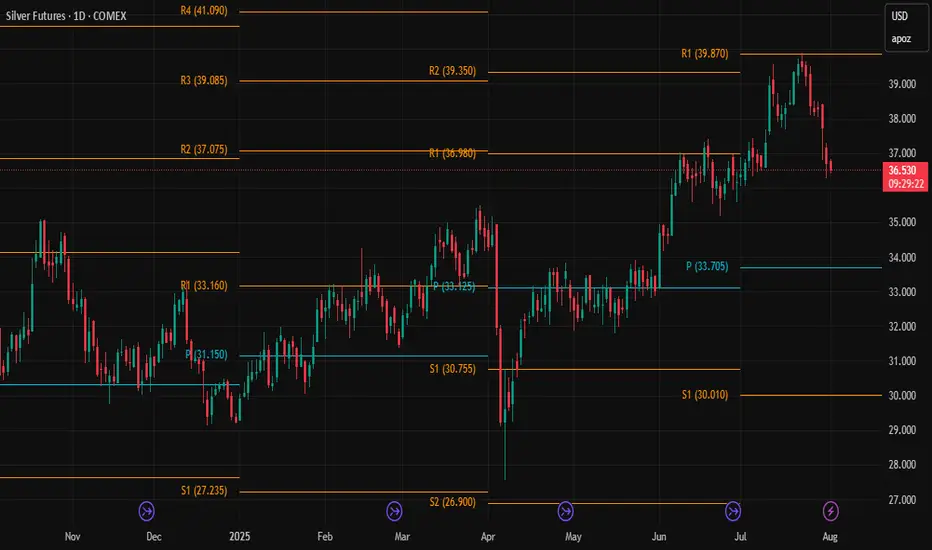
It would be nice to see Silver drop towards the Pivot for a buy.There is no prediction, just looking at the pivots. It would be nice to see silver drop down under 35.00 into the quarterly pivot point to add to positions.
Hbar dump to $0.22904Just now opened up a short position on hbar.
Sl: $0.24598
Tp: $0.22904
Roughly 2RR from my entry.

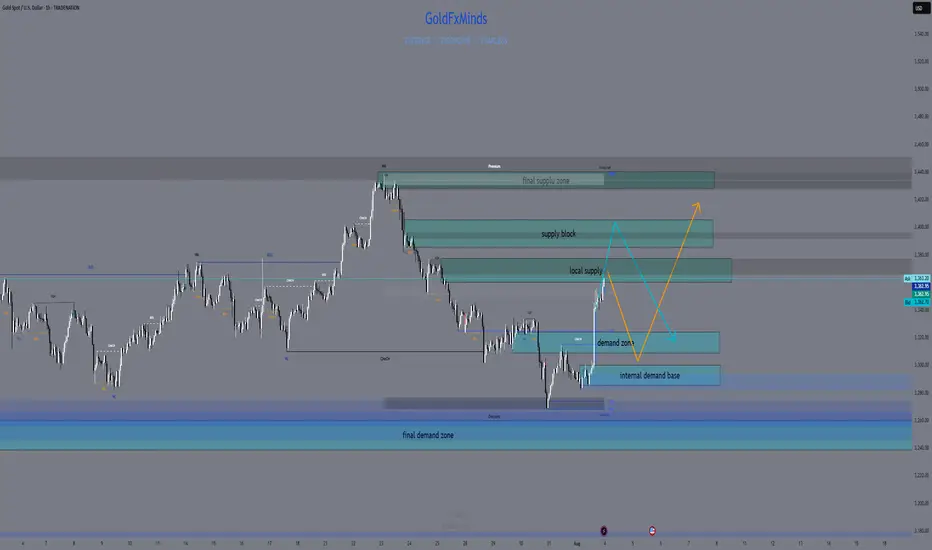
XAUUSD Daily Sniper Plan – August 4, 2025🧠 Macro & Context
Gold is surging back toward premium structure after sweeping 3287. With no major news today, flow is dictated by structure, liquidity, and the residual strength from July’s closing push. Bulls have reclaimed internal control, but are now pressing into major resistance zones. This is the perfect battleground for sniper entries.
🔥 Bias: Bullish short-term, but hitting premium exhaustion
The current candle is testing prior supply and imbalance. Unless we break 3375–3380 cleanly, price remains vulnerable to rejection from premium. Above that, clean air until external zones. Any pullbacks into discount (under 3310) remain buyable — if the structure holds.
🎯 Daily Sniper Zones
🔷 3360–3375 – Decision Supply
📍 Where we are now
This is the current premium pressure zone. Built from a bearish OB + unmitigated imbalance from late July. First contact is live. If price rejects this level, sellers may regain control short-term. But if buyers break and hold above 3375 → bullish expansion is open. This is our Decision Zone.
🔷 3387–3405 – External Supply Block
📍 Premium target for breakout move
Clean HTF OB + imbalance resting above liquidity. If 3375 gives way, this is the next sniper target. Expect strong reaction — either reversal or inducement wick. Ideal for shorts if price shows exhaustion and BOS on LTF.
🔷 3430–3439 – Final Supply Cap (Weekly)
📍 Extreme supply wick
This is the highest defined zone on the Daily/Weekly chart before unknown territory. Full wick zone, untouched since early May. Reactions from here tend to be sharp. A strong rejection could initiate a new sell cycle.
🔷 3310–3325 – Mid-Demand Support
📍 Pullback buy zone
If price rejects 3375 and pulls back, this is the first area to monitor for higher low formation. Built from bullish OB, Fibonacci 50%, and alignment with internal structure. RSI supports buyers here if retested cleanly.
🔷 3285–3300 – Key Reversal Demand
📍 The origin of the current rally
Strong institutional footprint. Last BOS + OB confluence area. Any retest here is valid for sniper buys as long as no bearish HTF shift appears.
🔷 3240–3260 – Final Daily Demand Base
📍 Only valid if structure breaks down
If we lose 3285, this is the last demand zone holding Daily structure. Deep discount + HTF mitigation block. A visit here would require bearish breakdown first.
🧠 Game Plan Summary
⚠️ Right now, we are in a decision zone (3360–3375). Do not rush. Wait for confirmation.
✅ If we break 3375, next bullish target = 3405, then 3439.
🔻 If we reject 3375, watch for controlled retracement into 3325 or 3300 for buys.
⛔️ Do not sell blindly into current price — we are at equilibrium.
💬 If this sniper breakdown sharpened your vision, show some love ❤️
Comment, follow, and hit that like to stay locked in with GoldFxMinds.
More sniper updates dropping 💥
Powered by Trade Nation – for clear structure and no chart noise.
btc consolidation and downentire bull market has been big impulse move up then consolidation and slightly more down than would be expected with typical bull flag


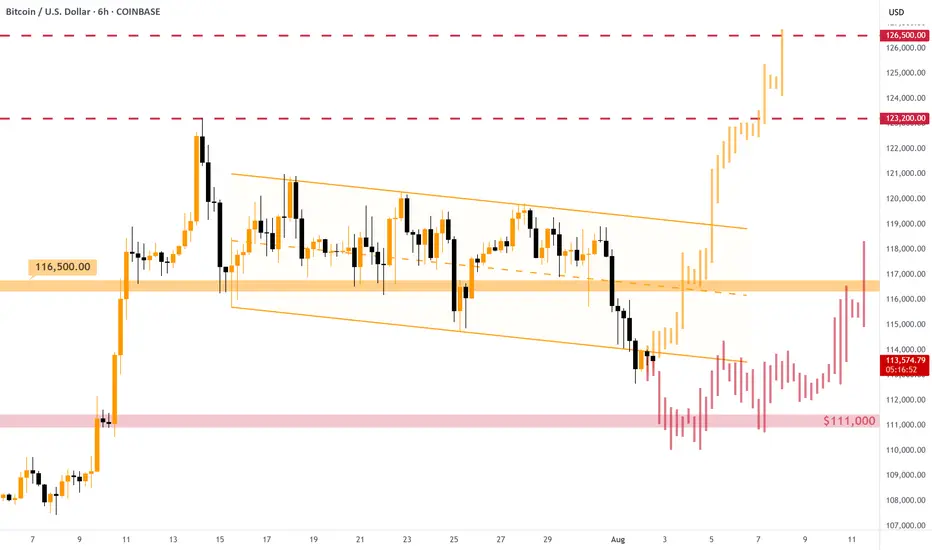
#BITCOIN - Short-Term Options [EXPLAINED]As expected, the price dumped below the descending channel , currently consolidating right below one's support level.
As expected, the price dumped below the descending channel , currently consolidating right below one's support level. On the chart I've described two possible options for the price movement: strictly positive and hmm.. okey.
Strictly positive: some consolidation below the support with, then quick retrace back inside the channel and new upward rally on the next working week. Entering LONG position will make sense after the breakout of the $116,500 resistance, not earlier.
Hmm.. okey: Bitcoin is not strong enough to come back inside the channel and dumps to $111,000 support level. Near this level we must see some consolidation to gather more power. Possible fakes down to $108,000. In some time (1 week+) we will have chances of going back up.
👉 Overall, the support of $111,000 is crucial right now. If we lose it, Bitcoin goes towards $100,000 and the current bullish phase might be considered as finished. For now we still have chances.
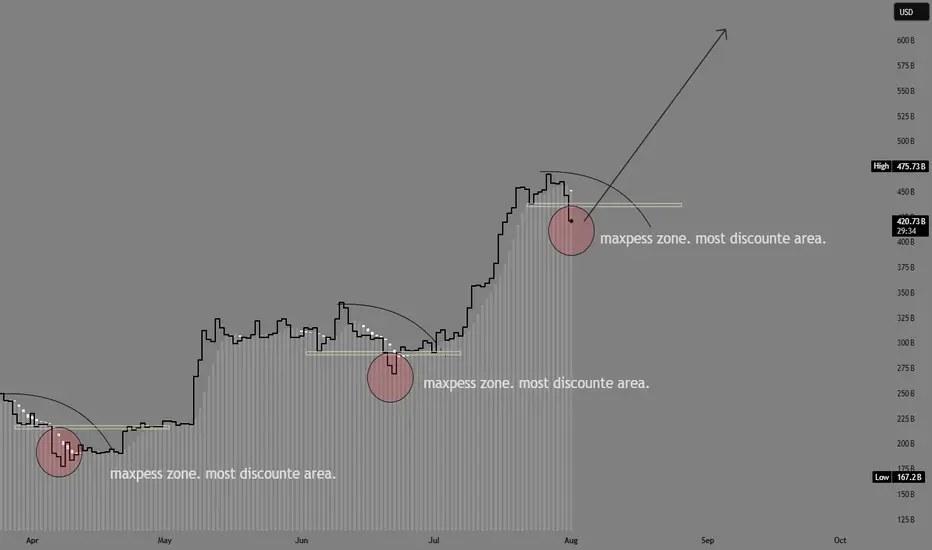
ETH accumulation season 3 has begun at 3.4k. Start loading up!!!ETH has seen impressive price growth for the past few weeks from our original spot at 2.4k -- and it run as high as 3.9k -- almost at our target of 4k.
Now, as with any parabolic moves, eth has to hibernate a bit for that well deserved recharge. This healthy correction at current levels is warranted. 23.6%, 38.2% FIB taps are usually ETHs favorite zone area. This is where most buyers converge as far the most bargain area to position. And we are now at that elusive zone.
A seed from this area is ideal. From our current diagram, you can see we are now on season no.3. This has been doin the same behavior since 160B mcap, and for this next phase, ETH is eyeing 600B mcap from here.
This is in line with our original forecast.
We are now on Month no. 3 as we entered August, my predicted cycle duration would be 17 bullish months till December 2026.
-----------
STONG BUY HOLD at this area. We got a rare elusive season of accumulation that doesnt come very often.
Happy profiting everyone
See you up there.
Spotted at 3.4k
Mid target 5k.
Long term target. 10k.
TAYOR.
Trade safely.