AUD/CAD: Weak in the price actionAustralian Dollar/Canadian Dollar look that the price doesn't continue climb, but we analyze it that in all timeframe in H1 and H2 look bearish, what we ned to change our mindset to short AUD in front of CAD. I will make this quickly analysis to short AUD as the price make resistance in this grey zone that I draw in H1 timeframe.
I entry now in the market price, Stop Loss to $0.8998 CAD and take profit to $0.8914 CAD.
I hope that this idea support you1!!
I closed up my long position now!!!
Trendanalysisexplained

AUD/CAD: Bought in the support zoneAustralian Dollar/Canadian Dollar look bullish in H1 analyzing this chart. I believe that the price will continue climb toward $0.9030 CAD. We could to look another opportunity to buy in the Sydney session in Forex market. i will make a leverage x2 as this it's a good chance to find up bought with hope to find up approx. 11.23% in this trade to grow up my account.
I put a buy order limit to $0.8976 CAD, Stop Loss to $0.8958 CAD. We see a dynamic Stop Loss in this Forex par.
I hope that this trade help you!!!
Good luck
Also, we're in profit in Euro/Canadian Dollar what we're shorting Euro!!!

AUD/USD (Bearish Divergence)Short Call! FX:AUDUSD
At daily significant trendline!
Bearish divergence identified!
After target 1 is achieved close half of the lot and move SL to breakeven and wait for target 2!
Best of luck!

CAD/JPY: Change of market structureCanadian Dollar/Yen Japanese could to forming a possible bought continuation, so, as we was in short position, we closed up this trade as we fall it. this movement. But in based my perspective, we don't see short for now and long for now. At the moment, the market it's move to the upside, but in case that CAD get strength, we could see a bought in the following zone that I mark $104.70 JPY and $104.40 JPY, what we need to closed up and keep away of this trade, if I know it, I closed up this short when we see this bullish movement, what I will take this analysis to work better and not focus in H4 becuase the armonic pattern what I show you fall this prediciton what I thinking. But now, analyzing the H1, we found out that CAD/JPY forming a change of market structure like ascending channel and lower high in the price, what mean a possible change of trend.
I hope that this idea support you, at the moment, we would need to wait a little more, in case to short this trade,we would need to break-out of the EMA 200 and 2nd support zone on $104.35 JPY.
I hope that this idea support you!!!

EUR/CAD: Sell in the supply zoneEuro/Canadian Dollar look that price don't have strength to continue up, but we forming a indecision in the market with a possible market trap for who long EUR/CAD in this point of market liquidation. I don't see long position, by the contrary, we would need to break out this structure of this resistance zone.
I hope that this anaysis support you very well shorting EUR/CAD
Good luck
I put a sell roder limit to $1.3190 CAD, Stop Loss to $1.3244 (-54 pips) and take profit $1.3044 CAD (146 pips)

BTC/USDT (Significant Trendline Broke)Set a buy stop, guys! BINANCE:BTCUSDT
Hello!
BTC broke its significant daily trendline!
Might take rejection from 78.60% Fibonacci level!
So, we may set a buy stop right above the previous HH!
Best of Luck!

CAD/JPYl: Bearish Butterfly PatternCanadian Dollar/Yen Japanese look bearish in this point to overview in H1 timeframe, but we're in the supply zone that Canadian Dollar could to weak very strong this week to $101.38 JPY and see a sell-off in this par.
I decide to put a short position now in the market price, Stop Loss to $104.93 JPY (58 pips) and take profit to $101.38 JPY (296 pips)
The price it's below of the key point to short in the 0.782% fibonacci, a good place to short now and hold this short position.
I hope that this analysis support you if you decide to trade Canadian Dollar to sell-off.
Good luck!!!

BTC/USD: Shoulder Head ShoulderBitcoin forming a Shoulder Head Shoulder Inverted in H4 timeframe and I look that there're a nice opportunity to long Bitcoin toward $25,200 USD.
I entry to long from $23,231 USD, Stop Loss to $22,590 USD and take profit to $25,200 USD. We have a risk/benefit 1:3
I hope that this analysis support you and trade Bitcoin very well!!

SOL/USD: Bought in the demand zoneSolana look very interesting to long in this point. I will consider this trade to long in this cryptocurrency from $40.10 USD. I put my SL to $36.80 USD, And we could to see 2 targets to watch. The first target will be around $46.60 USD. And my expect 2nd target will be around $50.40 USD. It's look a increase of almost 26% in this single trade.
I'm long in Solana now!!!
Meanwhile, we're still in this chartist pattern called bearish rising wedge, and also, we could to look a good opportunity to not only short, but long into this consolidation that Solana forming now. In difference that in H4 and H8 we forming a bullish channel, we expect that only the price still up until $50 dollar.
The H4 still bullish.
So guys, I like to trade in H4 timeframe or above in cryptocurrencies, you can to take a lot time to make anything what do you like, cryptocurrency it's very easy to trade only following the trend, but Forex market, as I know that it's a global financial market, it's very hard and a pure market that you must to read a lot economical news and pay attention what challenges apply the central bank to take decision to change the perspective. And also it's required a lot study continuously.

Cardano look bearish in weeklyCardano look bearish in weekly chart as we see that we're in the bullish correction before to continue drop. But we hope to find down a good opportunity to short ADA, I believe that it's not far to reach down $0.17 cents, but this it's some possibility to happen. But Cardano could to reach down to $0.27 cents in the next weeks to see.
Also guys, buying Cardano below of $0.30 cents it's very good to accumulate ADA in this bear market and preparing your cash to buy this cryptocurrency and hold for ever until reach your own goal. Also, I draw the Cardano logo here and look precious and beautiful my design to present this cryptocurrency for crypto-enthusiastic.
I hope that this analysis support you!!!

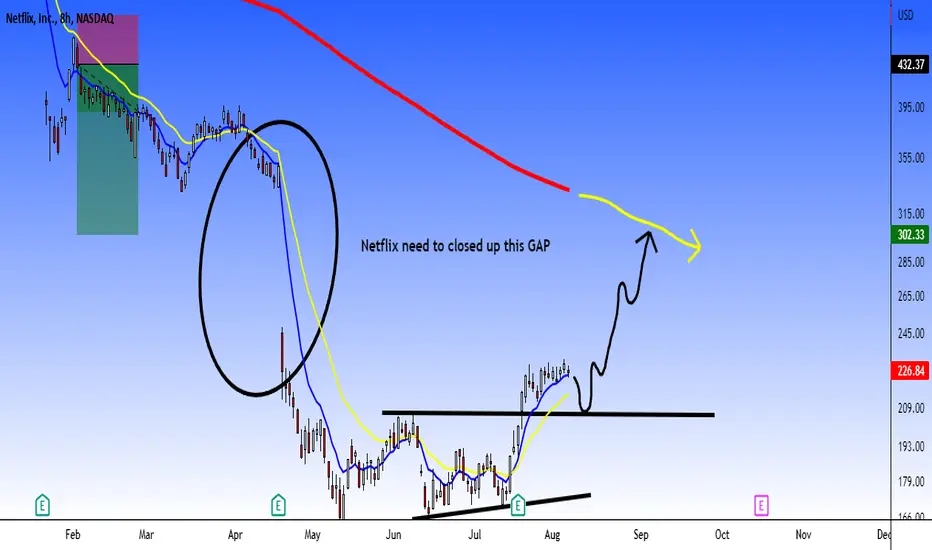
NFLX: Movement to the EMA 200Netflix share look very interesting what I thinking because we could to find up bought in this share, first, we're in the bearish trend, and we would need to see some time to know in monthly timeframe if this it's an accumulation zone to invest or this it's a bear market to analyze it. But with very carefully, we would need to pay attention in short term to know what happen in the market with Netflix
I hope that his perspective help you
ES1 FUTURES / SELL POSITION1-It"s a psycho-resistence zone so take profits if you are in long position.
2- momentum's in decreasing because of the inflation data reports.
3- there is a big divergence.
***Good timing to enter a SHORT position.

Bitcoin it's in the key point to short now!!!Analyzing by Daily timeframe, we're in the good point and Bitcoin continue down. What we could to expect it's that Bitcoin continue down and then break-out this chartist pattern to the downtrend direction. I found out that measure the forecast we can to predict that the next goal it's to reach down to $14,600 USD next target to short. Also, I change my past analysis in Bitcoin in H4 timeframe that we're ok shorting from $24,030 USD. But we see in this point a huge opportunity to get benefit in this bear market.
If you want to follow this strategy and trade by swing trading, you can to entry now in the market price, because in 3 Daily timeframe, I see the confirmation very clearly that Bitcoin goes to another bearish movement soon.
You can to put your Stop Loss to around $26,060 USD. It's a risk of 14% in this trade, but you can to calculate your money management to know the risk and see the benefit. Now, if choose this target $14,600 USD, This could be a benefit of almost 35% shorting Bitcoin. But as I'm shorting from the $24,030 USD, I only extend my Stop Loss to $26,060 USD, And I change my mindset to now take the opportunity to short Bitcoin.
This it's the Daily chart and we see this bearish perspective in my plan to make swing trading. I would like to make day trading when we're in the Gold point to short, and when analyzing the macrotrend like Daily timeframe or more, to take best perspective to short and change my strategy to swing.
I hope that this strategy support you and take best decision to short in this bear market in crypto. I linked my related idea for more information of my past trade in Bitcoin that I explain that I was shorting from $24,030 USD and also my weekly analysis perspective.

Weekly Analysis Overview: BitcoinIn this weekly analysis, Bitcoin it's in the 0.382% Fibonacci level, what we could to expect a market crash of another 40% to see. I expect that Bitcoin goes to $17,600 USD, and also the most lower price will be around $13,450 USD to watch and look if that price could be the stop of the bear market to know what could to happen in the future.
I'm still bearish in Bitcoin and altcoins.

USD/JPY (TA)Short Call! FX:USDJPY
Hello!
Flag Broke!
Making LLs and LHs on an hourly timeframe!
Application of Dow Theory
Application of Chart Pattern

XAU/USD (Trendline Support and Horizontal Resistance)Short Call! OANDA:XAUUSD
Hello!
Gold Test significant trendline!
Test its Resistance!
RR=1:1 recommended!
Best of Luck!

EUR/USD: Supply & Demand zoneEuro/U.S. Dollar forming a supply & demand zone that you can to view in H4 timeframe. But we could to entry to short once that the price forming another sell opportunity that you might to wait
This it's the H4 timeframe, and we have the chance to short EUR/USD
i hope that this idea support you!!!

NAS100USD (Trend Analysis)Long Call! OANDA:NAS100USD
Hello!
Looks like a trend reversal!
It's been in a good bearish run for a while and went in a little consolidation as you can see!
Now, it started making a series of HHs and HLs.
AB=CD Pattern formed!
Having a little resistance RN, most probably gonna break!
I will suggest taking entry after the resistance break, and riding the trend trailing SL along the way!
Best of Luck!

US30. This Move Is Big! If you take a look at at the weekly timeframe you'll see US30 has been in a downtrend since February 2022. Stocks began to decrease significantly taking out 2021 higher lows where most people during the Covid began to invest heavily.
Now, in August 2022, if US30 can push past 33,462, the last lower high this could signal a positive opportunity for people who invest in stocks.
However, if price shows a bearish signal here, more downside could be seen.
I'd like to be hopeful in the scenario this index does present bullish opportunities.
If not, it's best to be prepared. I'll be watching this on the daily timeframe.
Thanks for reading.

Bitcoin: Positive sideBitcoin could to ending this ABC correction pattern, but we could to forming an accumulation zone from this zone. But in case that we break-out the resistance of $30k. This could be confirmed with pull back, and if pass this test, then, Bitcoin will return to the bull rally.
This it's the positive side only that using some key factor that affect the #Bitcoin price.
1) Inflation rate (Gross Domestic product)
2) Interest rate
3) U.S. Dollar news by Federal Reserve (correlated)
4) Macroeconomic news
***It's very important to read what happen in Forex market (correlated with U.S. Dollar) to know the perspective by medium to long term, and using this fundamental analysis, we could to project the decision on how the global market will work.
Anyway, I will make an analysis in the negative side to know if Bitcoin will forming any bearish correction from this point like 2018 when we forming the descending triangle around 6k and drop 50% to $3k on the 4th quarter of 2018.
I hope that this idea support you

Ethereum could to ending this ABC correction patternEthereum could to ending this ABC correction pattern in weekly timeframe what we look an interesting point to view that in based what will be the reaction of Forex market for the next weeks, I can to take a good plan to change my mindset and look possible bought in the new bull rally, but there're some point that we would need to confirm.
1) Fundamental Analysis
2) Technical Analysis
3) Look the sights by medium to long term in based of these first 2 points.
Well, I share this screenshot in weekly analysis that we formed an ABCD correction pattern and we have the same measurement using Fibonacci for harmonic. So, in based of the ABC correction pattern, we could to se a new bull rally soon. But, this rally we need to support by negative news in the global economy, with more correlated with U.S. Dollar, look the interest rates, Gross Domestic Product and more macroeconomic data to confirm it that Ethereum it's in the good point to bought. By the contrary, we could to invalided this pattern and in case of more crash, so, we don't ending the bear market. We're in the bear market yet, but using some point mentioned above, you can to take better decision to invest in crypto or stocks.
Now, I look that in monthly timeframe, we closed up pretty positive to consider a bought, but I'm interesting to trade and check-out the short timeframe like Daily if we could to see a opportunity to trade Ethereum to long.
I hope that this analysis support you!!!

BNB/USDT (Technical Analysis)Short Call! BINANCE:BNBUSDT
AB=CD Pattern Formed!
Application of Harmonics!
Best of Luck!

WK-07 (BTC/USDT)Hello! Chart analysis BINANCE:BTCUSDT
Application of Dow Theory
Application of Fibonacci Retracement
Application of Trendline
Best of luck!
