DHAMPUR SUGAR MILL - Short-term Trend analysisDHAMPUR SUGAR MILL - Short-term Trend analysis
1. V shape recovery, it falls more than 65% from the all-time high...
2. It May be in the over-bath zone.
3. If the stock opens and closes at more than 234 then it may have a short-term up rally.
4. Target is 317 if the market trend reversal.
5. Fundamentally good stock, maybe we can hold for the mid-term for a good profit.
Note:
1. I’m not a SEBI Registered advisor, my research is personal and for educational purposes only.
2. Always check with your financial advisor and take the trade as per your risk/reward ratio.
3. Follow me for more patterns and like, and share so that we feel it is helpful to many and share more patterns...
Trendanalysisexplained

$Matic made a lower high which means down we go from hereA lower high which means down we go from here
$Matic just made a lower high which means down we go from here, My first target is 0.6226 then 0.522
I will know I’m wrong if we made a close above 0.7134, which will be a breaking of lower high and that is my risk defined right there
All we need is for #bitcoin to say the word and boom!

ETH/USD: Daily analysis outlookEthereum it's in this consolidation in Daily timeframe and maybe, I fixed 2 perspective: bullish and bearish (both scenario) to take a perspective to watch in this timeframe.
So, the technical analysis it's interesting and more modern and classic. So, there're a good point to take best decision if you make Day trading.
I hope that this crypto-analysis support you for you crypto-trading.
I'm still in the bear market in Ethereum and rest of cryptocurrencies. I don't missing the opportunity to short cryptocurrencies in this bear market, as long cryptoucrrencies in the bull market like nice opportunity in crypto.

WK-05 (CAD/CHF)Long Call! FX:CADCHF
CAD/CHF seems to be bullish making an uptrend!
Having trend line support.
Application of Dow Theory
Candle Stick Pattern

GBP/CHF: Bullish channel flagGBP/CHF forming g a bullish channel flag and the price could to move to the upward.
What I closed up manually this trade and put a buy orden limit to $1.1660 CHF and target to $1.1783 CHF. And Stop Loss to $1.1608 CHF
The price action charge the way of the market psycology

EUR/AUD: 0.618% Fibonacci gold entryEuro/Australian Dollar look bearish in this side following the bad news in Euro currency and economy and how this Eurozone economy will affect the gas crisis through the world. So, I want to share some screenshot that I share here.
Euro it's look extremely bearish in Daiy timeframe and also, I hope an opportunity that we could to short EUR/AUD during days and weeks to see.
EUR/AUD it's in the gold zone in the 0.618% fibonacci key level and I see a good trade that we could to find down 194 pips in this only trade.
So, I will put a sell order limit to $1.4930 AUD. Stop Loss to $1.5005 AUD (75 pips) and take profit to $1.4735 AUD (194 pips)
So, I hope that this analysis support for you
Good luck!!!

GBP/USD: bearish perspective; udpateSterling Pound/U.S. Dollar it's in the supply zone, but I decide to closed up manually this trade right now. But if we see another opportunity, only we would need to wait the reaction in that grey zone and also in the blue line of the supply zone to watch.
So, I will wait a little more, as I believe that Sterlign Pound get manipulaton in that zone. For that, hope next opportunityt to short in the supply zone.
Meanwhile, we're in the bearish channel and Sterling Pound it's moving to the downside what we can to short GBP/USD
I hope that this analysis support you!!!
I'm in short in GBP/CHF and EUR/AUD.

WK-05 (USD/CHF)Short Call! FX:USDCHF
It seems like USD/CHF initiates a downtrend on an hourly timeframe.
Application of Dow Theory
Candle Stick Patterns

GBP.CHF: short positionSterling Pound/Swiss Franc it's look bearish too like GBP/USD
In H4 timeframe, we formed a bearish butterfly harmonic pattern. And also, analyzing the fibonacci, we're below in the 0.782% to see a possible short position in this trade.
I put a sell order limit to $1.1681 CHF, Stop Losss to $1.1719 CHF (38 pips) and huge take profit to $1.1529 CHF (152 pips)
Good luck

EURO vs USD As shown with the trend lines, Euro is depreciating against the US dollar. Analysing the DMI, the spread between the two primary lines is large and the average directional index is around 38 hence, the trend is strong. We are expecting the EURO to bounce off the bottom of the channel and decrease after reaching the upper trend line.

CHFJPY AnalysisCorrect me if I am wrong as I am a newbie. We are looking at a third touch on our diagonal support, additionally price can be seen that it has created a bull Flag. Our 50% Fib was hit, thus there is a lot of confluence on this trade.

WK-04 (USD/CAD)Short Call! FX:USDCAD
USD/CAD made a bearish move!
Application of Dow Theory
Candle Stick Patterns

CAD/CHF: Daily outlookThis it's my Daily outlook in CAD/CHF in my own perspective to find up bought during the next days!!!

WK-04 (EUR/CAD)Short Call! FX:EURCAD
Making LH and LL at this moment it seems like it is making another LH and will go down.
Application of Dow Theory & Candle Stick Pattern

XAU NEAR FUTURE PREDICTIONS (4HCHART)Technical Analysis Summary
XAU/USD
TREND ANALYSIS
We have 1 Downtrend in red color
Be careful trends need to be modified when broken to the new peaks(Downtrend) and lows (Uptrend).
FUTURE PREDICTIONS
We have many resistance and support levels that I have mentioned above.
I use thickness as an indicator of strength of levels (ONLY FOR VISUALS).
White Levels are levels from my past ideas published or levels that were respected from the past only for explanation purposes.
Good luck everyone, stay safe!
If you need help don't hesitate to send me a message or comment
If you find this content beneficial please don't forget to LIKE and FOLLOW
Trading Involves High Risk
Not Financial Advice
Exercise Proper Risk Management

ETHERIUM 4HOURLY NEAR FUTURE ANALYSISTechnical Analysis Summary
ETH/USDT
TREND ANALYSIS
We have 2 Downtrend in red color (Internal and Long Term).
We have 1 Uptrend in green color Internal Trend (Short term) )
Be careful trends need to be modified when broken to the new peaks(Downtrend) and lows (Uptrend).
FUTURE PREDICTIONS
We have many resistance and support levels that I have mentioned above.
I use thickness as an indicator of strength of levels (ONLY FOR VISUALS).
White levels Levels are levels from my past ideas published or levels that were respected from the past.
Good luck everyone, stay safe!
If you need help don't hesitate to send me a message or comment
If you find this content beneficial please don't forget to LIKE and FOLLOW
Trading Involves High Risk
Not Financial Advice
Exercise Proper Risk Management

WK-04 (USD/CAD)Previous HL broken showing trend changing!
At this moment you can try shorts!
Application of Dow Theory & Candle Stick Patterns

WK-04 (USD/CHF)USD/CHF started making HH and HL showing a sign of trend changing!
Application of Dow Theory & Candle Stick Patterns

WK-04 (USD/JPY)USD/JPY making new LH!
We can take entry at this point!
Application of Dow Theory & Candle Stick Patterns

WK-03 (EUR/USD)Long Call! FX:EURUSD
Previous LH broke showing trend reversal!
Major Support at this point!
Application of Dow Theory
Candle Stick Patterns

USD/JPY: bearish flag channel + SHS U.S. Dollar forming a bearish flag channel in H2 timeframe, you can to view in H1 too, but in H2 we see one thing very good in this analysis. Because in the price action, we formed now a bearish engulfing pattern. But into this price action, we see a bearish flag in formation that the price could to drop. And right now, we forming a Shoulder Head Shoulder (SHS) that it's in formation and we have this chance to put a short position in USD/JPY. Also, we could to put a short position in USD/CHF as USD/CHF will drop too. But in my opinion for USD/CHF it's that if we like to short this par, the price need to break out the demand zone, but we could to have this opportunity to short. But in USD/JPY it's very more clearly than USD/CHF that we could to find a short position in the good point now.
Shoulder Head Shoulder and my projection to $132.20 JPY.
i put a sell order limit to $135.12 JPY and target to the $133.80 JPY (support in the EMA 200) and Stop Loss to $135.68 JPY.
This it's a risk/benefit of 1:2.
Good luck!!!

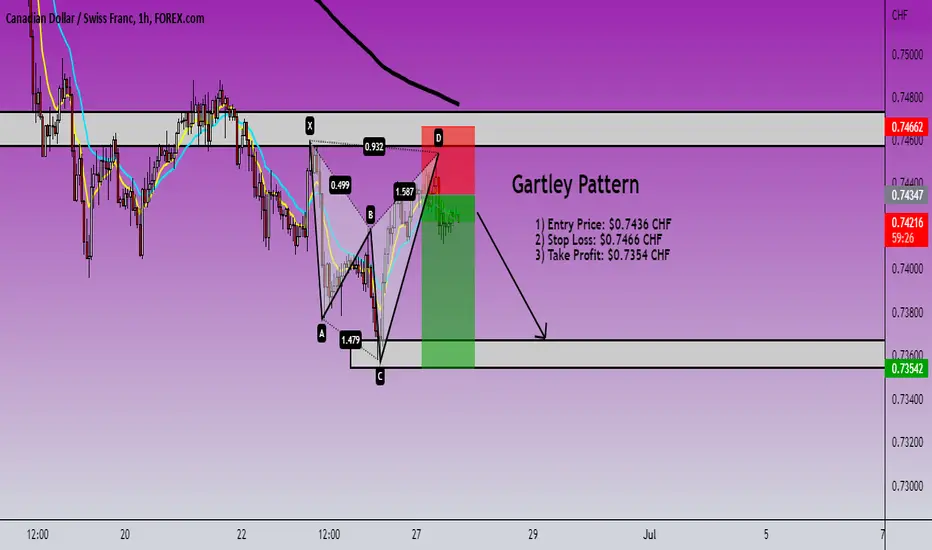
CAD/CHF: UpdateThis it's just my update of my previously analysis CAD/CHF what we're in the good point to short.
The info it's in the display. We forming a Gartley Patternand reach the 1.272% Fibonacci key level to short.
The H4 timeframe still bearish in this par
Good luck!!
ETHERIUM 1HOURLY NEAR FUTURE ANALYSISTechnical Analysis Summary
ETH/USDT
TREND ANALYSIS
We have 2 Downtrend in red color (Internal and Long Term).
We have 1 Uptrend in green color Internal Trend (Short term) )
Be careful trends need to be modified when broken to the new peaks(Downtrend) and lows (Uptrend).
FUTURE PREDICTIONS
We have many resistance and support levels that I have mentioned above.
I use thickness as an indicator of strength of levels (ONLY FOR VISUALS).
White levels Levels are levels from my past ideas published or levels that were respected from the past.
Good luck everyone, stay safe!
If you need help don't hesitate to send me a message or comment
If you find this content beneficial please don't forget to LIKE and FOLLOW
Trading Involves High Risk
Not Financial Advice
Exercise Proper Risk Management
