Welcome Back! Gold Trading Strategy & Key Zones to WatchIn this week’s welcome back video, I’m breaking down my updated approach to XAU/USD and how I plan to tackle the Gold markets in the coming days. After taking a short break, I’m back with fresh eyes and refined focus.
We’ll review current market structure, identify key liquidity zones, and outline the scenarios I’m watching for potential entries. Whether you’re day trading or swing trading gold, this breakdown will help you frame your week with clarity and confidence.
📌 Covered in this video:
My refreshed trading mindset after a break
Key support/resistance and liquidity zones
Market structure insights and setup conditions
What I’ll personally avoid this week
The “trap zones” that might catch retail traders off guard
🧠 Let’s focus on process over profits — welcome back, and let’s get to work.
Trendanalysiss

Crude Oil -DAILY- 21.07.2025Oil prices were steady after their first weekly decline this month, as attention shifted to U.S. trade negotiations and the European Union’s push to tighten restrictions on Russian energy exports. The EU is preparing new sanctions, including a lower price cap on Russian crude, limits on fuel refined from Russian oil, banking restrictions, and bans targeting an Indian refinery and Chinese firms. Despite western sanctions, Russian oil continues flowing to China and India. Meanwhile, diesel margins in Europe remain strong, signaling tight supply.
On the technical side, the price of crude oil has failed to break below the major technical support area, which consists of the 50-day simple moving average and the 50% of the weekly Fibonacci retracement level. The Stochastic oscillator has been in the neutral level since last week hinting that there is potential for the price to move to either direction in the near short term. On the other hand, the Bollinger bands have contracted rather massively showing that volatility has dried up therefore, the recent sideways movement might extend in the upcoming sessions.
Disclaimer: The opinions in this article are personal to the writer and do not reflect those of Exness

EURGBP Analysis : Bullish Setup + Support & Reversal Zone Ahead🔍 Overview:
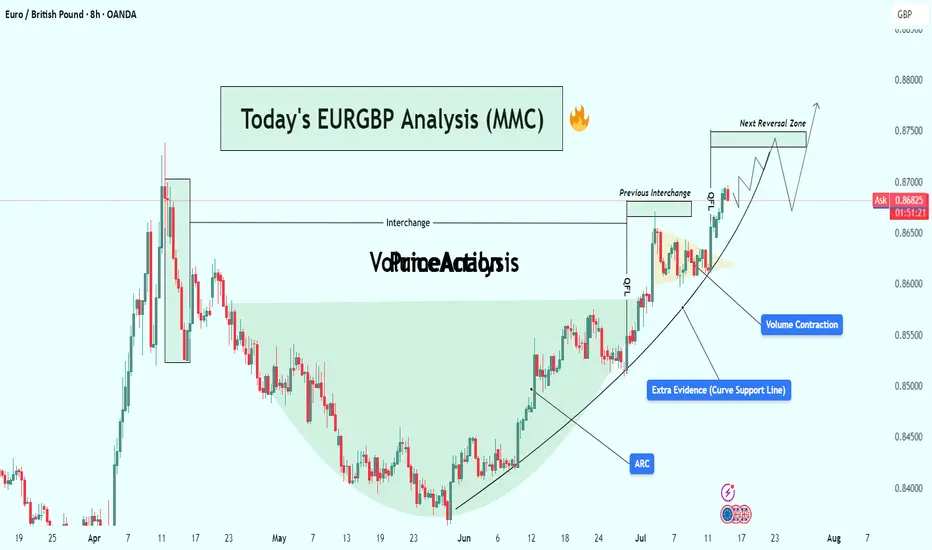
This analysis explores a well-developed Mid-Market Cycle (MMC) pattern playing out on the EUR/GBP 8H chart. The price action has transitioned from accumulation to markup, forming a classic cup-shaped recovery structure supported by a parabolic ARC curve. With strong volume contraction, historical interchange zones, and clean breakouts, this setup indicates bullish momentum heading into the next reversal zone.
Let’s walk through each component in detail and build the case for this trade setup.
🧩 1. MMC Cycle Framework
The chart structure aligns with the MMC (Mid-Market Cycle) model:
Phase 1 – Accumulation:
From April to late May, price formed a rounded bottom resembling a "cup" — a known sign of smart money accumulation. The downward momentum stalled, and sellers were gradually absorbed by larger participants.
Phase 2 – Breakout & Expansion:
Early June saw price breaking out of this base, beginning an aggressive uptrend supported by rising structure. This marks the transition to the markup phase of the MMC.
Phase 3 – Pullback & Continuation:
Price pulled back slightly into previous resistance (now turned support), forming a bullish continuation triangle and breaking out again. A textbook MMC continuation.
🧠 2. Technical Confluences
✅ A. ARC Support Curve
The curved support line (ARC) acts as dynamic demand.
Price has bounced multiple times off the curve, reinforcing its strength.
ARC patterns often signal increasing bullish acceleration, reflecting market psychology as traders gain confidence with each higher low.
✅ B. Interchange Zones
The concept of Interchange refers to zones where support becomes resistance or vice versa.
This chart features two key interchange levels:
First interchange formed after the April high.
Second interchange was retested and held cleanly after the breakout.
These areas indicate institutional interest, and their successful retests confirm trend continuation.
✅ C. Volume Contraction
Volume has been shrinking during the markup, which is counterintuitive but strategic.
In Wyckoff theory, this shows absorption of supply — institutions deliberately suppress volatility to accumulate before the next breakout.
Once the contraction ends, explosive moves often follow.
🎯 3. Target Zone: Next Reversal Area
Price is now heading into a clearly defined resistance zone around 0.87400–0.87500.
This level was respected in prior price history (April peak) and may trigger short-term selling or distribution.
The chart shows a possible liquidity grab scenario at the reversal zone, followed by a corrective move (mini bearish ABC).
📈 4. Price Projection & Scenarios
Bullish Case (High Probability)
Breakout Above 0.87500: Triggers a major leg upward.
Potential extension targets:
0.87850 (Fibonacci projection)
0.88200 (next higher timeframe resistance)
Bearish Case (Short-Term Pullback)
Rejection at Reversal Zone:
A corrective leg toward the ARC or prior interchange.
Ideal re-entry for buyers near:
0.86400–0.86600 zone
Or curve retest near 0.86000
🧭 5. Trade Strategy
🔹 Entry Options:
Breakout Entry: Above 0.87500 on strong candle + volume.
Retest Entry: On dip toward ARC curve or interchange.
🔹 Stop-Loss Ideas:
Below ARC line (~0.86000)
Below last bullish engulfing (~0.86250)
🔹 Targets:
TP1: 0.87500
TP2: 0.87850
TP3: 0.88200 (longer-term swing)
💡 6. Trader Psychology in This Chart
This chart represents a controlled bullish structure — a hallmark of smart money participation. Here’s why:
The rounding base was methodically built without sudden volatility.
Each breakout was followed by healthy retests (no fakeouts).
Volume stayed low during markups, reducing retail confidence and allowing institutional loading.
The ARC curve reflects increasing confidence and participation — buyers consistently stepping in on higher lows.
📌 Conclusion
This EUR/GBP setup is a textbook MMC/ARC structure with multiple confirmations:
Smart accumulation
Curve support respected
Volume and structure aligned
Clear next resistance zone
Whether you’re swing trading or monitoring for breakout scalps, this is a high-quality setup worth tracking. Be ready to act at the reversal zone, as it will either confirm continuation or offer a lucrative retest entry.
🔔 Follow for More:
I post regular MMC, structure-based, and Smart Money trade setups. Drop a like, comment your thoughts, or ask questions below!
XAGUSD Analysis : Squeeze + Curved Support Break + Bearish SetupThe XAGUSD 4-hour timeframe presents a structurally rich bullish setup, displaying signs of smart money accumulation and directional bias toward a potential breakout. Price action is currently compressing beneath a major horizontal resistance, supported dynamically by a Black Mind Curve, indicating progressive demand absorption by larger players.
This structure — characterized by rounded, ascending support and multiple rejections off a flat resistance — resembles a re-accumulation cup-like formation beneath a key supply level. These conditions often precede high-probability breakouts, driven by liquidity engineering and retail trap setups.
🔍 Key Technical Elements:
🟢 1. Black Mind Curve Support (Dynamic Demand Zone)
The curved trendline support represents an institutionally significant accumulation level, respected over multiple sessions. Note the price’s consistent reaction at this curved support, producing long lower wicks and bullish engulfing candles — both signs of liquidity grabs followed by strong buyer commitment.
This curve essentially acts as a visual footprint of algorithmic buying interest — creating a controlled, higher-low structure leading into the resistance wall.
🔵 2. Major Horizontal Resistance Zone (~37.20–37.40)
This level has served as a historical sell-side liquidity pool, having rejected multiple attempts to break higher over the past weeks. Each approach has been met with selling pressure, but the gradual compression of price against this zone hints at an impending breakout. Repeated testing of resistance with higher lows builds pressure — a classic ascending re-test model.
🟡 3. Break of Structure (BOS) Levels: Confirmation Zones
Minor BOS (~36.20): Confirmed. Indicates bullish intent and short-term trend shift.
Major BOS (~35.80): The ultimate invalidation level. If broken, the bullish thesis is compromised, and price may re-enter the lower consolidation zone.
A bullish BOS above 37.40 would mark a true breakout and open the door to 38.00+ levels.
🔴 4. Liquidity & Smart Money Behavior
The long wicks and deep retests into the Black Mind Curve suggest stop-loss hunts and liquidity inducement. Institutions often use such zones to trap breakout traders early, accumulate orders below swing lows, and then reverse the move. The price action around July 3–10 reflects this behavior clearly.
⚫ 5. Volume & Momentum Consideration
While not shown in the chart, volume confirmation is critical here. A breakout above resistance should ideally be supported by increased volume and momentum divergence on RSI/MACD. A failure to confirm could indicate a fakeout trap, which is not uncommon in commodity markets like Silver.
📌 Strategic Trade Scenarios:
🟢 Bullish Continuation Setup:
Trigger: Break and 4H candle close above 37.40 resistance
Retest Entry: Wait for price to retest broken resistance (now support) with bullish confirmation (engulfing, pin bar, etc.)
Targets:
TP1: 38.00 (psychological round number)
TP2: 38.60–38.90 (measured move target from structure base)
TP3: 39.50 (extension target)
Invalidation: Break below 36.00 with strong bearish volume
🔻 Bearish Rejection Scenario:
Trigger: Sharp rejection from resistance zone followed by breakdown below the Black Mind Curve and BOS levels
Confirmation: Close below 36.20 with high volume
Targets:
TP1: 35.80
TP2: 35.20 (curve base)
TP3: 34.80 (range bottom liquidity zone)
Invalidation: Return above 36.80 after rejection
📘 Market Context & Professional Insight:
This is a high-probability continuation pattern in a bullish macro context. With interest rates stabilizing and commodity demand remaining firm, silver often trails gold in performance but catches up with volatility. Traders must watch the behavior around the resistance level, as that’s where smart money will show their hand.
Institutional traders typically accumulate below resistance and engineer a breakout with controlled price action — and this chart is a textbook display of that setup. The Mind Curve structure mimics Wyckoffian schematics in the re-accumulation phase.
Timing is crucial — breakout traders should be patient and disciplined, avoiding premature entries before a valid confirmation of strength.
✅ Conclusion:
Silver (XAGUSD) is approaching a critical juncture. The chart structure suggests an imminent breakout above major resistance, supported by institutional behavior along the Black Mind Curve Support. However, traders must remain agile — watch for breakout confirmation or signs of a false move followed by distribution.
This chart embodies a calculated bullish bias, and offers a great risk-to-reward opportunity for both trend followers and breakout traders.

EURGBP 8H Analysis : Breakdown + Smart Money Structure + Target🧠 Phase 1: Arc Formation – Accumulation by Smart Money
The arc (May to June) reflects an accumulation base where price made higher lows with consolidative wicks and slow momentum, ideal conditions for institutional orders to build long positions.
Liquidity is swept below swing lows, stopping out early longs — this is classic smart money accumulation.
Volume compression during the arc followed by expansion on breakout confirms smart interest.
🔑 Psychology: Retail was likely selling here due to lower highs, while smart money was accumulating quietly at the bottom of the arc.
🚀 Phase 2: Breakout & Rally to Previous Highs
Price cleanly breaks above the arc’s neckline and previous resistance (labeled as Previous Target).
Momentum accelerates rapidly toward the reversal zone, likely due to stop hunts and FOMO buyers entering after confirmation.
Structure shifts bullish, creating strong impulsive candles — but these are often final exit points for smart money.
📌 Key Sign: Breakout aligns perfectly with market inefficiencies being filled, often a sign of a short-term top formation brewing.
🔄 Phase 3 : Reversal Zone – Distribution Phase
Inside the Reversal Zone (0.8650–0.8680), price shows exhaustion with multiple upper wicks and slowing bullish momentum.
Distribution signs: choppy movement, lower highs, and eventual breakdown.
Retail is often caught entering longs here on confirmation, while institutions offload their positions.
🧠 MMC Insight: This is where Mind Market Curve transitions from bullish impulse to corrective leg down — phase of deception.
📉 Phase 4: Structure Breakdown & Bearish Market Behavior
Price breaks through short-term higher low structure — confirmation of bearish intent.
The formation of lower highs and lower lows marks the beginning of a bearish trend shift.
Market is now targeting Major Support (0.8500–0.8520 zone), which is currently being tested.
🧭 If price breaks below 0.8500 with volume and aggression, next level is likely near 0.8430–0.8450.
⚖️ Current Price Location: Major Support Test
We’re at a critical decision point.
If support holds → expect a bounce to 0.8600–0.8620.
If it breaks → expect continuation to next liquidity pool below 0.8450.
This zone is where buyers and sellers will battle. Wait for:
Bullish confirmation (reversal pattern / engulfing candle) to go long.
Bearish breakout (close below zone + retest) to go short.
🔁 Summary of Scenarios
Scenario Conditions Target
✅ Bullish Bounce Rejection at support with bullish engulfing/pin bar 0.8600–0.8620
❌ Bearish Break Close below 0.8500 + retest as resistance 0.8430–0.8450
🔖 Educational Takeaway
This chart teaches how to:
Identify accumulation via arc and understand smart money behavior.
Recognize false confirmation zones (where retail enters late).
Understand structure shift as a trend reversal signal.
Execute trades based on reaction zones, not emotions.
If you follow MMC (Mind Market Curve), this is a textbook transition from:
Accumulation →
Expansion →
Distribution →
Breakdown

EURUSD Outlook – Long, Medium & Short-Term Analysis🔹 Weekly Chart:
The broader structure remains technically bearish. We've recently seen a trend reset, which could mark the beginning of a fresh downside leg.
🔹 Daily Chart:
A clear bearish trend reversal pattern has formed, accompanied by a manipulation phase. A confirmed break structure is now in place. As long as price remains below 1.15734, short positions remain valid.
🔹 4H Chart:
Currently in a range-bound phase. A confirmed break below 1.1371 will be a key bearish trigger for potential selling opportunities.
🔹 1H Chart:
Still ranging, but a valid Lower Low (LL) has already printed. A second LL below 1.1371 would confirm a short-term bearish continuation.
On the flip side, a break above 1.1495 would open the door for a bullish move in the short term.
📌 Key Levels to Watch:
Bullish above: 1.1495
Bearish below: 1.1371
Critical invalidation: 1.15734
Trade safe and stay disciplined.

What Is Momentum – And Why It’s Not Just a Trend IndicatorMost traders follow price — candles, trendlines, support/resistance. But there’s another layer that often tells the story before the price moves: momentum.
⸻
🔍 In this post, you’ll learn:
• What momentum really measures
• Why it’s not the same as price direction
• How momentum can signal a shift before the chart confirms it
• Why combining momentum with structure improves timing
⸻
📈 Momentum ≠ Direction
Price can be rising while momentum is fading. That’s often a clue of an upcoming slowdown or reversal — long before the price turns. Similarly, price can be flat, while momentum builds in one direction. That’s tension… and tension leads to moves.
⸻
🔥 Why Momentum Matters:
• It reveals intensity, not just direction
• It can act as a leading indicator — not lagging
• Momentum divergences often hint at hidden accumulation or distribution
• Tracking it helps you avoid late entries or false breakouts
⸻
🔧 Takeaway for traders:
If you’re only watching price, you’re only seeing half the picture.
Momentum shows what’s driving the move, and when that drive starts weakening.
⸻
💬 What’s your favorite momentum indicator? RSI, %R, CCI, or something else?

CHF/USD Bullish Cup Formation | Support & Breakout Target Pattern Formation: Bullish Cup & Handle Breakout Setup
The price action on this CHF/USD 1-hour chart exhibits a Cup & Handle pattern, which is a well-known bullish continuation setup. This pattern suggests that buyers are gradually gaining control and a breakout could be imminent.
1️⃣ Understanding the Cup Formation
The cup shape (curved blue line) signifies a gradual accumulation phase, where price initially declined, formed a rounded bottom, and then started recovering.
This indicates that buyers are regaining momentum after a consolidation period.
The lowest point of the cup formed around March 16, from where the price began a steady upward move.
2️⃣ Key Support & Resistance Levels
Support Level: The strong demand zone is established around 1.1300 - 1.1320, as shown by multiple price bounces.
Resistance Level & ATH (All-Time High): The price struggled to break 1.1450 - 1.1470, indicating a major resistance zone where sellers previously took control.
3️⃣ Handle Formation & Pullback
After reaching resistance, the price formed a slight retracement (small descending wedge), which created the handle of the pattern.
The pullback was necessary to clear short-term overbought conditions before a potential breakout attempt.
4️⃣ Trading Strategy & Price Projection
🔹 Entry & Breakout Confirmation
If CHF/USD breaks above 1.1450 - 1.1470 with volume confirmation, this will validate the Cup & Handle breakout.
A confirmed breakout suggests further upside momentum toward 1.1570 - 1.1600, aligning with the pattern’s measured move.
🔹 Stop-Loss Placement
A logical stop-loss should be placed below the handle’s low (~1.1300 - 1.1320), in case of a false breakout or sudden market reversal.
🔹 Target Projection Based on Pattern Measurement
The height of the cup (~200 pips from bottom to resistance) is projected upwards from the breakout level.
This results in a take-profit target of 1.1575 - 1.1600.
5️⃣ Additional Technical Confluences
✅ Trendline Support: The price is respecting an ascending trendline, indicating continued higher lows and bullish sentiment.
✅ Bullish Momentum: The series of higher lows confirms a strong uptrend, favoring buyers.
✅ Potential Fakeout Risks: A failed breakout below 1.1300 could invalidate the bullish outlook, leading to a deeper retracement.
6️⃣ Final Thoughts: Is This a Good Setup?
📌 Overall Bias: Bullish ✅
📌 Breakout Confirmation Needed: Above 1.1450 - 1.1470
📌 Target: 1.1570 - 1.1600 🎯
📌 Risk Management: Stop-loss below 1.1300
If CHF/USD sustains momentum above resistance, traders can anticipate a strong bullish rally toward the projected target. However, it’s essential to wait for confirmation before entering long positions. 📈🔥

Gold (XAU/USD) Pullback – Key Support Levels to Watch"📈 Chart Pattern:
Gold has been trading inside an ascending channel, showing a strong uptrend. However, the price has started to decline from resistance, signaling a potential correction.
🔹 Key Levels:
Current Price: $3,036.77
Support Target: $2,980.48 - $2,978.25 (First key support level)
Stronger Support: $2,829.63 (Major trendline support)
📊 Trading Plan:
Short-term traders may look for a sell setup toward $2,980 if the price continues its pullback.
Buyers should wait for support confirmation before entering long trades.
If price breaks below $2,980, the next support to watch is around $2,829.63.
⚠️ Risk Management:
A return above $3,050 could invalidate the bearish pullback scenario.
If the price bounces from support, buyers could target new highs.
💡 Conclusion:
Gold is currently experiencing a pullback after a strong uptrend. Watch key support zones for potential trade opportunities. 📉📊

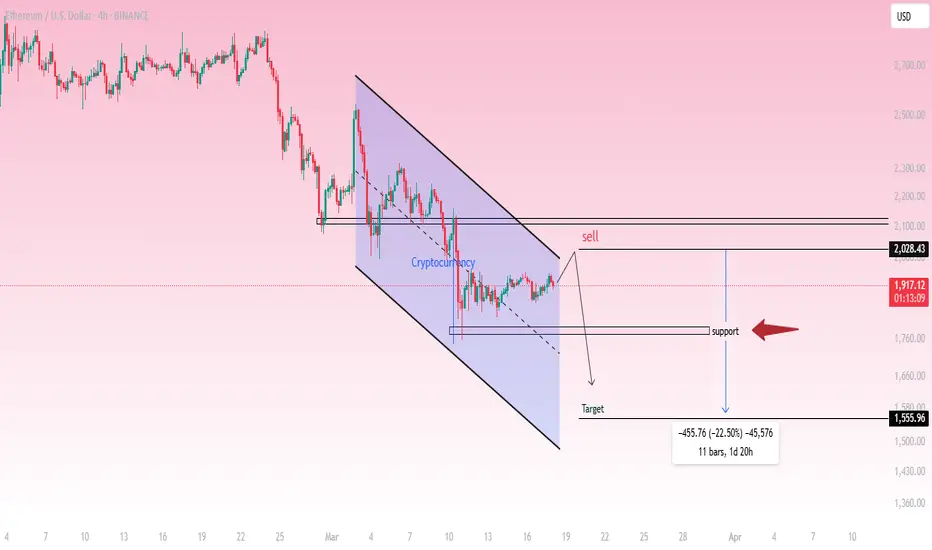
Ethereum (ETH/USD) - 4H Analysis & Trade Setup
Market Overview:
ETH/USD is in a downtrend, forming a descending channel.
Price is currently trading around $1,915.23, showing signs of consolidation near resistance.
Technical Analysis:
Trend: Bearish
Resistance Level: $2,028.43
Support Level: $1,760
Target: $1,555.96
Pattern: Descending Channel
Trade Idea (Short Setup):
🔴 Sell Zone: Around $2,028.43 (Resistance)
✅ Target: $1,555.96 (-22.50%)
⛔ Invalidation: A breakout above $2,028
Conclusion:
Ethereum is respecting the downward channel structure.
A rejection from resistance at $2,028 could confirm further downside.
Traders may consider short positions targeting $1,555.96, provided the trend remains bearish.
📉 Bearish bias remains intact unless price breaks above resistance.
XAUUSD BUY NOW XAUUSD - GOLD
TRADE SETUP & KEY POINTS :
4Hr time frame forming a Parallel Channel.
Market Coming Channel Bottom.
Support Level - 2710 $
Next Support & Channel Bottom - 2692 $
Entry - Focus on Support Levels
Target - Channel Top
Stoploss - Channel Breakout ..
Happy trading .. we will Update soon ..

GRAB It Before Breakout...L&T Technology Service Ltd seen a breakout above 5800. Now its trading in range upto 4800-5800. You can watch a big upside move after breakout and its next resisence is 8000-8200...

EURCAD: Bearish Momentum in PlayHello Traders,
Trust trading has been awesome for you.
Please find below my analysis of the EURCAD currency pair from H4 perspective.
Trend & Sentiment
The pair remains bearish, forming lower highs and lows. Sellers maintain control, though the current consolidation suggests temporary indecision, even though price is facing resistance around the 1.48591.
Key Levels:
Resistance: 1.48591
Support: 1.47211
Possible Movement
A break below the equilibrium at 1.47993 could accelerate bearish momentum toward 1.47211 and 1.45831. A short-term pullback to the resistance at 1.48591 is possible (as we saw the buyers temporarily pushed above this region and closed back below it) but likely to face renewed selling pressure.
Short-Term Target: 1.47800
Medium-Term Target: 1.47211
Long-Term Target: 1.45831.
This trade may last from now till 22nd November or beyond to fully unfold.
Conclusion
The bias remains bearish, with a focus on the downside targets unless the price breaks above 1.48898 to challenge the trend.
Cheers and happy trading!

EURCAD still bearish expectations
EURCAD in last week we are have strong bearish trend, technicalls are be strong bearish and one of impacts is come from USD weakened.
On 4h TF we can see bearish expanding triangle, bounce from top zone of triangle is start on 26.8 price is fall 200PIPS.
Now for new week, next periods, based technically here still strong bearish expecting.
Based on price action can see 1.49500 strong zone is breaked on 30.8 Friday, which will use for one more good sign for bearish still to see.
TP1: 1.47100 (200)
All best, here for comments, stay tuned!

Gold's Next Move: Will XAUUSD Bounce or SlideDespite the current bullish trend, our technical analysis suggest a potential sell. A breakout above the trendline would confirm a buy signal, while a breakdown below the zone would indicate a sell opportunity.

Gold Market Outlook: Bullish Trend Expected To PersistOur technical analysis and market indicators suggest that gold will continue to exhibit bullish behavior tomorrow, Identified buy level at 25 and 20, building on the momentum established in recent trading sessions. This optimistic forecast is supported by robust fundamental factors, including:
- Strong investor demand for safe-haven assets
- Central banks' continued gold reserves accumulation
- Favorable macroeconomic conditions

Continuation of selling of SPXAs we confirmed the trend reversal for the moment, we might have possible two scenarios:
We might have similar push up during the night before continuation of a drop
Secondly, if we get higher prices during the night or at NYSE open, we might continue our way down until we got extended.

Savola group 2050 - Bullish Signs
Show some strong signs:
1- Break 200 ma
2- Break Daily 200 ma
3- Break VWAP
Price Target
TP1: 48.3
TP2: 50.4

NTPC Buy 26 Jun 2024Hey guys,
Check out this NTPC chart for tomorrow. It is showing support at 357 and it has started bullish move yesterday. I see potential till 371.
So, to summarize, Entry at 361, SL 357 and profit 371. See you tomorrow NTPC.
For such analysis, stay tuned.

GOLD|They are still the winners of the seller's marketAs we expected from gold, when we said that the selling pressure is more, it crossed the 2048 support area with great strength, in this area we did not have a suitable candle confirmation to enter the transaction. Arriving at the next support area that we mentioned before, by observing the pin bar candle Ascending in the price area of 2033, we could enter into buy transactions, which has already given us 160 pips of profit.
Continuing the movement with the growth experienced from the support area, I am still waiting for the price to reach the resistance areas to enter sell trades, the most important area ahead is the midline of the descending channel that has already been broken and the supply area price 2055. In case of reactions Returning from this area, as I said, we can place up to the price of 2035 equivalent to 200 pips for the profit limit.

Tasi - CONSUMER SVC INDEX - Bearish Signs Show some weak signs:
1- Double top
2- Traingle after strong down move
There is no sign yet for price to go up RSI under 50 and RSI MA, if price continue down
target will be:
TP1: 200 MA
TP2: 4257 level

GBpAUD - November 25, 2023. GBB/AUD - November 25, 2023.
From the most preferred currencies of thousands. Perhaps that's why I forgot about an active trade for 5 months, and it had gone exactly 10K pips in my favor. Anyway.
As we are at the end of the fourth quarter of 2023. If we go back and analyze GBPAUD in 3 months, it gives us an image of a double bottom. The double bottom has been respected positively, and now, since the beginning of 2023, this pair has been rising from the points where it was at 1.59; currently, it is trading at 1.91. A lot of pips, right? Let's continue.
From my perspective, I see GBPAUD during 2024 reaching 2.02. Not too much, right? For those who are familiar with this pair, they know.
In the monthly view, if we look at the current state, we see that it is re-testing a support (to mine) at 1.90 and it is taking some time.
In the weekly view, there is a double bottom, and according to my opinion, it is directly related to what is mentioned above (expecting it to reach 2.02).
Anyway, when we open the daily chart, we see that the price has remained in a small zone but, importantly, where the movements that are coming are crucial to determine where it will go later.
I expect it to reach the third point of the trendline and the support (below) that it has, and if it holds well at this point, then GBPAUD will start to rise.

GBPUSD: 1.2179 is strong so be careful! Hello traders,
1.2179 is strong enough to retrace the GBP. We'll wait for any breaks out of the level before putting sell orders.
There is one entry and1 TP for this pair.
Levels calculated order_block, regarding support and resistances, channel and pivot points.
