BTCUSD Support On Resistence possible inverted H&S and DW Wedge Fining Support On Resistence line from december highs possible inverted H&S and will combine with a Break out of the downward Wedge we have been in since january 20, 2018. If the inverted head and shoulder does continue to form and we get a confirmed breakout we will see a break out of the this wedge. The inverted head and shoulder gives up a break out target of about $9500 but this will also trigger the break out of the downward wedge and that will give us a target of about $11500 -$12500. We still need alot to happen over the next 2 weeks or next 11 days as we need a slight correction to form the right shoulder and then we should have a strong push up and through our resistence at $7800 area which will catipults us up for a overall target of $12,500. If we hit this target we will be in a confirmed bull trend and money should flow in strong. But getting above 10K first will be a significatn move and will bring back all the retail investor and big money. So we are at a exciting point in BTC especially coming after about 60 days of misery and downward price action. Happy sunday everyone and happy trading. Lets have a good day and spend some time with your families
Trendbreak

Double Top & TrendLine Break & Retest & StructureAudjpy has broken the neckline of long moving up trend. Breaking candle is nice and long. Retest will be at a strong local nice and a nice fall can be seen from there.

USDCHF potential break of pennantso we saw usdchf almost make it to the top of the pennant and begin its move down. We will be watching for a break and retest for a potential short.

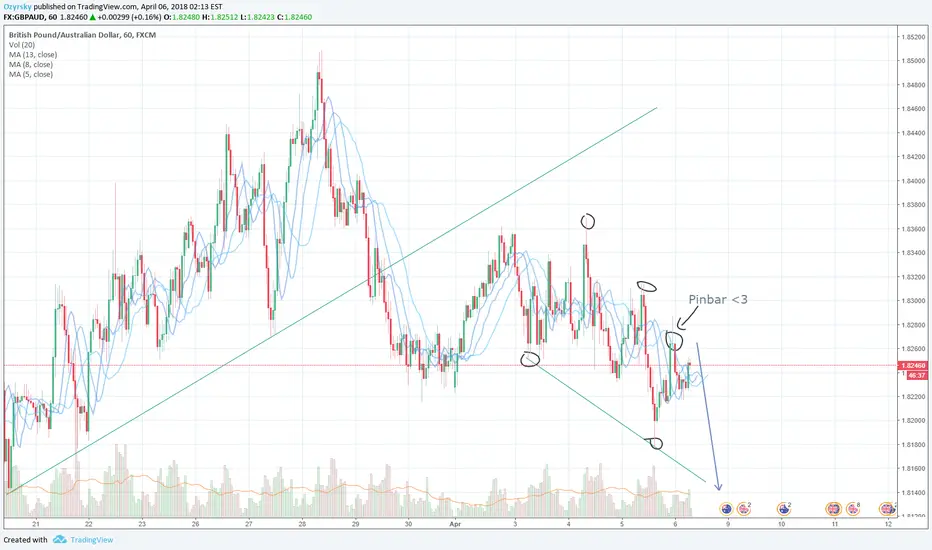
GBPAUD - ShortIn my opinion its perfect place to short till 1.80015.
Stop loss at the end of the pinbar on h1.
Strong Resistance at 0.79950 - 0.80016 ZoneMajor resistance at 0.79950 - 0.80016 Zone; Fibonacci Retracement Level 0.236 - 0.382 - Probable retracement back to minor support zone at 0.7980. Looking forward to see how this one plays out with current downtrend.

TRX (TRON) Time 2 BuyTRX has found it's floor opportunity to buy at the floor so u can sell at the ceiling, just don't go chase after it's at the ceiling ;-D

Interest Rates Look Bullish: TBF is the ETF to BuyOn December 20th I posted an idea for a long position in AMEX:TBF based on the likelihood of the asset breaking out of its long-term downtrend and short-term wedge pattern. Here is the link to the original idea:
Today this breakout is taking place and I am initiating a long position in TBF. Given the technical backdrop and the fundamental/economic drivers, I believe this represents a solid opportunity for alpha generation.
Initial Target Price: $25.00
Stop Loss: $21.49


Gold preparing for a big upward move?Gold broke through the downsloping trendline, I now expect a retest of the former trendline, a test of the 23.6 fib level or one of the recently formed upsloping trendlines. If these levels hold as support there is a big upside potential on this asset.
If you have any comments or feedback on this analysis, feel free to share!
Happy Trading!


Short term Friday USDJPYLooks like its gonna break the diagonal support, its friday so I will likely to be conservative on target.

ETH Down Trend Broken Found Support at 200 MA + .618 fib level You read the title you saw the chart ETH is a strong buy right here!

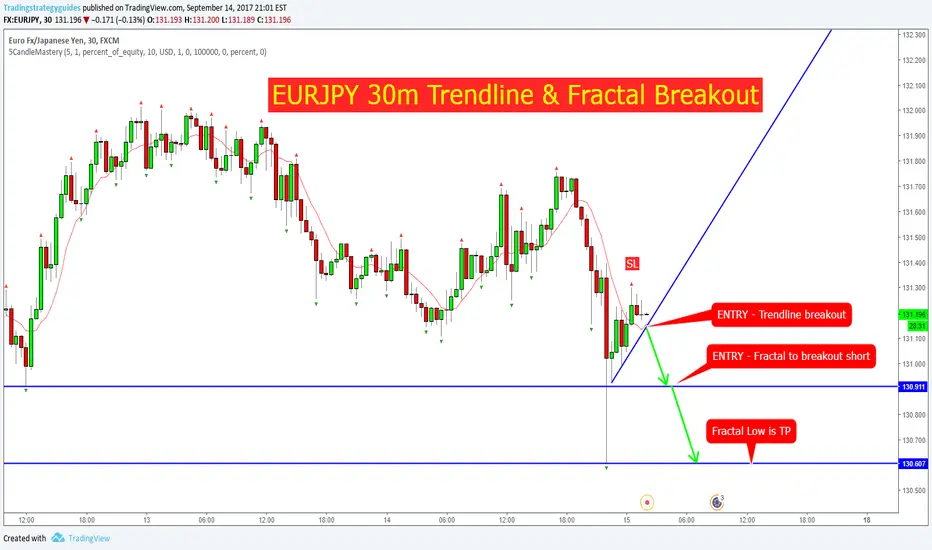
EURJPY 30m Trendline & Fractal BreakoutFirst entry will be a trendline breakout on 5m/15m Break-Hook-Go
Second Entry will be with a sell stop at previous fractal low @ 130.91
TP is current fractal low @ 130.60
USDCAD falling wedge + trend breakI'm going to be patient for this one, price has broken the trend and retested, however I'm waiting for a Moving Average crossover as I might get caught out by ranging price action.
I'd say the 0.5 Fib level would be a good place to put a TP, but if you're feeling adventurous you could go for the upper resistance around the 100% Fib range.

WAITING FOR CONFORMATION MARKET FORMED A 4H DOUBLE TOP & WAITING FOR CONFORMATION OF TREND BREAK TO TAKE SHORT . ..... LOOKING FOR A 90-110 PIP DROP HOPING FOR A BREAK IN DAILY SUPPORT .

USDJPY Next leg direction?After the bearish cypher pattern is close to completing its 38.2 retrace, what's next? Right now it's at an interesting point as it rests on top of the downward trend channel and takes a breather. Quite simply we need to wait and see but it's certainly an area of interest. I'll be looking to price action to look for a good entry either way.

Breakout of ConsolidationConsolidation Rectangle Breakout and Trend line breakout confluence.
Short to key level.
CAD to strengthen following oil price increases.
Wait for retest of rectangle

USDJPY Quick 60 pip short!!!USDJPY have been trending then breaking trend for the past few days. Expected to crash down to previous support, then possibly another consolidation for a day, then another crash.


EUR/USD potential move to the downside.There is a potential move to the downside on the 4 hourly time frame. This one looks pretty obvious to me with the Cypher pattern and trend break in the vicinity together with confluence on the pound. Many traders will put their stops in the same place so there is a possibility that the price may spike up a little past 1.07800 before falling back down therefore it is best to wait for confirmation on the lower time frames (1hr/15m) before selling. This approach will also improve R:R.
There is around a 4:1 R:R on this and around 150+ pips to be had if we can catch it. Use good money management and best of luck!

RSI Divergence: Buy Mar17 110 Puts @ $2.50. FISV's long uptrend was broken in September. Prices have subsequently rallied and are testing previous highs. The RSI has not followed and is showing a divergence. Look to buy Puts when prices break the Keltner Channel.
Play to first profit stop at 34EMAH.

EURCAD - EASY MONEY Double BottomHere we see a rising RSI, weak candles, all moving into a support. I expect to see a bounce in the coming weeks.
