CADJPY Successful Live tradeI am providing an update on the ongoing CADJPY sell trade. All the confirmation levels have aligned in favour of the short position, validating our initial analysis.
As anticipated, the price swiftly broke below the 1dh (one-day high) and continued its downward movement, breaching the structure (4). This development confirms the bearish momentum in the market.
The trade was eventually closed out at the trail stop, coming just 5 pips short of reaching the initial target. While the trade did not fully achieve our desired outcome, it still resulted in a profitable exit.
Additionally, I have conducted analyses on the GBPUSD, AUDUSD, and USDJPY currency pairs. These analyses provide valuable insights into their respective market conditions and potential trading opportunities.
Wishing you continued success!
Trendchange

$EURUSD PULLBACKFX:EURUSD is in a pullback after a 4H TC, entering a 4H demand zone with no reaction yet, waiting for big banks to lunch their trades maybe after the ISM .
Keep in mind that the daily is bearish .

Live Trading GBPJPY Potential Trend ChangeWe have observed a significant development on the daily chart known as a Structural Failure, indicating a potential shift in the trend. The price experienced a notable pullback beginning on Friday, and today, analyzing the daily candles using the 4Bar rule, we have noticed a stronger downward conviction on the 5-minute chart.
If the price remains below the 1DH (1-day high) throughout the day, there is a high likelihood that the downward slide will persist.
We hope you find this information insightful and enjoyable!

EURUSD Trend Change?Earlier today we saw a trend changing pattern in EURUSD. In light of this move, we are expecting another attempt to break lower.
More info in the video.
Enjoy

STARHEALTH : Trend Change with Strong Breakout (with Volumes)STARHEALTH : Breakout
Trend Change : U can clearly see Trend Change happening as its making HH & HL Structure.
Good Volumes & Strength
Quick 5-10% Possible then keep trailling
Follow for more Learning and Earning.

TRX/USDT pumping is near?Hi Dears
Do you heard about WOW TRADE strategy?
We have a higher time frame trendline line (weekly). We are near the demand in control zone of higher timeframe. We break the trendline and after that we have a pullback to the trendline, base that cause this breaking or break even zone.
After that the price will be in the moon.
And now we are watching this strategy for trx usdt.
I hope it works properly.
Sincerely
Hosein Poursaei

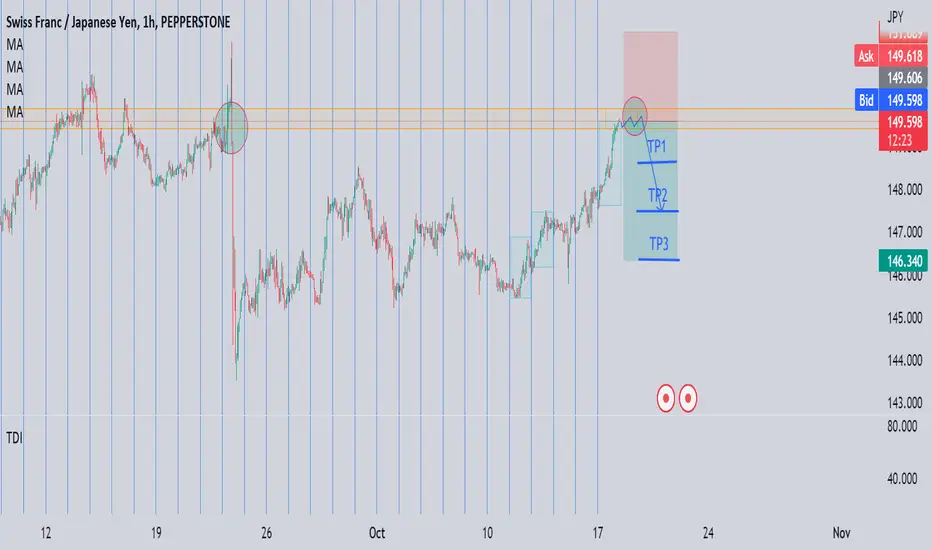
✅CHF_JPY BREAKOUT|LONG🚀
✅CHF_JPY broke the key structure level
While trading in an local uptrend
Which makes me bullish
And as the retest of the level is complete
Bullish continuation will follow
LONG🚀
✅Like and subscribe to never miss a new idea!✅

Bitcoin could run to 30KFirst target just under 30K next 33K (very likely to pull back here). Just make sure this trend line break holds.

Spx bull scenarioNew model, new perspective. There is a strong trend line from 2008 unloading our current bull run onto a more sustainable growth trend line. We could run up to retest the more bullish original trend for another 5 years or uncouple and comfortably follow the+10% annual growth trend midline for several years to come. Maybe the recession sentiment is too strong.


The Bitcoin Breakdown of the downtrend. A NEW BULLRUN?The BTC price have been in a downtrend since its peak, early November 2021 at a price high shy of $70,000 US Dollars.
Since, price had decreased 50% plus to a local bottom around $33,000 US Dollars, Late January 2022. Followed by a relief
rally with a peak around $48,000 US Dollars, Late March. For then continue its downtrend to the support area around
the $18,000 US Dollars (that just around the price peak of late 2017). Recently, this month the price made a break of the
downtrend channel form by this price peaks/bottoms since November 2021. This break can be observe around the price of $19,300 US Dollars.

USDCHF shorting soonBlue Mark is the lower time frame correction that needs to form first before entry so that's my style of entry. LTF continuational correction to take entry and ride the trend
Thanks for reading
AS ALWAYS TRADE SAFE AND STAY SAFE!

AUDUSD as expected HUGE UPSIDE MOVE!!!As expected price made a lovely rejection from the bottom of this consolidation zone and break out to the upside showing that we could be in for a longer term trend change. Ill be looking for price to make a pullback from the bullish move and look at catching the continuation leg to the upside. Wait for the best risk reward and follow market structure, price more then like always gives you a second chance to get into a trade so always stay patient!!

USDCAD eyeing the shorts from 1.38 still!Still waiting for price to provide the best entry on this possible sell off move I'm looking out for on USDCAD. Never forget the overall direction and trading against that can be risky and tricky but can pay off if you play it smart! Good luck everyone

chfjpy Hi traders.
On Thursday 22 of September, the Price actions violated rapidly the former support.
It has not been checked and my bias has shifted to bearish, 'cause I take into account as a supply area now.
The price action has been performing bullish impulse moves without significant correction.
With positive JPY news, this scenario can be validated even more.
Thank you for your support to the messages! I hope that I help.
Good luck!
NZD USD Analysis hello traders
We have a change in behavior, the price was in a downtrend and making lower high and lower low, and now making a higher high might start an uptrend reaching 0.56857

NZDJPY LONG The price has reached the levels of demand and there is a response, I expect the price to rise, targeting supply levels


Amazon monthly may need reworkingthe long term picture for amazon.com, and really the whole dotcom sector has looked bleak until recently. i would wait to cross above this pivot and trama to turn up before i thought we could continue recovering in technology. id aim for upper horizontals as we cross above levels and lower horizontals as we cross below.

daily trend change back to bear likely bounce seems imminenti think its obvious that the daily trend has changed back to bearish, and the levels ive marked out, upper if we atay over pivot and lower if we remain beneath, are key support and reaistance that remain. i think we ahould revisit TRAMA and SSS levels but not outgain the QQE short entry. fibo time zone 5 is over, and the correction b wave should play outover to 8. rising and falling trendlines are long term resistance and support.


