USDJPY - Counter Trend Trading & Trend Continuation TradingHi Traders!
The market is in an overall Downtrend.
We are going to start the Multiple Timeframe Analysis with the Weekly TF.
Then, we'll analyse the Daily, H4 and H1 Timeframes too.
Here is the screenshot of the Weekly Timeframe:
As you can see the main thing here is the falling Wedge.
The market is moving in between those two descending Trendlines.
Why is this Wedge so powerful?
Because the price respected this Wedge more than the monthly Support:
Here we can recognize the bearish Breakout of the Support in-between the Wedge.
After the Breakout it started a consolidation.
If we have a bearish Breakout of the Consolidation Box, we expect the Target of 101.000.
At this Level the market has moved up fastly the last two times.
Let's move on to the Daily TF:
This movement of the price can be devided into four pieces:
The price moved in the falling Wedge
The price moved in the descending Triangle
The price broke out of the weekly Support and formed a "neutrale" Triangle
(it is neither ascending nor descending)
The price moves in the consolidation box.
Now we have two possible scenarios that the price could take:
- Scenario 1:
The price jumpes off the Support and reaches the blue dotted line.
This line represents the Level of Breakout.
The idea is here to trade the Retracement Movement to make the Retest.
- Scenario 2:
It is also possible, that the market breaks out bearish.
Than the Target would be the Level 101.000.
It is important to trade here the Retest of the bearish Breakout to avoid a False Break.
Let's move on to the H4-TF:
Here, the price moves in a Parallel Channel.
We have two possible Trading Setups here:
The Counter Trend Trade
In this Setup, we buy the bullish Breakout of the Parallel Channel.
The reason is to profit from the Retracement Move.
The Trend Continuation Trade
When the market finally reaches this orange Area, we are going to wait for a Trend Reversal (Candlestick) Pattern.
Then we sell the price with the Trend towards the Bottom of the big main Consolidation Box.
Lastly the H1-Entry-Timeframe:
Here we explain the details for the Setup for the Counter Trend Trade.
As you can see the price is now in a Triangle.
So, we can have two Entries:
- Entry 1 is at the bullish Breakout of the H1-Triangle.
- Entry 2 is the bullish Breakout of the Parallel Channel.
The SL for Entry 1 is below the recent low.
The SL for Entry 2 is depending on how the price gets to make this Breakout and the SL could be below one of these potential higher Lows.
The Target is the Area around the blue dotted Breakout Level.
We recommend to trade with a small risk if you counter trend trade.
Thanks and successful Trading :)!
Trendcontinuation

OPTIONS PLAY OF THE YEAR ($SQ)No matter how you trade, this stock has been in Beast Mode all year long!!!

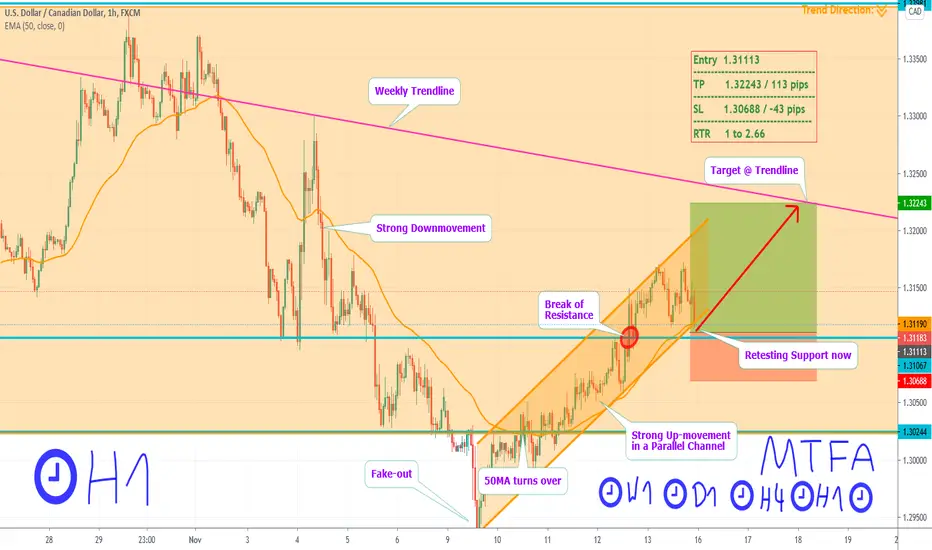
USDCAD - Wait/Trade the Pullback & Trade Trend-ContinuationHi Traders!
The market is in an overall Downtrend.
We'll start the Multiple Timeframe Analyis with the Weekly.
Here is it:
As you can see, we firstly had an Uptrend.
It made a Trending Move, then it consolidated in the wedge before moving higher.
After that, it came back all the way down to the Wedge Level.
Recently, it even broke this level too, which results a cancellation of the Up-Trend.
Let's move on to the Daily-TF:
Here you can see how the market broke the Level.
It moved in a descending Triangle, then it made lower Lows and eventually broke out.
Now we can consider the Weekly Trendline.
We should wait for the Pullback, because the pair often comes back to the Trendline.
In addition, by trading near this important structure, we can set our SL above the "safe" Weekly Trendline.
Let us move on further to the H4-TF:
After the bearish Breakout of the Structure Level, we can identify this important descending Parallel Channel.
We expect a Pullback to the Level 1.28500 or - in case of a Range - until the market reaches the Trendline.
You can either trade or wait for the Pullback, but this idea is
only on trading the Trend Continuation after the Pullback.
Lastly, here is the H1-Timeframe:
The most important thing is now to wait (when you want to trade the Continuation).
We have to observe the situation to evaluate the Price Action.
It is also possible, that the market moves down lower without a Pullback, but the likelihood isn't high.
We recommend to trade in the direction of the Trend.
Thanks and successful Trading :)!

EURGBP > Trend Continuation Setup, Waiting for Entry Reason!!Analysis of #EURGBP
Hello friends,
As you can see this a new uptrend for me with confirmation, so I will be looking for a trend continuation entry that meets my rules anywhere inside the previous swing.
I hope this idea earns your likes and comments, that will really support me to keep providing you valuable analysis
Really appreciate your support and feedback
Check today analysis below⠀
_____________________________________________________________________________⠀
-DISCLAIMER: This Information Is Not a Recommendation to Buy or Sell. It Is to Be Used for Educational Purposes Only⠀
-⚠ Please Note This Is Just a Prediction and I Have No Reason to Act on It and Neither Should You

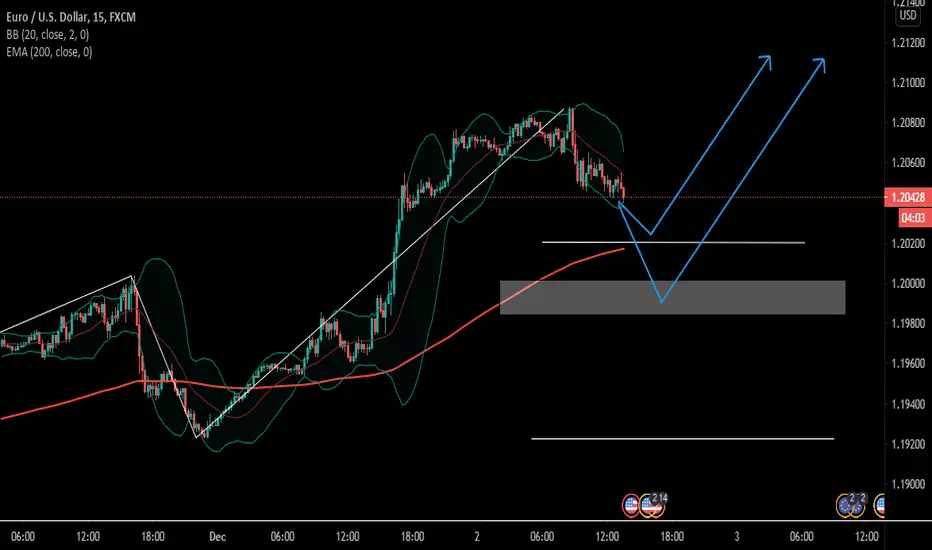
EURUSD - Bullish Continuation HigherSo we finally violated the 1.20 level on EURUSD which allows me to make a prediction that price is likely t go higher. IF we go higher then the next level that may prove to be resistance is from way back in 2018 & ranges from 1.22's to 1.25's Look for a period of relief before the next extension higher, so either a sideways tight consolidation or a retracement into previous structure resistance that may now act as support back at the 1.20 level.
As always feel free to leave me any questions or comments below & of course if you want to share your idea that is great as well as it will help members of this community learn about different ways to look at different charts.
Wishing you guys a great week! - Akil

Trade #4 / Tuesday, November 1, 2020 / 8:31PM / Sell ES Trade #4 / Tuesday, November 1, 2020 / 8:31PM / Sell ES
Overall trend is bearish on 5 minutes
Trend continuation trade
Market consolidated after push
1 - 2 risk and reward ratio
Target is right before key support level
Stop loss is 1.5 ATR above last consolidation high

GBPNZD - Bearish Continuation A few weeks ago we took a look at the EURNZD breaking a rather important level of structure, opening up a massive amount of opportunity to the downside. Now the GBPNZD is following along. With a minimal move down to 1.87's and a larger potential to 1.8350's this is certainly a par that will be on my radar from both a swing & intraday perspective as I look for opportunities to trade it lower.
If you have any questions or comments about this setup, please leave them below & I promise to respond. - Akil

Short on CRO/BTC continuedHaving broken free of the effective pullback we are now looking to continue the negative trend towards a bearish move overall. Stop marks may be previous structure looking left, where there may be some buying pressure, and going past that for extended targets really is deep lows.

Q4 UPDATE - XAUUSD Elliott Wave ForecastEvening all,
A quick update on Gold and the fourth wave is still in progress. As mentioned in the linked idea, I'm expecting the corrective sequence to continue into December and print a new quarterly low with the Horizontal support level at 1800-1765 providing some confluence.
I will be looking to take swing positions once this low is in as we are likely to get a sideways correctional C wave to a lesser degree before an impulse into the fifth.
Will provide further counts and price levels once we're into the final wave of this leg. You're most welcome to follow for further updates.
Happy trading,
Beyond Edge
Disclaimer
This is not trading advice. All content/ information shared in this idea is purely educational in nature and is expected to be used for analysis and illustration purposes only.
Do not trade or speculate based solely on the information provided. Trust your own analysis.
Beyond Edge

NaturalGas trend continuation to the upsideTECHNICALS: NaturalGas price will probably form complete three wave correction, after that, i will wait for clear break of trend, with flag over the trendline, only then i will get in, on breakout of flag, to catch next wave, ride trend until it is over.
There is also high probability that price will repeat the price action back from 2012, the price action from 2012 is on the chart in purple color.
FUNDAMENTALS: USD can still lose value in the long run due the Quantitative Easing, Low Interest Rates. Both of these factors could lead to Inflations of USD.
The idea is only my view of market and im not encouraging anyone to take that trade.

AUDJPY Trend Continuation PatternIf you like the content and are getting value out of it, please make sure to hit that like button and leave a comment. Also, if you're interested in seeing more of my analysis don't forget to follow me, and make sure to check out my profile/bio for more in-depth analysis.
Welcome back for some more chart analysis practice. I found another trend continuation pattern opportunity here on AUDJPY. Here as you can see, the market broke below the previous lows of 76.11 and is now retracing back into a 0.618 Fib retracement level, which gave me my entry @ 76.29. Since my entry got hit, I put my stop loss 10 pips above the most recent high @ 77.82, and my target @ 74.02.
Opinion: So far, I'm feeling very confident about this trade as it's currently moving in my favor. But, anything can happen in Forex trading, so we'll just have to wait and see what happens.
Ultimately guys, while trading can be very simplistic at times, it is genuinely a hard skill to master, and if you are serious about becoming a consistently profitable trader, then you need to master chart analysis. So, take it seriously, get out there and practice it every day.
Disclaimer: This is not a recommendation or an endorsement to buy, sell, or take any positions of any kind, in any market. This is for educational purposes only. I am not taking this trade in real life, and I have not back-tested this particular strategy on this currency pair, so I really don't know how this type of trading strategy will work on this currency pair. That being said, never trade anything you haven't back-tested on your own. Don't trade a strategy just because someone tells you it's a good strategy, always back-test the strategy in question over historical data before trading it with real money. Trading a strategy that has not been back-tested is the equivalence of gambling your money away, or trying to shoot a target when its pitch-black outside. You work hard for your money, so don't throw it away.

AUDUSD Trend Continuation PatternIf you like the content and are getting value out of it, please make sure to hit that like button and leave a comment. Also, if you're interested in seeing more of my analysis don't forget to follow me, and make sure to check out my profile/bio for more in-depth analysis.
Welcome back for some more chart analysis practice. I found another trend continuation pattern opportunity here on AUDUSD. Here as you can see, the market broke below the previous lows of .7192 and is now retracing back into a 0.618 Fib retracement level, which gave me my entry @ .7215. Since my entry got hit, I put my stop loss 10 pips above the most recent high @ .7355, and my target @ .7011.
Opinion: So far, I'm feeling very confident about this trade as it's currently moving in my favor. But, anything can happen in Forex trading, so we'll just have to wait and see what happens.
Ultimately guys, while trading can be very simplistic at times, it is genuinely a hard skill to master, and if you are serious about becoming a consistently profitable trader, then you need to master chart analysis. So, take it seriously, get out there and practice it every day.
Disclaimer: This is not a recommendation or an endorsement to buy, sell, or take any positions of any kind, in any market. This is for educational purposes only. I am not taking this trade in real life, and I have not back-tested this particular strategy on this currency pair, so I really don't know how this type of trading strategy will work on this currency pair. That being said, never trade anything you haven't back-tested on your own. Don't trade a strategy just because someone tells you it's a good strategy, always back-test the strategy in question over historical data before trading it with real money. Trading a strategy t

EURUSD Trend Continuation PatternIf you like the content and are getting value out of it, please make sure to hit that like button and leave a comment. Also, if you're interested in seeing more of my analysis don't forget to follow me, and make sure to check out my profile/bio for more in-depth analysis.
Welcome back for some more chart analysis practice. I found another trend continuation pattern opportunity here on EURUSD. Here as you can see, the market broke below the previous lows of 1.1737 and is now retracing back into a 0.618 Fib retracement level, which gave me my entry @ 1.1772. Since my entry got hit, I put my stop loss 10 pips above the most recent high @ 1.1881, and my target @ 1.1616.
Opinion: So far, I'm not feeling to comfortable about this trade as the market has already broke above and closed above my entry, and is currently looking like it's going to stop me out. But, anything can happen in Forex trading, so we'll just have to wait and see what happens.
Ultimately guys, while trading can be very simplistic at times, it is genuinely a hard skill to master, and if you are serious about becoming a consistently profitable trader, then you need to master chart analysis. So, take it seriously, get out there and practice it every day.
Disclaimer: This is not a recommendation or an endorsement to buy, sell, or take any positions of any kind, in any market. This is for educational purposes only. I am not taking this trade in real life, and I have not back-tested this particular strategy on this currency pair, so I really don't know how this type of trading strategy will work on this currency pair. That being said, never trade anything you haven't back-tested on your own. Don't trade a strategy just because someone tells you it's a good strategy, always back-test the strategy in question over historical data before trading it with real money. Trading a strategy that has not been back-tested is the equivalence of gambling your money away, or trying to shoot a target when its pitch-black outside. You work hard for your money, so don't throw it away.

GBPCHF Trend Continuation PatternIf you like the content and are getting value out of it, please make sure to hit that like button and leave a comment. Also, if you're interested in seeing more of my analysis don't forget to follow me, and make sure to check out my profile/bio for more in-depth analysis.
Welcome back for some more chart analysis practice. I found another trend continuation pattern opportunity here on GBPCHF. Here as you can see, the market broke above the previous highs of 1.1833 and is now retracing back into a 0.618 Fib retracement level, which gave me my entry @ 1.1775. Since my entry got hit, I put my stop loss 10 pips below the most recent low @ 1.1644, and my target @ 1.1952.
Opinion: So far, I'm not really sure how I feel about this trade as it's consolidating around my entry. I also decided to measure my Fib retracement tool from a minor structure level. So, we'll just have to wait and see what happens.
Ultimately guys, while trading can be very simplistic at times, it is genuinely a hard skill to master, and if you are serious about becoming a consistently profitable trader, then you need to master chart analysis. So, take it seriously, get out there and practice it every day.
Disclaimer: This is not a recommendation or an endorsement to buy, sell, or take any positions of any kind, in any market. This is for educational purposes only. I am not taking this trade in real life, and I have not back-tested this particular strategy on this currency pair, so I really don't know how this type of trading strategy will work on this currency pair. That being said, never trade anything you haven't back-tested on your own. Don't trade a strategy just because someone tells you it's a good strategy, always back-test the strategy in question over historical data before trading it with real money. Trading a strategy that has not been back-tested is the equivalence of gambling your money away, or trying to shoot a target when its pitch-black outside. You work hard for your money, so don't throw it away.

NZDJPY Trend Continuation PatternIf you like the content and are getting value out of it, please make sure to hit that like button and leave a comment. Also, if you're interested in seeing more of my analysis don't forget to follow me, and make sure to check out my profile/bio for more in-depth analysis.
Welcome back for some more chart analysis practice. I found another trend continuation pattern opportunity here on NZDJPY. Here as you can see, the market broke below the previous lows of 69.86 and is now retracing back into a 0.618 Fib retracement level, which gave me my entry @ 70.23. Since my entry got hit, I put my stop loss 10 pips above the most recent high @ 71.31, and my target @ 68.67.
Opinion: So far, I'm not really sure how I feel about this trade as it's consolidating around my entry. I also decided to measure my Fib retracement tool from a minor structure level. So, we'll just have to wait and see what happens.
Ultimately guys, while trading can be very simplistic at times, it is genuinely a hard skill to master, and if you are serious about becoming a consistently profitable trader, then you need to master chart analysis. So, take it seriously, get out there and practice it every day.
Disclaimer: This is not a recommendation or an endorsement to buy, sell, or take any positions of any kind, in any market. This is for educational purposes only. I am not taking this trade in real life, and I have not back-tested this particular strategy on this currency pair, so I really don't know how this type of trading strategy will work on this currency pair. That being said, never trade anything you haven't back-tested on your own. Don't trade a strategy just because someone tells you it's a good strategy, always back-test the strategy in question over historical data before trading it with real money. Trading a strategy that has not been back-tested is the equivalence of gambling your money away, or trying to shoot a target when its pitch-black outside. You work hard for your money, so don't throw it away.

NZDUSD Trend Continuation PatternIf you like the content and are getting value out of it, please make sure to hit that like button and leave a comment. Also, if you're interested in seeing more of my analysis don't forget to follow me, and make sure to check out my profile/bio for more in-depth analysis.
Welcome back for some more chart analysis practice. I found another trend continuation pattern opportunity here on NZDUSD. Here as you can see, the market broke below the previous lows of .6601 and is now retracing back into a 0.618 Fib retracement level, which gave me my entry @ .6688. Since my entry got hit, I put my stop loss 10 pips above the most recent high @ .6807, and my target @ .6516.
Opinion: This trade looks like a typical trend continuation pattern to me. In the end, we'll just have to wait and see what happens.
Ultimately guys, while trading can be very simplistic at times, it is genuinely a hard skill to master, and if you are serious about becoming a consistently profitable trader, then you need to master chart analysis. So, take it seriously, get out there and practice it every day.
Disclaimer: This is not a recommendation or an endorsement to buy, sell, or take any positions of any kind, in any market. This is for educational purposes only. I am not taking this trade in real life, and I have not back-tested this particular strategy on this currency pair, so I really don't know how this type of trading strategy will work on this currency pair. That being said, never trade anything you haven't back-tested on your own. Don't trade a strategy just because someone tells you it's a good strategy, always back-test the strategy in question over historical data before trading it with real money. Trading a strategy that has not been back-tested is the equivalence of gambling your money away, or trying to shoot a target when its pitch-black outside. You work hard for your money, so don't throw it away.

USDJPY Trend Continuation PatternIf you like the content and are getting value out of it, please make sure to hit that like button and leave a comment. Also, if you're interested in seeing more of my analysis don't forget to follow me, and make sure to check out my profile/bio for more in-depth analysis.
Welcome back for some more chart analysis practice. I found another trend continuation pattern opportunity here on USDJPY. Here as you can see, the market broke below the previous lows of 105.10 and is now retracing back into a 0.618 Fib retracement level, which gave me my entry @ 105.89. Since my entry got hit, I put my stop loss 10 pips above the most recent high @ 107.15, and my target @ 104.04.
Opinion: So far, I'm feeling pretty confident about this trade as it's currently moving in my favor. But, a double bottom on the daily chart has occurred, which is a bullish trend reversal signal. So we'll just have to wait and see what happens.
Ultimately guys, while trading can be very simplistic at times, it is genuinely a hard skill to master, and if you are serious about becoming a consistently profitable trader, then you need to master chart analysis. So, take it seriously, get out there and practice it every day.
Disclaimer: This is not a recommendation or an endorsement to buy, sell, or take any positions of any kind, in any market. This is for educational purposes only. I am not taking this trade in real life, and I have not back-tested this particular strategy on this currency pair, so I really don't know how this type of trading strategy will work on this currency pair. That being said, never trade anything you haven't back-tested on your own. Don't trade a strategy just because someone tells you it's a good strategy, always back-test the strategy in question over historical data before trading it with real money. Trading a strategy that has not been back-tested is the equivalence of gambling your money away, or trying to shoot a target when its pitch-black outside. You work hard for your money, so don't throw it away.

USDCAD - Trading towards the Trendline - Pullback EntryHi Traders!
Here are the screenshots for the Multiple Timeframe Analysis.
If you want to know more about any methode, thought process or anything else, please ask in the comments.
The timeframes we analysed are:
Weekly Timeframe - Daily Timeframe - 4 Hour Timeframe - 1 Hour Timeframe
Weekly Timeframe:
Daily Timeframe:
H4-Timeframe:
H1-Timeframe (Entry):
We recommend to trade with a candlestick pattern confirmation.
Thanks and successful Trading :)!
DAX-DE30 video top-down AnalysisHello everyone, here is the top-down analysis for DAX, feel free to request any pair/instrument or ask any questions in the comment section below.
Best of luck!

USDJPY - Potential Head & Shoulders Pattern - Trend ContinuationHi Traders!
The market is in an overall Downtrend.
Alright, let's begin the multiple timeframe analysis with the weekly chart:
The main thing we can see here is the descending Triangle.
This structure has two main factors:
The descending Trendline
The weekly Support
Now we analyse the price action of the market.
You see, the market is reacting less and less to the weekly Support than it did the times before.
This is a sign of Bullish Weakness or Weakness of Support.
That means that we're looking to short the market.
Now, here is the daily:
Here you can see another descending Trendline.
This is giving some more bearish pressure.
And it is in a Downtrend.
Moving on to the H4:
You can see the market retracing.
It is also at a consolidation area.
We identified a possible Head & Shoulders Pattern.
The target is the weekly Support.
Now, let's think about how to enter.
The Entry Timeframe H1:
As you can see there is a little ascending Trendline there.
It could serve as our Entry.
So, if the market doesn't make the Left Shoulder, we won't miss the trade:
We'll just sell the Trendline Break.
The SL is above the Consolidation Area and the TP at Weekly Support.
The risk-to-reward ratio is better than 1 to 3 !
We recommend to trade the Retest of the Trendline Break.
Thanks and successful Trading :)!

GBPUSD Trend Continuation PatternIf you like the content and are getting value out of it, please make sure to hit that like button and leave a comment. Also, if you're interested in seeing more of my analysis don't forget to follow me, and make sure to check out my profile/bio for more in-depth analysis.
Welcome back for some more chart analysis practice. I found another trend continuation pattern opportunity here on GBPUSD. Here as you can see, the market broke below the previous lows of 1.2761 and is now retracing back into a 0.618 Fib retracement level, which gave me my entry @ 1.2881. Since my entry got hit, I put my stop loss 10 pips above the most recent high @ 1.3017, and my target @ 1.2697.
Opinion: So far, I'm not feeling to confident about this trade as it is currently moving against me. The market has already broken above and closed above my entry. But, anything can happen in Forex trading, so we'll just have to wait and see what happens.
Ultimately guys, while trading can be very simplistic at times, it is genuinely a hard skill to master, and if you are serious about becoming a consistently profitable trader, then you need to master chart analysis. So, take it seriously, get out there and practice it every day.
Disclaimer: This is not a recommendation or an endorsement to buy, sell, or take any positions of any kind, in any market. This is for educational purposes only. I am not taking this trade in real life, and I have not back-tested this particular strategy on this currency pair, so I really don't know how this type of trading strategy will work on this currency pair. That being said, never trade anything you haven't back-tested on your own. Don't trade a strategy just because someone tells you it's a good strategy, always back-test the strategy in question over historical data before trading it with real money. Trading a strategy that has not been back-tested is the equivalence of gambling your money away, or trying to shoot a target when its pitch-black outside. You work hard for your money, so don't throw it away.

GBPJPY Trend Continuation PatternIf you like the content and are getting value out of it, please make sure to hit that like button and leave a comment. Also, if you're interested in seeing more of my analysis don't forget to follow me, and make sure to check out my profile/bio for more in-depth analysis.
Welcome back for some more chart analysis practice. I found another trend continuation pattern opportunity here on GBPJPY. Here as you can see, the market broke below the previous lows of 134.57 and is now retracing back into a 0.618 Fib retracement level, which gave me my entry @ 135.23. Since my entry got hit, I put my stop loss 10 pips above the most recent high @ 136.68, and my target @ 133.28.
Opinion: So far, I'm not feeling to comfortable about this trade as the market has already broke above and closed above my entry, and is currently looking like it's going to stop me out. But, anything can happen in Forex trading, so we'll just have to wait and see what happens.
Ultimately guys, while trading can be very simplistic at times, it is genuinely a hard skill to master, and if you are serious about becoming a consistently profitable trader, then you need to master chart analysis. So, take it seriously, get out there and practice it every day.
Disclaimer: This is not a recommendation or an endorsement to buy, sell, or take any positions of any kind, in any market. This is for educational purposes only. I am not taking this trade in real life, and I have not back-tested this particular strategy on this currency pair, so I really don't know how this type of trading strategy will work on this currency pair. That being said, never trade anything you haven't back-tested on your own. Don't trade a strategy just because someone tells you it's a good strategy, always back-test the strategy in question over historical data before trading it with real money. Trading a strategy that has not been back-tested is the equivalence of gambling your money away, or trying to shoot a target when its pitch-black outside. You work hard for your money, so don't throw it away.
