GBP/USD Long Opportunity 15 Minute Timeframe Trend ContinuationI will be looking for long opportunities around this area stated in my analysis. I won't be going into to much detail as to why. I would wait for a break of the consolidation zone before looking to take the trade.
Trendcontinuation

BEARISH CADJPY CYPHER PATTERN COMPLETION AT STRUCTUREThere is a potential cypher pattern completion at structure.
Not just that there is a 200 EMA confluence, monthly candle open price and monthly pivot point.
So look at all the elements of confluence we have at that location:
1. Daily Structure Level
2. cypher pattern completing at structure.
3. 200 EMA confluence at cypher completion.
4. Monthly pivot confluence at structure
5. monthly candle open price at structure.
Please note that this is not trading advice, follow your trade plan.
Cheers!

EURAUD - RETURNING TO A DECISION POINT Pair number 4 from this weeks trading video was the EURAUD. This pair has been GOLDEN over the past few weeks and well, we'll see if it has anything else to give. So we've almost completed the move that we predicted last week & as week make our way to previous structure lows the market will be at another "decision point."
When I use the term "Decision Point" I'm referring to a point in the market where we can't really make a present moment prediction, rather we need to wait until the market gives us a clue on what it's likely to do next. So IF price does this, THEN we look for that (and vice versa).
My preferred direction here would be another break to the downside, so what I hope we see is a violation of our previous level of structure support. IF that were to occur THEN I'll be looking for new shorts all the way to the 1.6300's level where we have a 127 Fibonacci extension & previous structure looking left.
For the video walkthrough of this setup please see my youtube video title "A Lesson on Structural Integrity" around the 24:40 mark
I hope you have a great trading week!
Stay Safe!
Your Trading Coach - Akil

AUDUSD - BEARISH BAT WITH DOUBLE TOP COMPLETION The 3rd pair we reviewed in this weekend's video was the AUDUSD. Last week's long (pullback trade) worked out pretty well for me. However, before getting to targets the market decided to make things a little interesting with some up & down bounces. These bounces set up a new selling opportunity now which available in the form of a bearish bat pattern. And to add even more confirmation to the idea, the market has decided to put in a double top.
Now as I mentioned earlier I'm still long from last week, so I won't be able to partake as my rules are "stick with your original trade" if you watch the video version of this idea, situations like this offer a cool opportunity to use a technique called a "Stop & Reverse" (SAR)
For the video walkthrough of this setup please see my youtube video title "A Lesson on Structural Integrity" around the 14:10 mark
I hope you have a great trading week!
Stay Safe!
Your Trading Coach - Akil

GBPJPY - BEARISH BAT PATTERN WITH CONTINUATION POTENTIALThe 2nd pair we visited in this weekend's video was the GBPJPY. On the higher timeframe we have recently violated a previous level of structure support which gives me a bearish bias. We also have a potential bearish bat pattern forming to add some confluence to that idea.
Most of the time advanced pattern formations form within a period of consolidation, but every once in a while you'll see one like this which comes withing a complex pullback of an overall trending market. In these types of situations, not only does it add confluence to your idea, but it also offers the opportunity to be more aggressive with your target(s).
For the video walkthrough of this setup please see my youtube video title "A Lesson on Structural Integrity" around the 5:50 mark
I hope you have a great trading week!
Stay Safe!
Your Trading Coach - Akil

EURJPY - PULLBACK TRADE TO RETEST PREVIOUS LOWSThe 1st pair that week looked at in this week's video was the EURJPY. From a longer-term perspective, I haven't had too much interest in this pair all year. However, from an intraday view it has given us a lot of good advanced pattern formations during the consolidation.
Recently this pair broke out to the downside & ended it's run by violating a previous level of structure support on the Daily/Weekly causing me to make a prediction for a bearish continuation trade. With that being said (look left structure leaves clues) there's another previous level of consolidation lurking so I'm not to sold on an extension.
With that being said what I'm looking for is a conservative way to involve myself in a pullback trade (looking for shorts) and looking to get initial targets off at a retest of our recent lows just incase this turns out to be a double bottom hold & not a continuation of the recent downward trend.
For the video walkthrough of this setup please see my youtube video title "A Lesson on Structural Integrity" around the 1:40 mark
I hope you have a great trading week!
Stay Safe!
Your Trading Coach - Akil

EURJPY SELL SET UPeurjpy has reached our sell level …… im watching for rejections and other signs of a continued downtrend.
TP1 : 114.51
TP2 : open

CADCHF Trend ContinuationSpeculating Price Action, patiently waiting for Entry when price makes its way to re-test its Ascending Trend Line. (Careful CandleStick Reading Req.)


AUDNZD long term bearish trend continuationAudnzd made a strong push up and is at the resistance line of the bearish channel... watch for signs of a reversal.
Tp 1 : 1.06724
Tp 2 : 1.05334
Tp 3 : 1.03802


EURCAD Bearish Trend ContinuationPrice is at a very interesting area that could go one of both ways. EURCAD is sitting at previous Support which can signal us that a Bull Run is coming or Price is bouncing off Support in order to have a Proper Exhaustion therefore allowing the 2nd Wave of Bears to come in and break below that local Support allowing price to produce some new historic data.

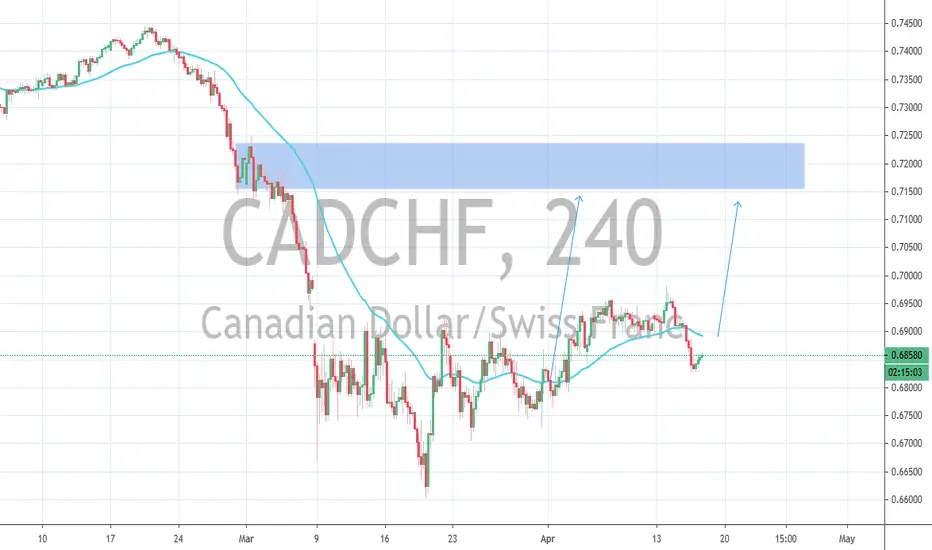
CADCHF Bullish Set-Up Looking for a Trend Continuation Trade Entrance, using multi time-frame data. Looks to me that if we find a great entry then we can hold onto our position incase price action breaks above resistance giving us the ultimate trade in this pair.

AUDUSD: Trend is your friendAfter strong rebound from pandemic-induced drop AUDUSD will resume downtrend.
It could still go higher, but I believe it will at least reach 0.6 again, before we can talk about long-term trend reversal.

EURUSD - From one Level to another - Swing TradeHi Traders!
The market is in a downtrend!
As you can see there are is coming a Trendline from above.
It is a descending Trendline which is also a Resistance.
Furthermore, the market is no in a consolidation.
This consolidation occured after the breako of the Support-Trendline.
Because of:
- The descending Trendline
- The pressure of the 200MA
- The recent momentum (see at the last tree candles)
we recommend to trade the breakout downwards.
Thanks and successful Trading :)!

AUDUSD - Repetitive Pattern? - EASY Market StructureHi Traders!
The market is clearly in an uptrend.
It is making higher highs and higher lows (see arrows).
So, the first trending move was until the orange Resistance area at around 0.62000.
After that, it retraced back.
This Retracement Move was in a parallel channel.
Then the market broke the channel and the Resistance too.
The second Trending Move was until the Resistance at 0.64500.
After that the market was making a Retracement Move.
Now the market is also testing the broken Resistance - which is now a Support.
We recommend to trade the Breakout for a Trend Continuation!
Thanks and successful Trading :)!

USDCAD - After Breakout - Don't miss the Up-Movement!Hi Traders!
The market is - according to the 200MA - in an uptrend.
As you can see the market was moving under the trendline.
At one point, the market had very low volatility.
So, it combined the energy and broke out of the trendline.
Now it is retesting it and is again in a consolidation.
Because of the Breakout and the support of the 200MA, we expect that the market will move further.
We recommend to wait for a retest!
Thanks and successful Trading :)!

CADCHF Bulls UpdateLong biased has not been invalidated, a buy is very much on the cards. The target will defintely be reached.
EURUSD - Next Swing Trade - Multiple Buy Point
Hi Traders!
If you look at the H4 Timeframe you can see that
the market is neither in an uptrend or in a downtrend.
Why? The market either need higher highs & lows or lower highs & lows to make a trend.
And what do we see?
What you can see is higher lows and lower highs and a Support-Trendline (on H4).
However, in the H1 Timeframe you can see a tiny uptrend.
The market is movin in a parallel channel.
Furthermore, it starts to respect the 200EMA.
We recommend to buy at the Buy Point, for a low-risk trade and a good target.
So, the entry triggers are:
- strong H4 Trendline
- bottom of the Parallel Channel
- 200 Exponential Moving Average
- tiny Uptrend
Thanks and successful Trading :)!

AUDUSD - Waiting for Pullback - TREND-CONTINUATION TradeHi Traders!
As you can see the market is in an uptrend.
The market started rallying since it was at 0.55000.
After that the market went up.
But, why is it in an uptrend?
Actually, the market was not in an uptrend until it broke the resistance at 0.62000.
Until than, the picture was like that:
- Overall market in a downtrend,
- market now consolidating,
- waiting for trend continuation.
But then the market broke this level, so the picture is now:
- Market in a fresh uptrend,
- just broke the level,
- waiting for a retest,
- making profits in trend continuation.
We recommend to buy the successful retest of the breakout!
Thanks and good luck :)!


Who like Rainbows & Trends?Simple Strategy utilizing 3 Simple MA Channels
Simple Moving Average Channel Settings
------------------------------------------------------------------------
First Channel: |
70, High | Colors:
70, Close | Green w/Red Borders for Up and Red w/ Green Borders for Down
70, Low |
------------------------------------------------------------------------
First Channel: |
233, High | Colors:
233, Close | Orange w/ Blue Borders for Up and Blue w/ Orange Borders for Down
233, Low |
------------------------------------------------------------------------
First Channel: |
610, High | Colors:
610, Close | Magenta w/ Yellow Borders for Up and Yellow w/ Magenta Borders for Down
610, Low |
------------------------------------------------------------------------
Momentum Settings
ThreshHold is Set to level 0.0
Up Trend ThreshHold is set to 0.00100
Down Trend ThreshHold is set to -0.00100
------------------------------------------------------------------------
First Mementum: |
34, Close | Colors:
| Green when >= Threshold 0.00100 & Red when < Threshhold 0.00100
------------------------------------------------------------------------
First Mementum: |
233, Close | Colors:
| Orange when >= Threshold 0.00100 & Blue when < Threshhold 0.00100
------------------------------------------------------------------------
First Mementum: |
610, Close | Colors:
| Magenta when >= Threshold 0.00100 & Yellow when < Threshhold 0.00100
------------------------------------------------------------------------
We use the MAs to determine when we are reversing.
We use the Momentum(s) to determine when we are consolidating on what time frame and to confirm moves.
Use at your own discression, but I myself get over 100 pips most days from this strat.
If you need the Code for these custom Indicators, let me know and I'd be happy to help.

NZDUSD 1HR Ascending Channel ReversalHi Traders,
Today I am looking at NZDUSD on the 1HR TF as we have recently seen prices rally but we are beginning to see buying pressure lose momentum as price action moves within a ascending channel and respecting .610's even handle (Structure resistance). I believe we may see prices decline into the highlighted areas of structure following this slow down in bullish momentum. If we do see a retracement lower then I will be looking for entry reasons to buy the market on the pullback in anticipation for a longer term bullish trend continuation move for a retest back up at .610's.
