Bears vs. Bulls - ConsolidatingSimple Triple 70 MA with Momentum and ADX
Bears and Bulls are struggling for the lead as we're seeing consolidation in EUR/USD.
Be sure to check your work on this one as we could see a possible reversal in the near future. However, for now, make sure if you've taken a Long position earlier today to stay in and don't fall for consolidation until you have confirmation from multiple sources.
We could see a reversal and go down OR we could see another upward impulse move giving you more profit.
Be sure tho, to mark your Stop Losses to maximize your profits.
Want to know more about the strategy? See the Linked Post
Trendcontinuation

Reversal or Continuation? Thoughts?Simple strategy using:
Simple Moving Average: 70, High
Simple Moving Average: 70, Low
Simple Moving Average: 70, Close
Momentum: 34, Close
ADX w/ +DM & -DM: 14, Threshold 20
We use the Simple Moving Averages channel to determine if we have a Long or Short Signal.
The Momentum indicator is used as a confirmation indicator to confirm if we have a trend starting
We use the ADX indicator with both Positive and Negative Movement to determine both the Direction and the Strength of said trend. We also use it to confirm if the pair is Consolidating or not.
Here are the Rules:
Long entry: Closing Price must cross above High MA AND Momentum must be above 100% level
You can also use the ADX to determine the strength of the trend and when you should be pulling your trades out.
Long Exit: You should be pulling out if you see consolidation or whenever you feel confortable. This is mainly a personal preference. I personally prefer pulling out after about 50 pips and I'm seeing a lot of consolidation.
Short Entry: Closing Price Must be Crossing under the Low MA AND Momentum must be falling below 100% level
Short Exit: Refer to Long Exit.
If you have any questions, comments or ideas on improvements, feel free to leave a comment or send me a PM.

EURUSD - After Breakout - Trade the Trend Continuation!Hi Traders!
The market is in a downtrend.
As you can see the market was respecting the trendline.
After that the market was in a very tight consolidation around 1.08000.
So, some candles after that, the energy "exploded" and the trendline broke.
In this moment it is too early to sell, because there is still much bullish power in it.
But after a second movement like this (potential mini Flag Pattern) , the sellers have a better chances.
The "waiting area" is around 1.09400 and before that we won't sell.
We recommend to wait for a candlestick pattern!
Thanks and good luck :)!

GBPJPY - Trend Continuation - EASY Trade SetupHi Traders!
As you can see the market is in a downtrend.
The market made a big bearish trending move.
It started around 145.000 and has fallen to the area of 124.000.
During this session the market respected the 20MA.
After that the retracement move started.
The market has risen until the resistance area at 134.000.
Now the market is consolidating in a tight range.
It is moving around the 20MA.
This is a good setup for many traders, because the more "tight" a market moves, the more "explosive" are the Breakouts.
That's why we recommend to take the trade during high momentum.
BONUS SETUP : There are also chances that the market makes a trend change.
If the market is going to do so, it'll have the break the consolidation area to the upside.
So, if the market has enough momentum we'll buy the breakout upwards ;)!
Thanks and good luck :)!

GBPAUD LONGI've posted an analysis for this pairing a week or so back and it has played out exactly as i've predicted. Now I am looking for a long setup from my trendline to the most recent high. My expectation after this is for price to conclude a double top and for us to short the pairing but for now this is what I have. For any further questions kindly contact me on Instagram @avesworld2715
Happy trading!

EU TO 1.20 ? (UPDATE)I think this chart was worth a post of its own post, so I decided to share it again.
In the previous post on this pair I still had the descending channel highlighting the bearish market on the chart. The retracement has been greater than 50% of the previous swing so I think it is about time to check for bullish signs.
We are looking at a bullish market shown by highlighting an ascending channel. We have an ab=cd pattern, with structure and completion point showing confluence with 38.2% and 61.8% fib levels creating a cluster. Price starting to form a potential double bottom at the support.
Assuming 1.09 holds EU could potentially be heading towards 1.2 or even higher.
Good luck to all trading EUR/USD these days!!

EURUSD - Waiting for BREAK of Parallel ChannelHi Traders!
The market is in a downtrend.
As you can see it is now retracing in a parallel channel.
The market is going towards the resistance.
We'll wait until the market touches it.
For moving down lower the market should break the channel.
When the channel breaks, we will sell.
The first Take Profit is at the first (weak) support.
The secound Take Profit is at the secound (strong) support.
We recommend to trade during high momentum.
Thanks and good luck :)!

USDJPY TREND CONTINUATION Please support this idea with a LIKE if you find it useful.
here is the analysis for USDJPY
prices moved nicely since my previous analysis, you can see link below this idea, no am looking for price to retrace to 109.00 psychological number were we see aalso support zone and fib 127 extentsion
If you like our idea and want to see more press the like button, share it, and do not forget to let us know your opinion below the post
Disclaimer: This information is not a recommendation to buy or sell. It is to be used for educational purposes only**

NZDUSD SHORT - Trend Continuation Hello Bunny's, here is my analysis for NZDUSD. Let me know in the comment section if you guys have any questions.
If you like my analysis please hit like. Thanks.

Trend continuationStiamo assistendo a una situazione estremamente complessa. Le misure messe a disposizione dalla FED ( abbassamento tassi a 0-0.25 e stanziamento di 700mld) non sembrano rassicurare il mercato, spaventando dal covid19. Infatti il timore che presto si sviluppi negli USA come avvenuto già in Europa, spingerà il prezzo giù, con una forza mai vista prima.
Proteggete i vostri capitali e sfruttate l'occasione con le Opzioni, strumento perfetto per questi momenti di grande volatilità.
Il peggio deve ancora venire e ci tritroveremo presto in una recessione mondiale, che potrebbe durare tutto l'anno.
Mi aspetto un rimbalzo sulla soglia psicologia dei 2000 dollari.
Attenzione quindi e buon trading!

USDCAD - PERFECT Bullish Flag - Trend ContinuationHi Traders!
The market is in a healthy uptrend.
As you can see, the market has risen strongly.
It is making big trend moves and then some midterm retracement moves.
Now the market is in a retracement move.
It is at a resistance, but higher lows are coming in.
That means that the traders are ready to buy the market.
This creates an ascending triangle.
If we put all these information together, we can see that the market has formed a bullish flag.
So, because of the higher lows we can have a smaller Stop Loss and a greater risk-to-reward ratio.
Out target is at the same height as from the last swing.
We recommend to buy the breakout with a small SL and a RTR of 1 to 4.
Thanks and good luck :)!

Divis lab - Bull trend continue? Divis Labs
Price moves above 2175 with OPEN=LOW candle which is sure sign of bullish ,Price may come back for retesting trend line before big move which will go 2240,2320 and 2360.
If price unable to sustain above the 2160 base price level it may fall back to 2120 and 2060 levels .
Please wait for the price action and trade accordingly .
This video is for educational purpose only.

GBPUSD - Market in a downtrend - Resistance & Resistance ChannelHi Traders!
The market is in a downtrend.
As you can see the market is respecting a "Resistance Channel".
Everytime it gets inside this area, it falls back again.
After the market was very down, it moved up again towards this area.
We expect the market to move down further.
In addition, the Stochastic is overbought too.
We recommend to sell this market with a risk-to-reward ratio of 1 to 3!
Thanks and good luck :)!

EURUSD - Easy Pullback & Trend Continuation SetupHi Traders!
The market is in a strong uptrend.
As you can see, the market is in a healthy uptrend since 20th February.
From then (price was around 1.08000) the market started moving up.
After that the market made a retracement move.
It retraced from the first pik (1.11800) towards the support (1.11000).
Then the market moved up again and made the next higher high (1.12000).
The market even did a so called "Golden Cross" and this could be an important signal for many traders.
Now it is back on the support again.
We recommend to buy the market because of the strong uptrend.
Thanks and good luck :)!

USDJPY - Market is in an UPTREND - Buying the supportHi Traders!
The market is in an uptrend.
As you can see, the market has formed a trendline (purple) in the higher timeframes.
It consists of the higher lows the market made and it shows that the market is very bullish.
Some weeks before, the market was not able to break the resistance.
But finally it got momentum and broke out successfully.
After that it performed a higher high.
Now the market falled back and is now retesting the resistance - now its a support - from above.
Because of the fact, that the market is in an uptrend and on a support simultaneously, it has more chances to move further up.
We recommend to buy the market in accord with the trend!
Thanks and good luck :)!

USDCHF - Trading Idea for Trend ContinuationHi Traders!
The market is in an uptrend.
As you can see it started in the beginning of February and moved around 216 pips until now.
Now it is in a channel and in a retracement move simultaneously.
If we use the Fibonacci Retracement tool we detect that the market reached the 38.2% of Fibonacci.
In addition this area is a support too.
The target is at the top of the movement at around 0.98500.
We recommend to buy the breakout of the channel!
Thanks and good luck :)!

EURUSD - TREND CONTINUATION after Fibonacci RetracementHi Traders!
As you can see the market is clearly in a downtrend.
Now the market is moving in a retracement move.
There are two possibilities for us to trade a trend continuation:
First Possibility:
- The market is moving towards the 38.2% Fibonaaci Retracement.
Then it is wobbling around a bit and subsequently it moves down.
Risk-to-reward ratio 1 to 3.08
Second Possibility:
- The market breaks the 38.2% Fibonacci Retracement and moves up until the
significant 61.8% Fibonacci Retracement. Then it moves down.
Risk-to-reward ratio 1 to 5.54
We recommend to wait for a confirmation (like candle stick patterns).
Thanks and good luck :)!

NZDUSD Long Trend Continuation
I tried to trade a long trend continuation on this on a shorter time period and was stopped out. I noticed that it was setting up again similarly on a longer time period so I traded it again the same way. This was also stopped out.

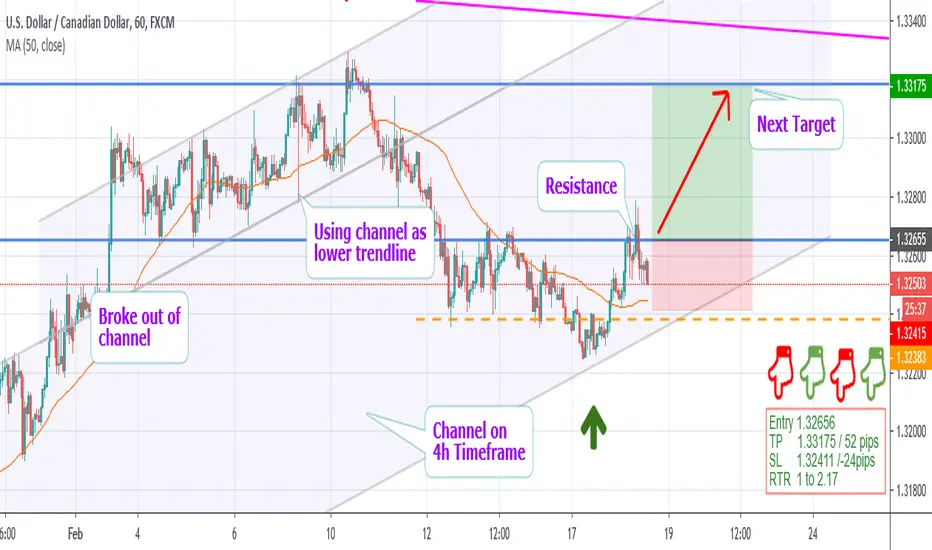
USDCAD - If there is a breakout, than a Trend-Continuation too!Hi Traders!
The market is in an uptrend.
As you can see it is moving inside a channel.
The market was moving up and down in the channel,
but then it broke out upwards and was using the upper channel line as
a lower trendline.
A certain time later, the market broke in again and is now at the lower line
of the channel.
The next Resistance is the blue line at 1.32644.
The market has good chances to break this level, because it is in a retracement move of an uptrend.
If the market breaks out of the upper trendline, it has good chances to move up until the next trendline.
We recommend to buy the market if it breaks the Resistance.
Thanks and good luck :)!
PS : How did you like the information panel at the bottom right?
Leave a comment!
USDJPY - BULLISH POWER just about to comeHi Traders!
As you can see, the market in an uptrend.
It makes over all higher highs and higher lows.
In addition, the market formed an upper and a lower trendline.
It is also respecting / moving higher than the 200MA.
Now the market got stuck around the important key level 110.000 .
The market tried to retrace lower tree times, but every time it failed.
That shows that the bulls are as strong as the bears.
Normally, the bears are stronger in these situations - and that's a retracement move.
If you put these information together, it shows that the bulls are now stronger than they usually are
and that's a tipical sign for a breakout.
We recommend to buy the market if it breaks the key level 110.000.
Thanks and good luck :)!


CHFJPY - Trend continuation into GartleyTrend continuation starting if we break 111,75 or possibly a Gartley pattern back up to 112.50

NZDUSD Short ContinuationLooking to Re-Enter this Trend Following Protocols for Bearish Continuation Strategy for the most RR % return we can get from our Trade. Not sure if this will or won't play out this week but its definitely a set up to keep in mind for when price sets up properly for us.
