JHX @ 16 SEP 2021Text me if you have any questions/comments for me.
-----
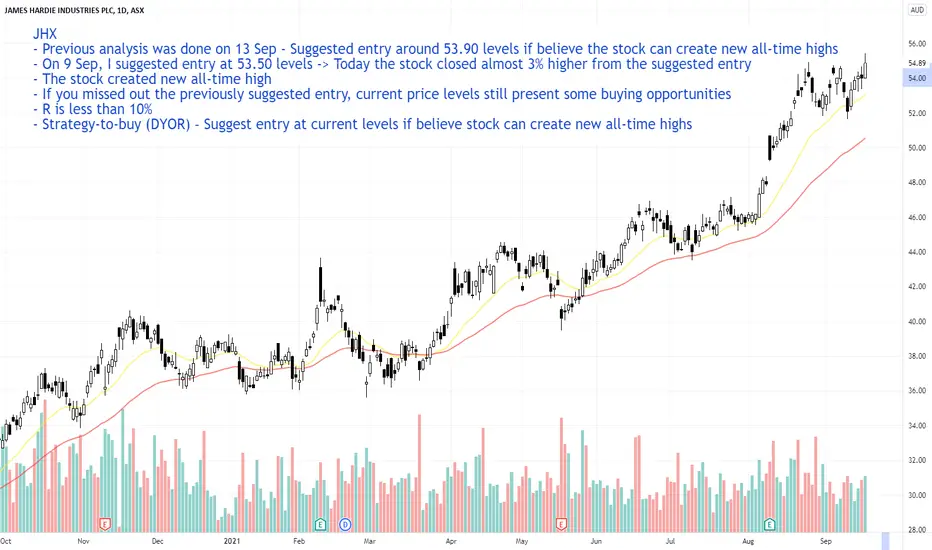
JHX
- Previous analysis was done on 13 Sep - Suggested entry around 53.90 levels if believe the stock can create new all-time highs
- On 9 Sep, I suggested entry at 53.50 levels -> Today the stock closed almost 3% higher from the suggested entry
- The stock created new all-time high
- If you missed out the previously suggested entry, current price levels still present some buying opportunities
- R is less than 10%
- Strategy-to-buy (DYOR) – Suggest entry at current levels if believe stock can create new all-time highs
Trendfollowing
JAN @ 16 SEP 2021Text me if you have any questions/comments for me.
-----
JAN
- First time doing a written analysis on JAN
- Trend only started looking good in Dec 2020 -> has some sideways movement that can test the patience of some mid-term traders
- Has been testing the psychological resistance of $1
- Stock is overstretched and quite far from the short-term support
- R is borderline 10%
- Strategy-to-buy (DYOR) – Suggest breakout entry if comfortable with a potential sharp retracement

INR @ 16 SEP 2021Text me if you have any questions/comments for me.
-----
INR
- Previous analysis was done on 31 Aug -> suggested waiting for retracement and successful rebound before plotting entry
- Since then, the stock flew like a rocket
- Today, the rocket’s parachute didn’t deploy -> Stock dropped almost 19% with above average volume
- Today’s price action is nothing new as stocks that have gone up a lot usually will have a sudden and sharp price reversal
- There is no structure break as of today but there is definitely a tear
- If the stock continues to break to the to the mid-term support or even falls below the 50-cent psychological support, there is not much hope left for the stock
- R is more than 10%
- Strategy-to-buy (DYOR) – Suggest waiting for a successful rebound

CNI @ 16 SEP 2021Text me if you have any questions/comments for me.
-----
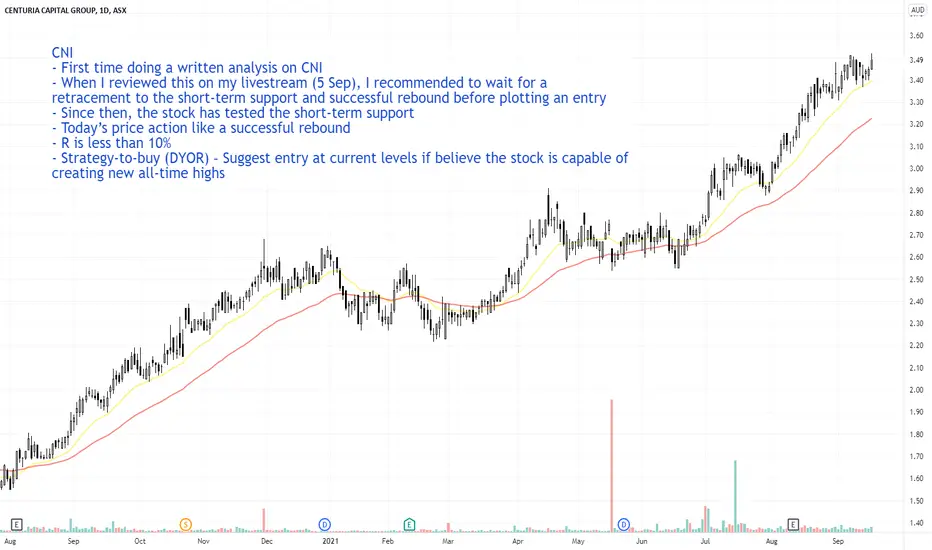
CNI
- First time doing a written analysis on CNI
- When I reviewed this on my livestream (5 Sep), I recommended to wait for a retracement to the short-term support and successful rebound before plotting an entry
- Since then, the stock has tested the short-term support
- Today’s price action like a successful rebound
- R is less than 10%
- Strategy-to-buy (DYOR) – Suggest entry at current levels if believe the stock is capable of creating new all-time highs
ACL @ 16 SEP 2021Text me if you have any questions/comments for me.
-----
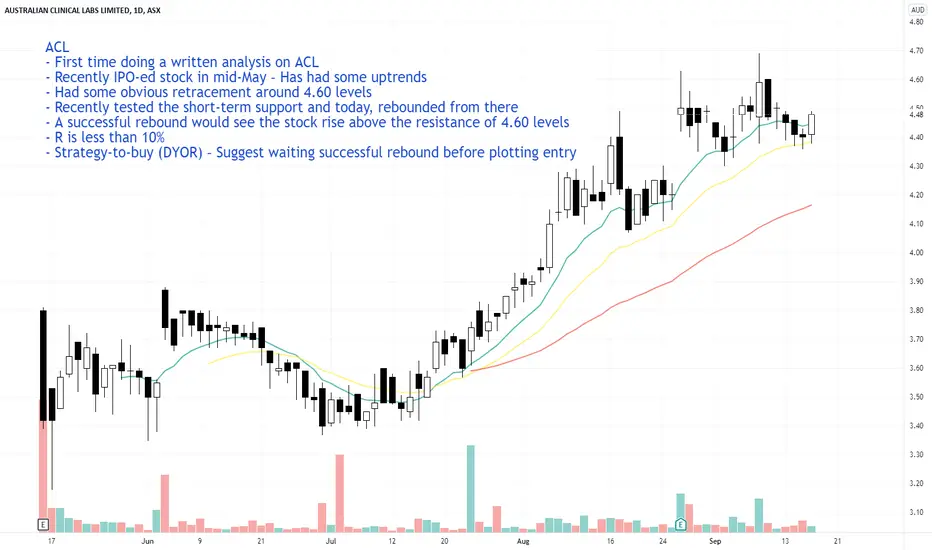
ACL
- First time doing a written analysis on ACL
- Recently IPO-ed stock in mid-May – Has had some uptrends
- Had some obvious retracement around 4.60 levels
- Recently tested the short-term support and today, rebounded from there
- A successful rebound would see the stock rise above the resistance of 4.60 levels
- R is less than 10%
- Strategy-to-buy (DYOR) – Suggest waiting successful rebound before plotting entry
GBPUSD is now a short 📉⤵️Entry details are shown on the chart.
Working the H1 time frame on this strategy.
We're only looking for TP3.
Trade history can be seen below this trade idea too for full transparency.
Previous trade was shared in an idea which has now closed for a small profit on this short trade presenting.
That idea can be seen below.
I'll follow the new trade now until TP, a new signal presents or stop loss is hit.
------------------------------------------
I try and share as many ideas as I can as and when I have time. My trades are automated so I am not sat in front of a screen daily.
Jumping on random trade ideas 'willy-nilly' on Trading View trying to find that one trade that you can retire from is not a sustainable way to trade. You might get lucky, but it will always end one way.
------------------------------------------
Please hit the 👍 LIKE button if you like my ideas🙏
Also follow my profile, then you will receive a notification whenever I post a trading idea - so you don't miss them. 🙌
No one likes missing out, do they?
Also, see my 'related ideas' below to see more just like this.
The stats for this pair are shown below too.
Thank you.
Darren.

LIC @ 15 Sep 2021LIC
- First time doing a written analysis on LIC
- Stock has a good history of uptrends
- 1st resistance (purple dotted line) – consolidated sideways for 4 months while still somewhat respecting the mid-term support
- 2nd resistance (blue line) – consolidated sideways for 1.5 months while still somewhat respecting the short-term line
- After breaking out, stock has had weak tests of the short-term support
- Today’s nice bullish pin bar after a strong test of the short-term support is accompanied by above average volume -> good
- After seeing today’s price action, I was tempted to get into the stock
- Unfortunately, there is no good setup for entry unless you use intraday strategies
- R is more than 10%
- Strategy-to-buy (DYOR) – Suggest waiting for a better setup for entry
-----
Text me if you have any questions/feedback for me.

IGO @ 15 Sep 2021IGO
- Previous analysis was done on 10 Sep -> suggested waiting for successful breakout of counter-trendline
- Stock has gapped up above the counter-trendline (purple dotted line) 2 days in a row but both times disappointingly retraced back
- Potentially strong psychological resistance at $10 levels
- The stock could retrace back to test the trendline (blue dash line) before attempting to breakout again
- Stock could just fly tomorrow too
- R is more than 10%
- Strategy-to-buy (DYOR) – Suggest waiting for successful breakout of $10 psychological resistance
-----
Text me if you have any questions/feedback for me.

AGL @ 15 SEP 2021AGL
- First time doing a written analysis on AGL
- Stock has been in a big downtrend since April 2017 -> a drop of almost 80%
- God bless the long-term investors as their capital is haemorrhaging
- In all 3 markets (Australia, Malaysia, and US), there was a big crash in stock prices in March 2020
- Most of the stocks have recovered to above pre-Covid crash levels
- AGL bucks the trend by creating new lows in August 2020
- Stock price has dropped more than 60% since that broken support
- Downtrend stocks have a lot of overhead resistances -> not conducive for a good mid-term uptrend to form
- Strategy-to-buy (DYOR) – There are other better stocks out there
-----
Text me if you have any questions/feedback for me.

GLN @ 15 SEP 2021GLN
- Previous analysis was done on 6 Sep -> suggested waiting for the next rebound wave for a better setup for entry
- Stock gapped above the 1.09 resistance levels with above average volume
- Stock has been consolidating nicely on the $1 psychological support
- No good setup for entry
- R is more than 10%
- Strategy-to-buy (DYOR) – Suggest waiting for the next rebound wave for a better setup for entry
-----
Text me if you have any questions for me.

NWF Olympic diver @ 15 SEP 2021NWF
- First time doing a written analysis on NWF
- Overall price action before mid-June isn’t attractive -> can signal to a lack of interest in the stock
- Low average volume -> Below 300k
- Low volatility uptrend with almost no pullbacks -> calm waters doesn’t mean there aren’t any crocodiles in them
Pros
- Since 2021, stock respects the moving averages
- Quiet uptrend -> usually signals a short-term uptrend
Cons
- I’m not comfortable with penny stocks (less than 50 cents in my book)
- Low daily average volume -> Price can move up/down suddenly if there is a huge purchase/selloff
Summary
- Yesterday’s retracement got me excited to see whether a successful rebound will happen
- Today’s gap down and crash below the two previously respected moving average supports is too drastic. Almost as if the supports didn’t exist
- In hindsight, the quiet uptrend looks like investors getting excited about the corporate action
- Strategy-to-buy (DYOR) – Suggest waiting for a series of Higher Highs (HHs) and Higher Lows (HLs)
-----
Text me if you have any questions for me.

CXL Rocket @ 15 SEP 2021CXL
- First time doing a written analysis on CXL
- Since IPO, $1 levels were a resistance until Nov 2020 (purple dotted line) when it turned into a support.
- R1 resistance – Sideways for more than 2 months
- R2 resistance – Sideways for 2 months
- R3 resistance – Sideways for more than 2 months
- R4 resistance – Sideways for 1.5 months
- R5 resistance – Sideways for 1 week before testing short-term support
- Today, it strapped rockets and never looked back
Pros
- Stock respects the short-term support a lot
- After testing the mid-term support, it usually breaks out from the overhead resistance after a few days
Cons
- Holding this stock would require a lot of patience as it take a couple of months of twiddling your thumbs before it breaks out
- Low daily average volume -> Below 500k shares
Summary
- Yesterday’s test of the short-term support got me excited as this is the kind of rebound entries that I trade -> The setup for a rebound trade would have a borderline 10% risk
- I’m not a patient person to wait a few weeks for my stocks to move; thus, I didn’t get in -> Hindsight is 20/20 of course
- No good setup for entry unless you use intraday strategies
- R is more than 10%
- Strategy-to-buy (DYOR) – Suggest waiting for retracement and successful rebound

Palladium Back At $2,000!Following the peak of the Covid pandemic in March 2020 when price declined by 48%,
price turned around and gradually moved back to the upside, eventually breaching
the all-time high 11 months later.
In May 2021, price created a new all-time high at $3,017 before heading back down
towards the weekly 50 simple moving average.
The 50 simple moving average was an important catalyst in the growth of price and
appeared as though is was going to hold as support again in August 2021.
Price breached this indicator and has since moved further down to the next obvious
level of support: the psychological $2,000 round number.
If this support zone holds strong, we should soon see a bounce back to the upside
and a bull trend resumption.
The bigger picture shows us that price is in a long-term period of consolidation,
which began in February 2020. The all-time high in May 2021 was just a fake breakout.
For now, this commodity will likely prove challenging to invest in, so the safest option
is to wait for a break and close above the all-time high at $3,017 before considering
any long opportunities.
See below for more information on our trading techniques.
As always, keep it simple, keep it Sublime.

S&P 500 Back At SupportSeptember is usually the weakest month of the year in the stock market, so we were
ready and waiting for a pullback to appear.
From September 2nd, we started to see a slow down in momentum as an indecision
candle formed and from there price started to decline.
The 20 and 50 simple moving averages are our expected levels of support, and as we
can see, price is now in the space between these two moving averages.
Since November 2020, both moving averages have acted well as support during the
trend. Although price has moved below the 50 simple moving average at times, it
has consistently resumed the trend and gone on to create new all-time highs.
If support holds again, we need to see a break and close above the all-time high
at $4,545, followed by a move towards $5,000.
See below for more information on our trading techniques.
As always, keep it simple, keep it Sublime.

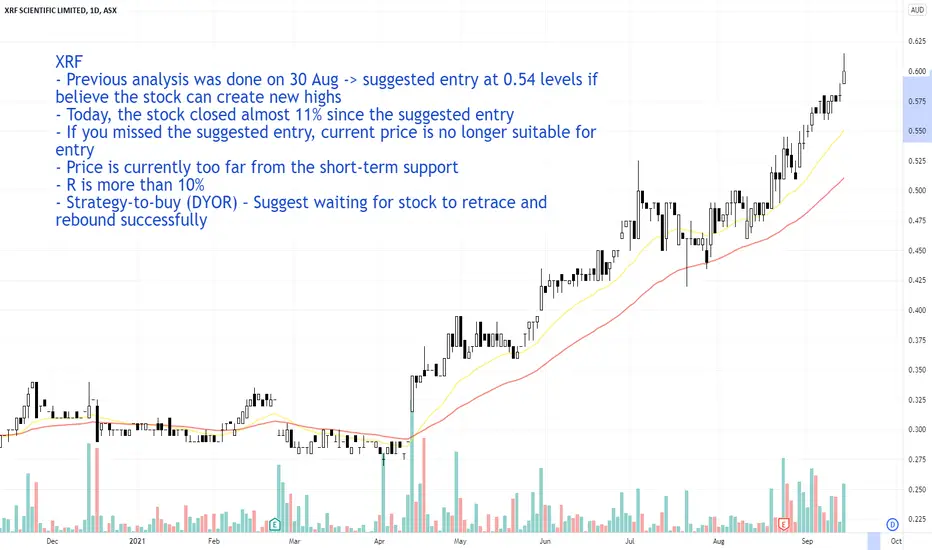
XRF @ 14 SEP 2021XRF
- Previous analysis was done on 30 Aug -> suggested entry at 0.54 levels if believe the stock can create new highs
- Today, the stock closed almost 11% since the suggested entry
- If you missed the suggested entry, current price is no longer suitable for entry
- Price is currently too far from the short-term support
- R is more than 10%
- Strategy-to-buy (DYOR) – Suggest waiting for stock to retrace and rebound successfully
-----
Text me if you have any questions for me.
TLS @ 14 SEP 2021TLS
- Previous analysis was done on 6 Sep - Suggested waiting for successful breakout of overhead resistances before entry
- Today’s price action sees the stock convincingly break the 3.90 resistance
- Next strong overhead resistance at 4.00 levels
- Half entry at current levels could provide an avenue to manage overall risk-reward
- R is less than 10%
- Strategy-to-buy (DYOR) – Suggest half entry at current levels if believe the stock can successfully breakout of resistance at 4.00 levels
-----
Text me if you have any questions for me.

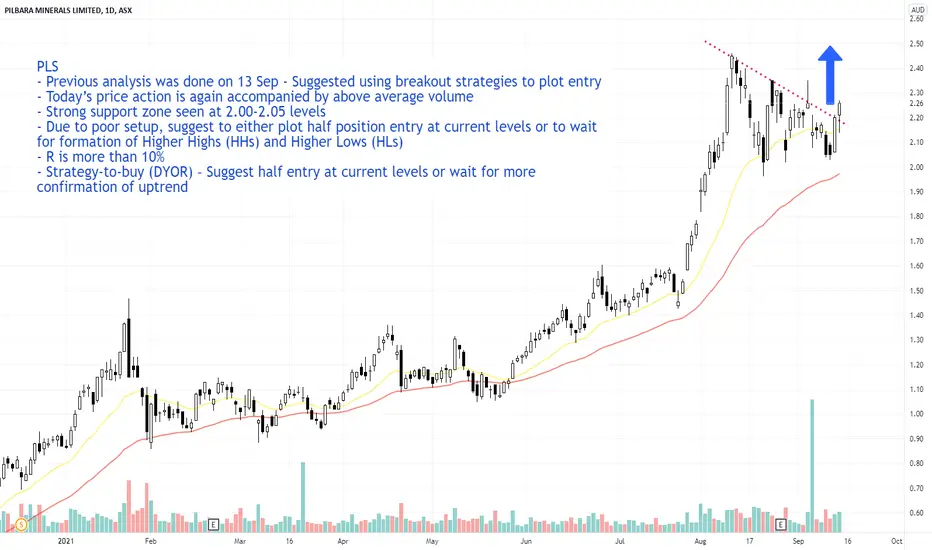
PLS @ 14 SEP 2021PLS
- Previous analysis was done on 13 Sep - Suggested using breakout strategies to plot entry
- Today’s price action is again accompanied by above average volume
- Strong support zone seen at 2.00-2.05 levels
- Due to poor setup, suggest to either plot half position entry at current levels or to wait for formation of Higher Highs (HHs) and Higher Lows (HLs)
- R is more than 10%
- Strategy-to-buy (DYOR) – Suggest half entry at current levels or wait for more confirmation of uptrend
-----
Text me if you have any questions for me.
LYC @ 14 SEP 2021LYC
- Previous analysis was done on 10 Sep - Suggested half entry at 7.10 levels if confident the stock can rebound to 7.50 levels
- If followed half entry suggestion at 7.10 levels, gains would be more than 5% in 2 days
- Stock today closed at 7.60 levels and there is no longer any good setup for entry
- Best case scenario for the overall health of the uptrend is for the stock to retrace and successfully rebound
- R is more than 10%
- Strategy-to-buy (DYOR) – Suggest waiting for a retracement and successful rebound
Text me if you have any questions for me.

IMD @ 14 SEP 2021IMD
- First time doing a written analysis on IMD
- Has history of mid-term uptrends that is interrupted by slow sideways price consolidation
- Holding this stock would require more patience
- This stock is finally making a move with a strong breakout from the counter-trendline (red dotted line)
- Continued strong price action in this trajectory could see the stock create a new all-time high
- R is borderline 10%
- Strategy-to-buy (DYOR) – Suggest entry above today’s high if believe the stock is capable of forming new all-time high

ILU @ 14 SEP 2021ILU
- Previous analysis was done on 13 Sep - Suggested entry around 10.25 levels if missed out on previously suggested entry levels of 9.90
- Today’s price action is quite far from the short-term support
- Even though there still is a borderline 10% risk setup for entry, it is recommended to manage risk by either entering half position or waiting for a retracement and successful rebound
- R is borderline 10%
- Strategy-to-buy (DYOR) – Suggest half entry at current levels or waiting for a retracement and successful rebound

CHC @ 14 SEP 2021CHC
- First time doing a written analysis on CHC
- Has history of good uptrends
- Stock respects the short-term support more of the time
- Trading in a tight band for the last 3 weeks -> I would call this “No Man’s Land”
- Formed a double top with strong resistance near 18.50 levels
- Today’s price action looks like the first signal of a rebound, but more price action is required
- A successful rebound would mean that a strong support would also be formed near 17.50 levels
- Due to strong overhead resistance, a breakout strategy is preferable
- R is borderline 10%
- Strategy-to-buy (DYOR) – Suggest waiting for successful breakout of either counter-trendline or 18.50 resistance levels

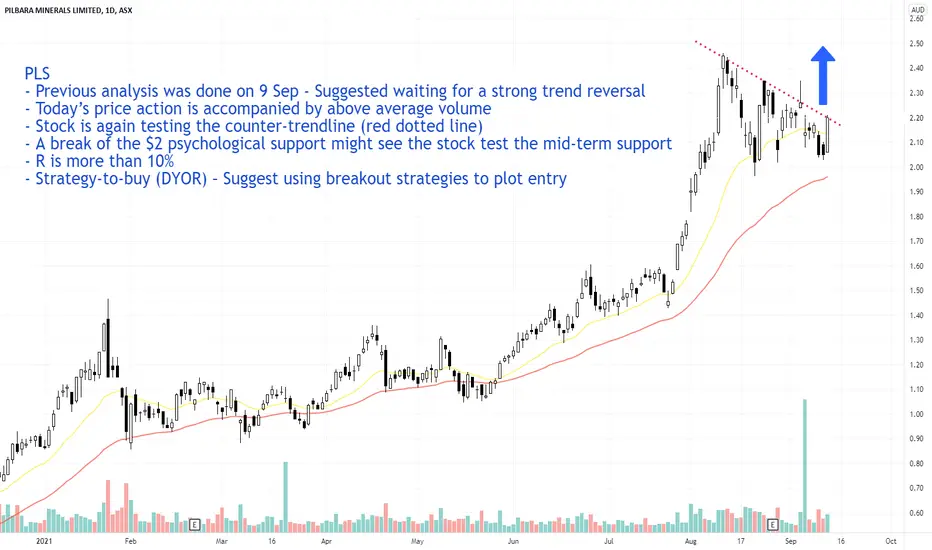
PLS @ 13 SEP 2021PLS
- Previous analysis was done on 9 Sep - Suggested waiting for a strong trend reversal
- Today’s price action is accompanied by above average volume
- Stock is again testing the counter-trendline (red dotted line)
- A break of the $2 psychological support might see the stock test the mid-term support
- R is more than 10%
- Strategy-to-buy (DYOR) – Suggest using breakout strategies to plot entry
SHL @ 13 SEP 2021SHL
- Previous analysis was done on 7 Sep -> suggested waiting for successful rebound to around 43.00 levels before plotting entry
- Recent price action has provided a slightly better setup for entry
- A successful rebound to around 42.75 levels would present an opportunity for entry
- R is less than 10%
- Strategy-to-buy (DYOR) – Suggest waiting for successful rebound before plotting entry
