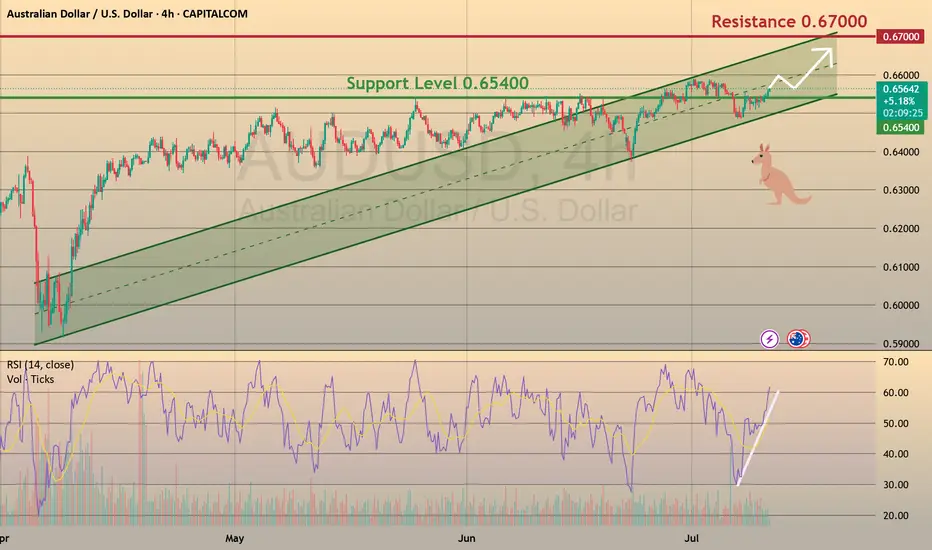
Aussie: Still Growing!
CAPITALCOM:AUDUSD
The bullish momentum continues after our last successful AUDUSD setup, and a move toward the 0.65900 resistance area looks probable now.
🪙 My Trading Plan:
🔼 BUY Stop: 0.65648
❌ Stop Loss: 0.65320
✅ Take Profit: 0.65965
💡 Why am I buying here?
✅ Price broke recent resistance at 0.65500, activating buy trades.
✅ RSI confirm ongoing bullish momentum 📊.
📰 Fundamental Situation:
🏦 RBA Rate Decision Supports AUD
The Reserve Bank of Australia (RBA) surprised markets by holding rates steady at 3.85% 🏛️, diverging from expectations of a cut. This cautious stance reflects the RBA’s preference to wait for clearer signs of slowing inflation 📉 before adjusting policy further.
Governor Michele Bullock emphasized that inflation risks remain persistent ⚠️, driven by high labor costs and weak productivity, possibly requiring a longer period of restrictive policy ⏳. Deputy Governor Andrew Hauser noted the bank is closely monitoring global risks 🌐, especially US tariff developments, underscoring sensitivity to global headwinds that could impact trade and growth 📦.
🌎 Trade Tensions in Focus:
President Trump ruled out extending tariff deadlines beyond August 1 ⛔, announcing new duties:
🔹 50% on copper 🪙
🔹 Potential 200% on pharmaceuticals 💊
🔹 10% on goods from BRICS 🌐
These moves are likely to intensify global trade tensions ⚔️, potentially impacting commodity flows and inflation, which the RBA and markets will continue to monitor closely.
Trendisyourfriend
Mastering Volatile Markets: Why the Trend is Your Best Friend█ Mastering Volatile Markets Part 4: Why the Trend is Your Best Friend
In Part 1 , we covered reducing position size.
In Part 2 , we explored liquidity and execution strategies.
In Part 3 , we discussed the power of patience over FOMO.
Now,we're diving into one of the most important principles of all — especially in volatile, fast-moving markets: Follow the Trend. Trust the Trend. Trade With the Trend.
In wild markets like these, everything changes quickly. Indicators print overbought or oversold conditions well before the market even thinks about reversing.
Divergences can keep stacking up while the price continues trending for another 300, 500, or even 1000 points. Why? Volatility + Liquidity conditions = Extended trending behavior.
When liquidity is thin, and volatility is high, strong trends tend to last longer than usual:
Breakouts run further.
Breakdowns fall deeper.
And counter-trend trades? They're often a fast ticket to losses.
█ What Pro Traders Know Better Than Anyone:
In volatile markets, trend-following isn't optional — it's survival.
But wait, it is obvious that trends aren't perfect straight lines. So how can one even realistically “follow” a trend, especially in volatile markets.
Well, the key is to expect the unexpected. Experienced traders trade logically, we expect pullbacks, fakeouts, stop hunts, snapbacks and/or channel breaks. In fact, we prepare for them.
It is detrimental to assume the trend is over just because of these moves. Most of these are liquidity traps, not real reversals.
█ Here's What Pro Traders Do Differently:
⚪ They Identify the Core Trend Direction
Pro traders use price structure, trendlines, moving averages, VWAP , or higher timeframe levels to identify the trend direction. Once identified, every trade respects the trend.
Let me explain with an example.
→ Uptrend Identification:
Say you notice that the price of Gold (XAUUSD) has been consistently making higher highs and higher lows. What should you do?
You use the 100-period moving average (MA) and see that price is staying above it, indicating an uptrend. You wait for price to pull back to the MA, giving you a low-risk entry to join the uptrend rather than chasing the trend.
→ Downtrend Identification:
In a downtrend, USD/JPY keeps making lower highs and lower lows. You observe the 100-period moving average pointing down. This is your cue to look for short entries , avoiding countertrend buys that could trap you.
⚪ They ONLY Look for Entries at Key Trend Channel Levels
Professional traders don’t chase the price or try to catch every move. Instead, they patiently wait for price to return to key areas within a well-defined trend channel , either the upper boundary (in a downtrend) or the lower boundary (in an uptrend).
→ In an uptrend:
Pro traders draw a trend channel based on the price move. When price pulls back to the lower boundary of the channel (often aligning with demand zones), they start looking for long entries, aiming to trade with the trend and target a new high.
→ In a downtrend:
The same logic applies, but in reverse. Price pulls back to the upper boundary of the channel (supply area), offering a clean short opportunity to continue with the trend and target a new low.
But here’s what separates pros from amateurs:
→ They expect fakeouts, spikes , and temporary breaks beyond the trend channel — especially in volatile conditions.
→ They don’t panic when the price briefly moves outside the channel. Instead, they wait for confirmation signals (like a rejection candle, break of structure, or momentum shift) before entering.
→ This gives them both a logical entry point and a favorable risk-reward setup — aligning with the larger trend direction while staying protected if the trend fails.
⚪ They Treat Countertrend Moves as Opportunities to Enter WITH the Trend
When a countertrend move happens, pro traders see it as an opportunity to enter with the prevailing trend, rather than trying to catch a reversal.
→ Counter-Trend Move in an Uptrend:
Let's say S&P 500 is in a strong uptrend, and it experiences a sharp pullback of 5%.
While many retail traders panic and try to short the market, pro traders see this as a buying opportunity at a lower price, anticipating the trend will continue after the correction.
→ Counter-Trend Move in a Downtrend:
For Gold (XAU/USD) , if the price falls sharply from $1,900 to $1,850 and then retraces back to $1,875 (a previous support-turned-resistance level), pros see this as an opportunity to sell into the trend rather than buying into what could be a false recovery.
⚪ They Accept That Trends Can Look "Overbought" or "Oversold" for a Long Time
In volatile, trending conditions, RSI can stay above 70 for hours or even days, and divergences can build for a long time without price reacting.
→ RSI Above 70 in an Uptrend:
Bitcoin (BTC/USD) rallies from $40,000 to $60,000. Despite RSI being above 70 for a few days, pro traders don't fight the trend because momentum is strong. Instead, they look for a pullback to the 100-period MA for a safer entry.
→ Divergence in Downtrend:
The EUR/USD shows a bearish trend , but the RSI starts to build a divergence as the price keeps making lower lows. Pro traders ignore the divergence because the trend is still strong. They wait for a clear break of the trendline or confirmation that price has reversed before considering a long trade.
█ Summary of Part 4 — Trend is Your Best Friend
You can't control how far a trend will run…but you can control whether you're with or fighting against it.
And trust me, fighting a strong trend in a volatile market is a battle retail traders rarely win.
Here’s what you should take away from this article:
Volatile markets = Extended trends
Indicators can lie — trend structure tells the truth
Fakeouts & pullbacks are normal
Don't fight the trend — trade with it
Use counter-moves to enter the trend
Patience & trend-following = Survival + Profit
█ What We Covered:
Part 1: Reduce Position Size
Part 2: Liquidity Makes or Breaks Your Trades
Part 3: Patience Over FOMO
Part 4: Trend is Your Best Friend
That's it! You've now completed the Mastering Volatile Markets series.
Stay calm, adapt quickly, and trade smarter — that's how you survive (and thrive) in volatile markets.
-----------------
Disclaimer
The content provided in my scripts, indicators, ideas, algorithms, and systems is for educational and informational purposes only. It does not constitute financial advice, investment recommendations, or a solicitation to buy or sell any financial instruments. I will not accept liability for any loss or damage, including without limitation any loss of profit, which may arise directly or indirectly from the use of or reliance on such information.
All investments involve risk, and the past performance of a security, industry, sector, market, financial product, trading strategy, backtest, or individual's trading does not guarantee future results or returns. Investors are fully responsible for any investment decisions they make. Such decisions should be based solely on an evaluation of their financial circumstances, investment objectives, risk tolerance, and liquidity needs.

Follow the trendWon 2 lost 1, So far so good, can't win them all. Important is to have proper risk management.
Find the trend, follow the trend, stay on trend.

DOGE/USDT (1D Chart)
DOGE/USDT continues to display bullish market behavior, consolidating within a **rising wedge** formation as the price trends upward. The narrowing of the wedge indicates that the price is approaching a critical point for its next major move.
**Key Observations:**
1. **Price Action:**
- The price remains firmly above key moving averages (20, 50, and 200), signaling a continuation of the broader uptrend.
- The narrowing wedge reflects a buildup of tension, typical before a decisive breakout or breakdown.
2. **Volume and CMF Dynamics:**
- A **notable drop in volume** is visible as the price consolidates, which often signals a pending sharp move.
- The **Chaikin Money Flow (CMF)** indicates declining momentum, highlighting a reduction in buying strength and market participation at this stage.
3. **Momentum Indicators:**
- **OBV (On-Balance Volume):** Maintains an upward trend, indicating consistent accumulation despite the consolidation.
- **RSI:** At **70.95**, the slightly overbought reading suggests the possibility of temporary consolidation or a pullback before a potential continuation of the uptrend.
**Conclusion:**
DOGE/USDT is approaching a decisive moment as it consolidates within its rising wedge. The **drop in volume**, visible both on the chart and through the **CMF**, is a common precursor to significant price action. While momentum remains intact, traders should watch for increased activity that confirms the next move.

USDCHF Final Flag Retracement for BULL Continuation!? FX:USDCHF
Time Frame: 1 Hour
Trend: Bull
Pattern:
~Price formed big bull break out @0.8921 AND 0.9005
~Price forming a bull flag on Hourly
~Price always consolidates after a big with trend move
~Buys only @ 0.9005 and 0.9020 Area of Interest
Time Frame: 15 Minute
Trend: Bear
Pattern:
~Price formed a series of lower highs and lows
~Price broke through down trend channel @0.90354
~Price broke down trend channel indicating end of down trend
~Buy if price retraces the 1.618 fib extension of bull leg breakout of down trend channel for price to rally back to 0.90354 where structure last broke
ENTRY
Buy @ 0.90166 which is at 1.618 fib extension of bull leg breakout of down trend channel
SL @ 0.90121
TP @ 0.90416

EURUSD 4H Setup Bearish or Bullish ?Hello Trader, I found some Setups to $short $GU on the 4H TF The Overal Trend is BEARISH on A WEEKLY to DAILY Scale so Shorting EU is wisely as We gonna Pullback because we reached a Weekly Structure so as we are familiar of the saying the trend is your friend is wisely to follow the Overall trend which is Bearish

GBPAUD: News of China strengthens the Aussie!Hello traders,
There is one entry and a TP for this pair.
You could hold for a 2nd TP, we DON'T !
Levels calculated order_block, regarding support and resistances, channel and pivot points.

NIKKEI Uptrend And Support! Buy!
Hello,Traders!
NIKKEI is trading in an
Uptrend and trend is your
Friend so as the index
Is retesting a horizontal
Support of 32,000 I think
That we will see a local rebound
Buy!
Like, comment and subscribe to help us grow!
Check out other forecasts below too!

Trading is SimpleSelect number of stocks based on your own fundamental criterias. After that you just need to identify the sentiment/trend of each stocks. The most basic and easy way to identify it is the 20ema/50ema situation in the Daily TF (you can zoom in or zoom out to different TF. Up to you).
When 20ema is above 50ema, then move to a smaller TF to time your entry, to find optimal entry point.

How to SPOT a TRENDTrend trading strategies are very valuable as a trader. The term the trend is your friend is fitting when trading stocks. Knowing how to identify the trend is very important because it gives important clues for entries and exits when trading.
"Whatever method you use to enter trades, the most critical thing is that if there is a major trend, your approach should assure that you get in that trend."
-Richard Dennis.
“Fundamentals that you read about are typically useless as the market has already discounted the price, and I call them “funny-mentals”. I am primarily a trend trader with touches of hunches based on about twenty years of experience. In order of importance to me are: (1) the long-term trend, (2) the current chart pattern, and (3) picking a good spot to buy or sell. Those are the three primary components of my trading. Way down in a very distant fourth place are my fundamental ideas and, quite likely, on balance, they have cost me money.” – Ed Seykota
“I’ve learned many things from him , but perhaps the most significant is that it’s not whether you’re right or wrong that’s important, but how much money you make when you’re right and how much you lose when you’re wrong.” – Stanley Druckenmiller
“I just wait until there is money lying in the corner, and all I have to do is go over there and pick it up. I do nothing in the meantime. Even people who lose money in the market say, “I just lost my money, now I have to do something to make it back.” No, you don’t. You should sit there until you find something.” – Jim Rogers
“Play the market only when all factors are in your favor. No person can play the market all the time and win. There are times when you should be completely out of the market, for emotional as well as economic reasons.” – Jesse Livermore
“Whenever I enter a position, I have a predetermined stop. That is the only way I can sleep. I know where I’m getting out before I get in. The position size on a trade is determined by the stop, and the stop is determined on a technical basis.” – Bruce Kovner
"Amateurs think about how much money they can make. Professionals think about how much money they could lose."
–Jack Schwager.
"The price of a commodity will never go to zero. When you invest in commodities futures, you are not buying a piece of paper that says you own an intangible of the company that can go bankrupt."
–Jim Rogers.
"It's not always easy to do what's not popular, but that's where you make your money. Buy stocks that look bad to less careful investors and hang on until their real value is recognized."
-John Neff.
"We don't care about 'why'. Real traders only have the time and interest to care about 'what' and 'when' and 'if' and 'then'. 'Why' is for pretenders."
-JC Parets.
"You only have to do very few things right in your life so long as you don't do too many things wrong."
-Warren Buffett.
"The goal of a successful trader is to make the best trades. Money is secondary."
-Alexander Elder.
"Do not anticipate and move without market confirmation—being a little late in your trade is your insurance that you are right or wrong."

VISA - BULLIS CONTINUATIONThe middle Visa price target is $256.47, with the highest Visa stock price forecast at $288.00 and the lowest Visa stock price forecast at $210.00 for the range of 2023. Visa is one of the leaders in card issuing and the digitalizing of payments makes card transactions a daily routine, carrying cash is very old-fashioned. That's why we think Visa is something likely to grow for at least a year or two before taking over by crypto for example. Who knows of Ripple's win against SEC to see Ripple's dominance in transacting and companies like Visa and Mastercard go down the drain?
Risk Disclosure: Trading Foreign Exchange (Forex) and Contracts of Difference (CFD's) carries a high level of risk. By registering and signing up, any client affirms their understanding of their own personal accountability for all transactions performed within their account and recognizes the risks associated with trading on such markets and on such sites. Furthermore, one understands that the company carries zero influence over transactions, markets, and trading signals, therefore, cannot be held liable nor guarantee any profits or losses.

NASDAQ : New uptrend in sightObserving the price dynamics of the last daily candlesticks, we see that from the high of February 2nd, the market has started a retracement movement, creating bearish swings that have brought the price back within the dynamic channel, reaching LuBot's TrendCloud.
We now see a bullish signal with large volatility closing above all major moving averages after the last swing low hit the ema21 Weekly and creating a new positive swing from which the positive swing count could restart.
Considering that the candle closed on the resistance level, I could expect a short retracement that could bring the price around 12150/12050, a movement that I will use to enter my Long entry with stop loss below the last swing low and take profit in the maximum area at 12700.
Observing the Weekly chart below, we see that a beautiful price dynamic has formed which shows how the breaking of the high of the following weekly candle would trigger a trigger that could bring the prices to the 13500 area where we find the next more resistance area important.
Let's keep an eye on it in the next few days because there could be several signals of following the trend.
For this analysis I mainly used the LuBot indicator with signal settings set to "MultiSignals", Signal style = 1, no limit on signals.
If you want to use it too, you can ask me for a free 7-day trial without obligation.
Best wishes and happy trading to all

GBPUSD bearish targets FX:GBPUSD
Hes Traders, GBP/USD has been unable to break the top trendline on the daily view. In my opinion for next week, GBP/USD will not be able to break this trendline, it may wick above it for a short time, but it will not completely break it. A complete break for me would be more than two 4-hour candles closing bullish. Another indication of a bearish move for me is the daily Fibonacci retracement, it is currently just above the 68% level. On the 4-hour chart, the currency is at the 78% level and also in a major resistance zone. This is the third time that the currency has attempted to break this zone, and I don't think that will happen if the USD is bullish.
My target profit zone would be the Fibonacci -27 level, as there is also a significant resistance/support zone there.

EUR/USD SHORT EUR/USD ANALYSIS ALL TIME FRAME
Accum,Re-accum distr
Trend analysis,we are looking for big move to the down!
EUR/USD
SELL
U:1.03750
TP 1.20000
TP 0.99400
SL:1.04125
Just idea,not advice!!!

Simple yet effective pure price actionall I will say that I'm gonna keep my bias neutral fir tomorrow or maybe 60% down 40% up. but still price action is right in front of us. all we gonna do is just follow the price and be with the trend. we may can witness a trending day tomorrow.
Best of luck traders.

EURUSD in humangus wedge?!! Yeah it appears so :)So basically we have a dance between eurusd and dxy - and emaflow is really good at projecting these ranges . EUR needs to stay above the green oversold area - but something tells me it will... we're basically really really not like 2000ish, and we're basically in a wedge?
All this points towards a potential eurusd soon bottoming - this historically also was during bear markets but not recessions - also if we are building a recession - historically it took 2 years for eur to crash.. we might do it sooner but overall i think we're due for a bounce.
Ye like its god damn 2013 all over again. Or maby inflation kills us anyway. Time will tell...
Keep in mind this gets invalidated if we crash below our os area.

CADCHF ANALYSISCADCHF is going lower, structures are being broken and the main trend is bearish.
DISCLAIMER: This is not a financial advice

What if FED fails and we get full blown recession?EMAflow has the answers:
- Takes 8 years avg to clear fully - with revisits of provious ath in between and also lows but signal defines potential bottom when revisit comes.
- 8 signals since 1913-2022 in 109 years.
6 ignoring double signals in short time - this means on avg every 18 years we get crisis.
- 2652 is current target if this plays out.
We're yet to get a signal! -- not yet confirmed!

btcusdtperpHello friends
As you can see, the price chart has a divergence
But divergence operates when the price of 29800 is recorded
Be successful and profitable

btcusdtperphello my friends
as you can see the chart ,price can pull back to the trend line ,so I got short position

Risk to Reward ratio is the QUEEN - Number two reason to tradeWhen i want to take a trade, I look for ODD ENHANCERS, the more odd Enhancers I have the more likely the market will turn in my favour.
One of the most important Odd Enhancers is proper Risk to Reward ratio. Rs/Rw means how much am willing to risk if the trade goes against me, divided by how much Reward is trade gives if it is profitable. A properly weighted Rs/Rw ratio yield a factor of 4 to 5.
In this trade on QSR traded on the NASDAQ, am risking a little over a dollar for a reward of four dollars & much more if the new formed downtrend continues.
now, we got the Rs/Rw ratio out of the way of teachings. why would i Enter this trade. If Risk to Reward is the Queen then identifying the Trend is KING.
You must of heard people say, trade the trend, swim with the current not against it & you flow.
- first step Identify the Trend on any longer term chart. (there are many techniques for this)
- Second step trade the trend corrections on the Short term chart (this is the chart I use to identify my ENTR price & my STP losses)
This is it! identify the trend on the bigger picture & look for opportunities to join.
In this Trade. according to my Trend identification technique, I observed the Week (W) long term trend to turn into a downtrend after it broke the last LH of the previous week uptrend. now the trend is down. am looking to short.
I ENT my SHRT at 59.80 with a tight STP above 61.03 my risk is tolerable when compared to my Reward if the downtrend was to continue. well, it is struggling. my trigger STP was triggered & am out. simple as that. I will take my small loss & walk away holding my head high in respect for my trading plan that does not work all the time but works enough that i can make a living doing this.


Motilal Oswal Fin BreakoutMOTILALOFS broken resistance of ~897 with good volume.
RS is positive above 0.
Sector also turning bullish.
This can give good upside move of 25-30%.
