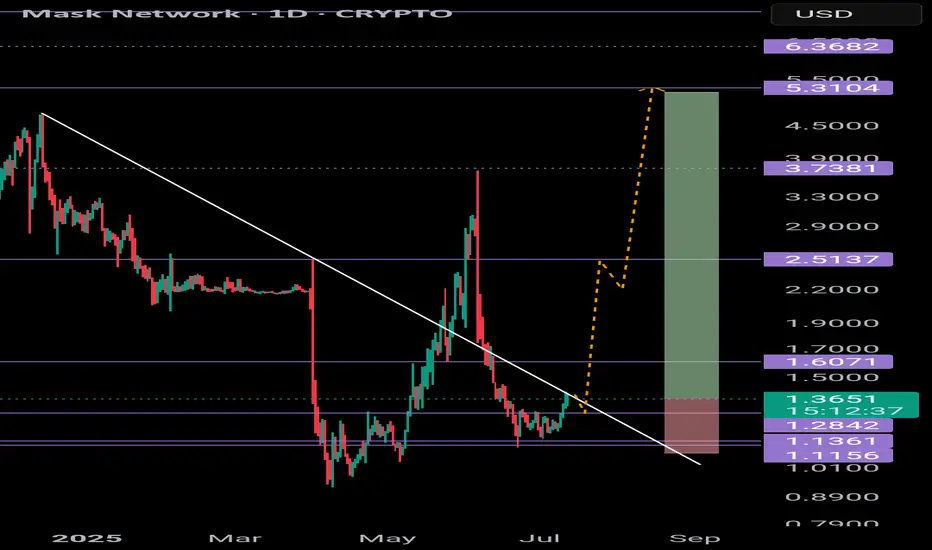
MASK getting ready to pop... again?1D timeframe
MASK is currently re-testing the downtrend. Breaks above could send price to 5.30 which has acted as resistance 4 x times historically.
We did see a fake-out of the downtrend before a significant move to the downside bringing us back underneath and back to previous support levels.
Wouldn't be suprised if we re-tested 1.30 as support before going up.
280% up vs 21% down
Reward vs Risk @ 13:1
Trend Lines
GOLD → Retest of consolidation resistance. Breakout?FX:XAUUSD is consolidating in a symmetrical triangle pattern. The price is stabilizing amid a falling dollar and uncertainty...
Gold is recovering after falling to $3,283 thanks to a weaker dollar and lower bond yields amid concerns over Trump's new tariff threats. The announced tariffs against seven countries, including Brazil and the Philippines, have heightened tensions, partially offsetting the Fed's hawkish signals. Markets are now awaiting new data from the US and speeches by Fed officials, which could influence the further dynamics of gold.
Technically, gold is squeezed between the resistance and support of a symmetrical triangle. The price is being aggressively pushed away from support within a bullish trend, but at the same time, gold is testing resistance for the fifth time, which only increases the chances of a breakout.
Resistance levels: 3330, 3345, 3358
Support levels: 3308, 3295
If gold continues to storm the local resistance at 3330 and the triangle resistance during consolidation, we will have a good chance of catching the breakout and growth. An additional scenario could be growth after a shake-up of the triangle support and the global trend.
Best regards, R. Linda!

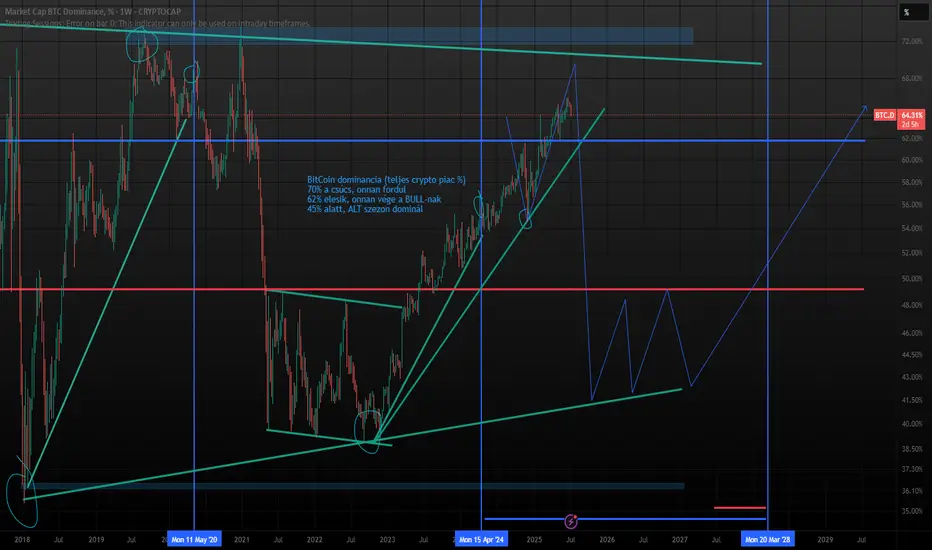
Altseason 2025 - Wave 3Bitcoin is approaching its next destination between $125K and $250K, and that means its time to shift focus to altcoins. We’re not in full-blown altseason yet, but the foundations are forming. BTC dominance needs to drop fast, that’s the key trigger. Once it does, the rotation into alts could accelerate quickly.
Favorites so far this cycle:
🥑 POLONIEX:GUACUSDT 🧱 MEXC:YBRUSDT ⛏️ MEXC:KLSUSDT
🌐 HTX:SYNTUSDT 🧪 MEXC:DEAIUSDT *⃣ MEXC:SAIUSDT
🔗 POLONIEX:LLUSDT 🎮 KUCOIN:MYRIAUSDT 🤖 COINEX:ENQAIUSDT

Altseason 2025 - Wave 3Bitcoin is approaching its next destination between $125K and $250K, and that means its time to shift focus to altcoins. We’re not in full-blown altseason yet, but the foundations are forming. BTC dominance needs to drop fast, that’s the key trigger. Once it does, the rotation into alts could accelerate quickly.
Favorites so far this cycle:
🥑 GUACUSDT 🧱 YBRUSDT ⛏️ KLSUSDT
🌐 SYNTUSDT 🧪 DEAIUSDT *⃣ SAIUSDT
🔗 LLUSDT 🎮 MYRIAUSDT 🤖 ENQAIUSDT

Altseason 2025 - Wave 3Bitcoin is approaching its next destination between $125K and $250K, and that means its time to shift focus to altcoins. We’re not in full-blown altseason yet, but the foundations are forming. BTC dominance needs to drop fast, that’s the key trigger. Once it does, the rotation into alts could accelerate quickly.
Favorites so far this cycle:
🥑 GUAC/USDT 🧱 YBR/USDT ⛏️ KLS/USDT
🌐 SYNT/USDT 🧪 DEAI/USDT *⃣ SAI/USDT
🔗 LL/USDT 🎮 MYRIA/USDT 🤖 ENQAI/USDT

ISL LongCurrently Fib 0.5 of its all-time high and its last peak - both are showing resistance.
Once it breaks the level, the trendline will act as resistance (~114).
After that it may speed-up towards its next targets of 121, 146 and previous all-time high.


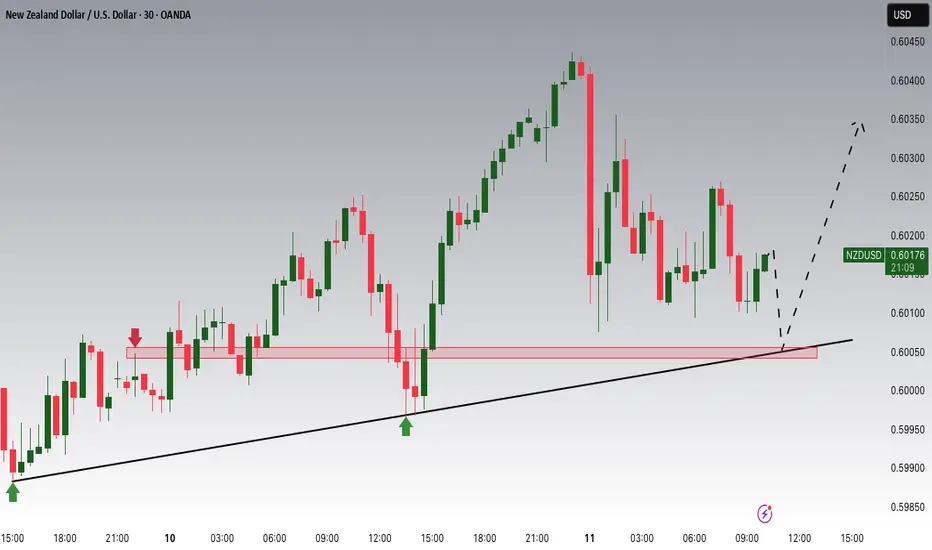
NZDUSD Potential UpsidesHey Traders, in today's trading session we are monitoring NZDUSD for a buying opportunity around 0.60000 zone, NZDUSD is trading in an uptrend and currently is in a correction phase in which it is approaching the trend at 0.60000 support and resistance area.
Trade safe, Joe.
AUDUSD Potential UpsidesHey Traders, in today's trading session we are monitoring AUDUSD for a buying opportunity around 0.65300 zone, AUDUSD is trading in an uptrend and currently is in a correction phase in which it is approaching the trend at 0.65300 support and resistance area.
Trade safe, Joe.

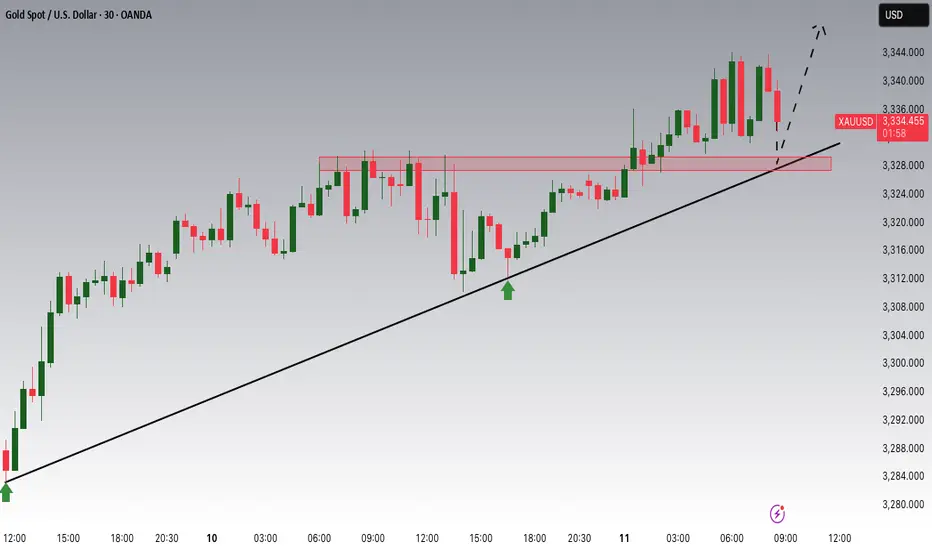
Gold Potential UpsidesHey Traders, in today's trading session we are monitoring XAUUSD for a buying opportunity around 3,330 zone, Gold is trading in an uptrend and currently is in a correction phase in which it is approaching the trend at 3,330 support and resistance area.
Trade safe, Joe.
Where will gold prices go at the weekly close?The mentality of trading is very important. At the same time, you must have clear ideas and decisive actions. Gold has been in a state of rapid growth. Many people are easily led to big losses by a small mistake. If you are worried about the loss at this time, you can choose to observe our daily operations in the group. The operations in the group are reasonable and well-founded, with real-time current price orders, and the returns are also considerable. Everyone is welcome to come and verify.
Gold risk aversion has driven gold to strengthen. The current bullish trend of gold is strong. The decline during the US trading session is still dominated by long positions. Technically, the 1-hour moving average forms a golden cross upward, indicating sufficient bullish momentum. After the gold price breaks through, it is confirmed that the support level of 3330 is effective, and the short-term support structure has been formed. It is recommended to wait for the second opportunity for the gold price to step back! Although the 1-hour chart shows that the current trend remains strong and the step-back amplitude is small, it is necessary to maintain a cautious attitude-even if the market is strong, it is not recommended to chase more, and it is necessary to guard against the risk of a deep correction in the gold price. In terms of operation, it is reminded that you can focus on the support level below: the first support level is 3345 (bull-bear watershed). If it falls below, pay attention to the key support of 3330. If the gold price falls back to around 3345 and stabilizes, you can consider a light position to try more.

ConAgra Brands | CAG | Long at $19.38ConAgra Brands NYSE:CAG , maker of Marie Callender's, Healthy Choice, Birds Eye, Orville Redenbacher's, Slim Jim, and many more, has seen a continuous drop in share price since the rise of interest rates, inflation, and tariffs. The stock is currently trading near its book value of $18.71 and has a dividend yield of 6.9%. Debt-to-equity is reasonable (0.9x), but the company does have a Quick Ratio of 0.2x (short-term liquidity issues) and a Altman's Z Score (bankruptcy risk) of 1.7, which should ideally be 3+. Like almost every large-scale food company, earnings growth is relatively low, but 2025 is anticipated to be its worst performing year - which explains the price.
While the stock is not likely to generate triple-digit returns in the near-term, NYSE:CAG is a strong company with a nice dividend and some growth ahead. I foresee such stocks getting new life with drops interest rates. However, a dip near $17 (into my "crash" simple moving average area) or even slightly lower is possible - which may likely result in another stock entry.
Thus, at $19.38, NYSE:CAG is in a personal buy-zone with future entries planed near $17 or below.
Targets into 2028
$22.00 (+$13.5%)
$25.00 (+29.0%)

BTC.D dominance is close to its peakBTC.D dominance is close to its peak.
Around 70% is expected to peak
falls below 62%, end of Bitcoin BULL trend,
below 45% ALT season dominates.
Blue vertical line for 4-year cycles (halving)
GOOGL Short Term Trading IdeaEntered at $173.55 on 07/08.
Expecting earnings to be reported on 07/23 and beat expectations by a huge margin.

Although the bulls are strong, don't chase them at high levelsGold trend analysis:
The market is fluctuating repeatedly now, and it is possible to rise or fall, but under the bullish trend, the main force is still rising. Therefore, this week's trading is to fall back and do more at a low price. Whether it is the previous 3285, 3306, or 3315, there are good profits. Although it is temporarily unable to break out of the bullish volume, at least the trend remains unchanged, and there will definitely be a large upward space in the future. Today is Friday, and we still pay attention to the possibility of bullish volume. This week, we have been emphasizing that if it rises during the week, we will see the 3370 high point. If 3370 breaks, there are still 3380 and 3400 above. On Friday, we will see whether this idea is realized.
From a technical point of view, there was a sharp pull this morning, with the big sun breaking through the upper track of the downward channel 3326 in the above figure, and then stepping back to confirm stabilization and bottoming out, which means that the breakthrough is effective, so you can directly follow the bullish trend in the morning, and during the European session, it repeatedly went up and down around the 3345-3332 range. With the experience of yesterday's trend, today we have been waiting for it to approach the 10-day moving average and then continue to be bullish on dips, and the entry point is basically good; currently it has broken through the resistance level of 3345 in the European session, so it depends on whether it can stand directly on it tonight. Once it stands, it can gradually rush to 3370, and the second is 3374, etc.; Of course, if it just pierces but does not stabilize, it will continue to spiral slowly upward around the yellow channel in the figure, so continue to wait patiently for the 10-day moving average, which is also the lower track position to grasp the low and long; Therefore, tonight gold 3345-3333 continues to rise on dips, with 3330 top and bottom positions as nodes, resistance at 3370, further resistance at 3374, etc.; If there is an unexpected big negative inducement to empty the market like yesterday, pay attention to stabilization above 3320 and still bullish;
Gold operation strategy: It is recommended to go long when it falls back to 3333-3345, and the target is 3360-3370.

DXY Targeting Liquidity Zones & Gap Fill Before Potential ReversThe U.S. Dollar Index (DXY) is showing a strong bullish push, climbing steadily along an ascending trendline. Price appears to be heading toward key liquidity levels and a visible Fair Value Gap (FVG) near the previous New York high. The chart also highlights an unfilled gap above, which aligns with a potential liquidity sweep scenario.
Once these upper zones are tapped — including the liquidity and imbalance areas — a significant rejection could follow, especially considering ongoing strength in the Euro (EUR). This setup suggests a high-probability reversal opportunity after the liquidity grab
