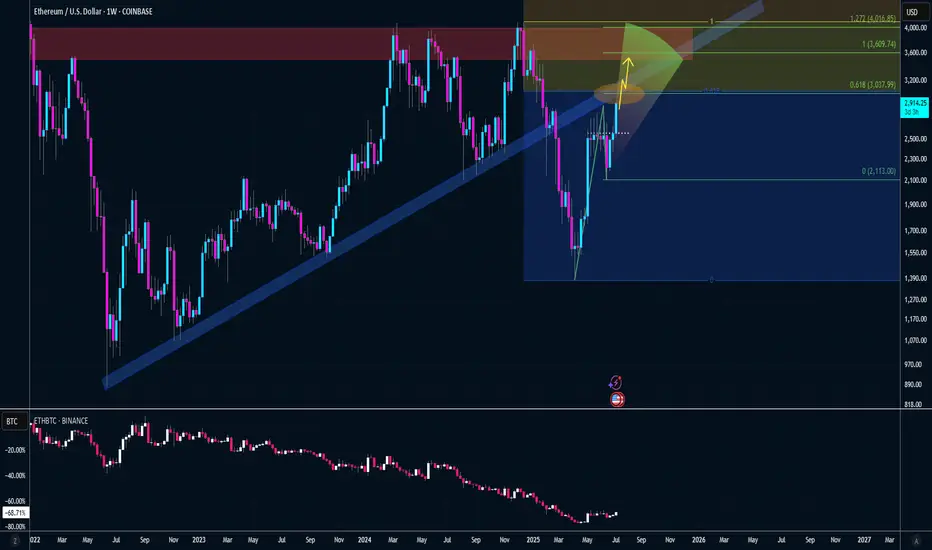
GO LONG ETH BEFORE "CRYPTO WEEK"Next week is "Crypto Week" in the U.S. House of Representatives. The House will consider the CLARITY Act, the Anti-CBDC Surveillance State Act, and the GENIUS Act.
Bill Helps Ethereum By...
CLARITY Act Protecting decentralized infrastructure from U.S. blacklists
Anti-CBDC Act Preserving demand for decentralized stablecoins, defending privacy
GENIUS Act Encouraging gov use of public blockchains like Ethereum
Trend Lines
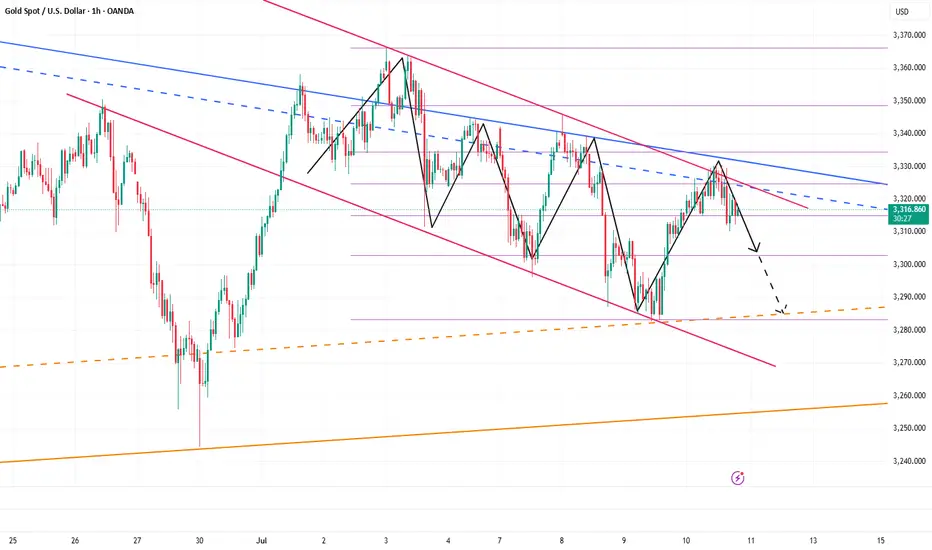
Golden Trap: Bulls Exhausted, Bears Ready to StrikeToday, the gold market is in a stalemate between long and short positions, with the market fluctuating sideways for a long time and maintaining an overall volatile trend. Although the rebound of gold has won a respite for the bulls, the rebound of gold during the day is not enough to completely reverse the decline. I think that before the 3325-3335 area is stabilized, the bears still have spare power to dominate the market!
According to the current structure, although gold rebounded again after touching 3310 during the retracement, it has retreated many times during the rebound. The candle chart is interspersed with obvious negative candle charts, indicating that the rebound strength is weak. In the short term, it is under pressure in the 3330-3340 area, and it is difficult to break through in a short time.
So I think the role of the gold rebound may be to trap more buyers, so we try not to chase gold after the rebound. The area near 3310 is not a key support in the short term. 3305-3300 is the current key support area. Once the bears regain control of the situation, gold may test the 3305-3300 area again. Once it falls below the reformed area, it may test 3280 again, or even refresh the recent low to around 3270.
So the downward potential of gold is not over yet. We can still look for opportunities to short gold in the 3325-3335 area and look at the target 3305-3295 area.
SOLB | Confirmed Descending Triangle Breakout – 32% Target📍 Ticker:
SOLB (Solvay SA – Euronext Brussels)
📆 Timeframe: 1D (Daily)
📉 Price: €30.14
📈 Pattern: Descending triangle breakout confirmed on daily close
📊 Breakout Probability estimation: ~73% (short-term triangle breakout upward)
🔍 Technical Setup (Updated on Daily Chart):
Solvay has now confirmed the breakout on the daily timeframe, closing above both the horizontal support and the descending trendline. This marks a multi-timeframe confluence breakout, increasing confidence in the projected move toward upper resistance levels.
✅ Daily candle close above descending resistance
✅ RSI breakout above 55, building momentum
📉 Stop clearly defined under €27.90 → optimal risk profile
📊 Volume expanding, validating move
🧠 Updated Trade Plan:
📥 Entry Zone: €29.90–€30.50 (daily confirmation)
⛔ Stop-Loss: Below €27.90
🔁 Hold while structure remains above descending trendline support
🎯 Upside Targets & Potential Return (from €30.14)
🎯 Target Price Return
Target 1 €33.84 +12.06%
Target 2 €39.76 +32.21%
📊 Pattern Probability – Daily Structure:
📐 Pattern: Descending Triangle Breakout
🔺 Upward breakout probability: ~73%
🎯 Full measured move supports Target 2 if buyers remain active
⚠️ Technical Signals to Watch:
🔎 Retest of descending line on lower volume = strong
✅ RSI > 55 with bullish structure
📈 Rising volume → growing institutional interest
📊 Price reclaiming structure from broader daily consolidation
💬 Solvay is transitioning from a textbook 4H breakout to a multi-day continuation setup. The alignment of pattern, structure, and momentum makes this one of the cleaner swing setups on the European market right now.
🔔 Follow @TargetTraders for high-probability technical trades.
#SOLB #BreakoutSetup #DescendingTriangle #TechnicalPattern #SwingTrade #Euronext #TargetTraders #VolumeBreakout #ChartAnalysis

More Upside in Wheaton Precious Metals? Wheaton Precious Metals has consolidated for more than a month, and some traders may think it’s poised to continue higher.
The first pattern on today’s chart is the April 21 high of $87.42. The silver company stayed below that level through June 2. It then shot above it and held the same price over the following month. That could suggest old resistance has become new support.
Second, WPM appears to have broken a falling trendline.
Third, the 8-day exponential moving average (EMA) has stayed above the 21-day EMA. That may reflect a bullish short-term trend.
Finally, Bollinger Band Width in the lower study highlights tighter movement. Will that price compression give way to price expansion?
Check out TradingView's The Leap competition sponsored by TradeStation.
TradeStation has, for decades, advanced the trading industry, providing access to stocks, options and futures. If you're born to trade, we could be for you. See our Overview for more.
Past performance, whether actual or indicated by historical tests of strategies, is no guarantee of future performance or success. There is a possibility that you may sustain a loss equal to or greater than your entire investment regardless of which asset class you trade (equities, options or futures); therefore, you should not invest or risk money that you cannot afford to lose. Online trading is not suitable for all investors. View the document titled Characteristics and Risks of Standardized Options at www.TradeStation.com . Before trading any asset class, customers must read the relevant risk disclosure statements on www.TradeStation.com . System access and trade placement and execution may be delayed or fail due to market volatility and volume, quote delays, system and software errors, Internet traffic, outages and other factors.
Securities and futures trading is offered to self-directed customers by TradeStation Securities, Inc., a broker-dealer registered with the Securities and Exchange Commission and a futures commission merchant licensed with the Commodity Futures Trading Commission). TradeStation Securities is a member of the Financial Industry Regulatory Authority, the National Futures Association, and a number of exchanges.
TradeStation Securities, Inc. and TradeStation Technologies, Inc. are each wholly owned subsidiaries of TradeStation Group, Inc., both operating, and providing products and services, under the TradeStation brand and trademark. When applying for, or purchasing, accounts, subscriptions, products and services, it is important that you know which company you will be dealing with. Visit www.TradeStation.com for further important information explaining what this means.

EURUAD is in the Buy direction from the Third Touch Hello Traders
In This Chart EUR/AUD 4 HOURLY Forex Forecast By FOREX PLANET
today EUR/AUD analysis 👆
🟢This Chart includes_ (EUR/AUD market update)
🟢What is The Next Opportunity on EUR/AUD Market
🟢how to Enter to the Valid Entry With Assurance Profit
This CHART is For Trader's that Want to Improve Their Technical Analysis Skills and Their Trading By Understanding How To Analyze The Market Using Multiple Timeframes and Understanding The Bigger Picture on the Charts

STNG | Inverted H&S Breakout –Target +44% at 65 Major resistance📍 Ticker: NYSE:STNG (Scorpio Tankers Inc. – NYSE)
📆 Timeframe: 1D (Daily)
📉 Price: $45.62
📈 Pattern: Inverted Head & Shoulders + Breakout from Long-Term Falling Resistance
📊 Breakout Probability (estimated): 93% breakout success, 83% to measured target
🔍 Technical Setup:
STNG has completed a confirmed breakout from a textbook Inverted Head and Shoulders pattern, reinforced by a multi-month descending trendline break. This aligns with a multi-technical confluence zone, with the neckline holding as support.
✅ Classic reversal structure
📈 Strong breakout candle with volume > 2x average
🟢 RSI above 64 and no bearish divergence
📐 Measured move projection suggests two major upside targets
📏 Target Projections (from breakout at $41):
🎯 Target Price Return
Target 1 $51.98 +22.5%
Target 2 $65.83 +44.0%
📌 Both targets align with prior horizontal resistance and upper descending trendline intersections
🧠 Trade Plan:
📥 Entry Zone: $44.50 – $46.00 (post-breakout, wait for confirmed structure)
⛔ Stop-Loss (Trailing): Start below $40.00 → trail as price confirms above $48.00
🔁 Partial stop logic: Use under neckline, then adjust dynamically with trend support
📊 Estimated Probabilities:
📐 Pattern: Inverted Head & Shoulders
🔺 Breakout success rate: 93%
🎯 Target met probability: 83%
🔁 Throwback chance: 68% → ideal entry if price retests $41
⚠️ Technical Signals to Monitor:
🔎 Volume remains elevated → confirms institutional interest
✅ RSI trending above 60 → bullish momentum intact
📉 Wide base and upward neckline = higher success probability
📈 Price now in upward sloping channel → bias continues up unless trendline fails
💬 STNG is delivering a clean multi-pattern breakout, backed by volume, RSI confirmation, and a textbook technical structure. If momentum holds, this setup may be one of the highest-probability mid-term swing plays on the NYSE right now.
Follow @TargetTraders for high-probability technical trades
#STNG #TechnicalBreakout #InvertedHeadAndShoulders #PatternTrading #ChartPatterns #NYSEStocks #VolumeBreakout #SwingSetup #BreakoutTrade #SwingTrade #TargetTraders

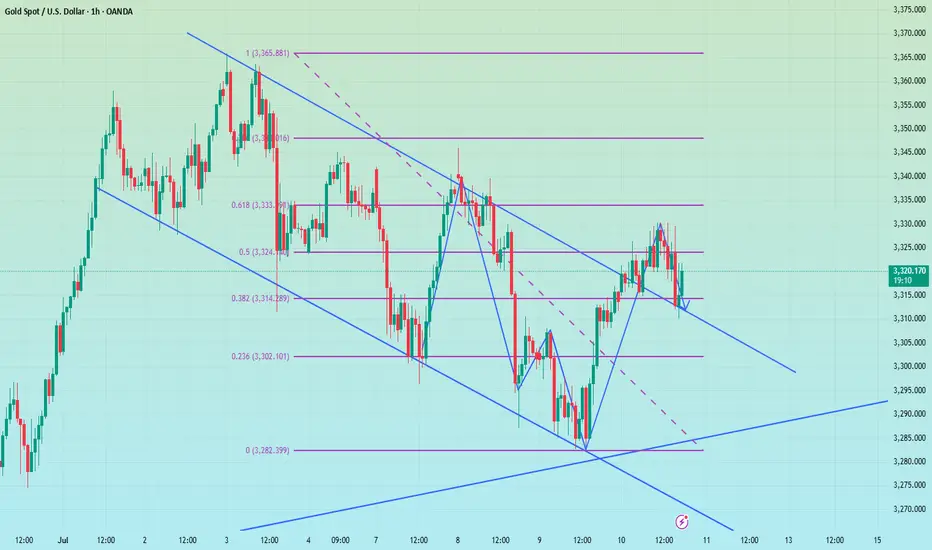
XAUUSD Long 11-07-2028My humble prediction for XAUUSD to go long when it breaks out of the triangle. Buy when it hits the fibonacci level 0.236. Wish me luck!

The GBPCAD is Unstoppable due to Strong Up TrendHello Traders
In This Chart GBPCAD HOURLY Forex Forecast By FOREX PLANET
today GBPCAD analysis 👆
🟢This Chart includes_ (GBPCAD market update)
🟢What is The Next Opportunity on GBPCAD Market
🟢how to Enter to the Valid Entry With Assurance Profit
This CHART is For Trader's that Want to Improve Their Technical Analysis Skills and Their Trading By Understanding How To Analyze The Market Using Multiple Timeframes and Understanding The Bigger Picture on the Chart

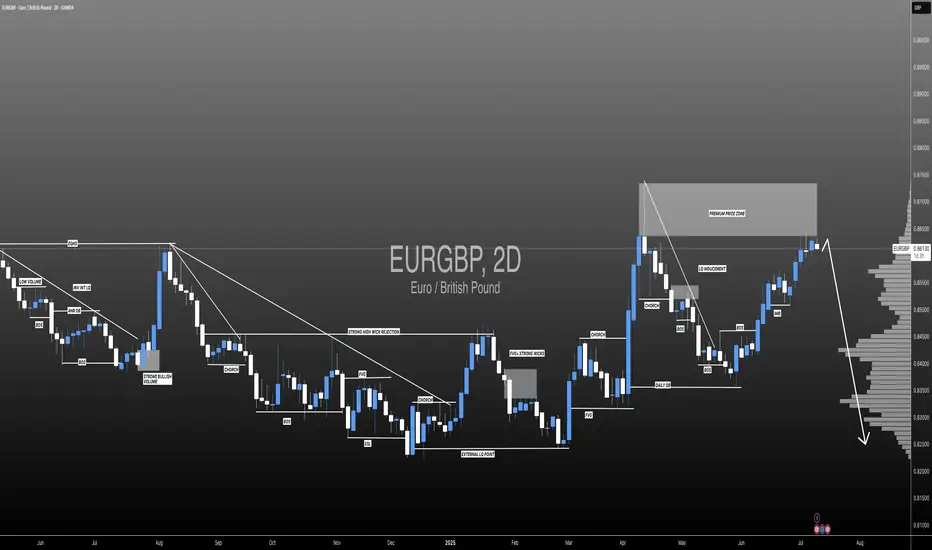
EURGBP: Is This The End Of The Bulls? The GBP/USD pair has exhibited a consistent bullish trend, driven by a remarkable price momentum that is unprecedented in recent history. However, we anticipate a potential bearish reversal, as the market is witnessing a confluence of bearish indicators and increasing volume. Historically, the British pound has held a dominant position in this market, and long-term bears are likely to gain control.
Therefore, it is crucial to closely monitor the incoming market volume and, most importantly, the prevailing market sentiment. Your continued support throughout this journey is greatly appreciated. If you wish to encourage us, kindly like and comment on our ideas.
Team Setupsfx_
❤️❤️🚀🚀
Gold royaltyI am following long diagonal trend line in the chart of GROY. There is some divergence in RSI, and support in the distance from MA. A company with good value and probable triple bottom.
With two new producing royalties from this year growth looks inevitable.
Do your own research!

Empress Royalty – Undervalued Precious Metals Royalty🔹 Fundamental Outlook:
Empress Royalty offers exposure to gold and silver through a diversified portfolio of streaming and royalty agreements, with a focus on earlier-stage producers and developers. Backed by strategic partnerships with Endeavour Financial and Terra Capital, the company leverages deep deal flow and structuring expertise, while keeping overhead lean.
Cash flowing from several active royalties
EV/EBITDA (TTM): ~2.3 – indicating deep value
Free Cash Flow: ~$33M
Float: Only ~43M shares – tightly held
No major debt concerns (cash/debt ratio ~1.44)
The recent appointment of Mark Ashcroft as Business Development Advisor (North America) further boosts Empress’ ability to scale its portfolio with quality assets in the region.
✅ Undervalued vs peers on cash flow and earnings
✅ Royalty model limits operational risk
✅ Exposure to gold and silver (a rare mix)
✅ Insiders and partners with long-standing mining credentials
✅ Benefiting from a rising silver sentiment and the search for non-dilutive capital by small/mid-tier miners
🔹 Risks:
Operator dependency (as a royalty company)
Exposure to early-stage projects with potentially higher execution risk
Thin trading volume at times, which may increase volatility
📈 Conclusion:
Empress Royalty is a fundamentally solid, technically bullish small-cap royalty play. With silver sentiment turning and precious metals investors rotating into high-leverage names, EMPR offers both growth potential and asymmetric reward/risk.

AWX - Breakout from Multi-Year Cup & Handle + JV Deal with FCXArcWest Exploration (TSXV: AWX) just broke out of a 7-year cup & handle formation, hitting C$0.21 with record weekly volume (1.53M).
📉 Long-term downtrend decisively broken
📊 12W SMA (0.114) > 36W SMA (0.098)
☁️ Weekly Ichimoku turns bullish
🔻 Pullback to C$0.185 (-7.5%) may offer entry
🔎 Next resistance zone: C$0.30+
Fundamental trigger:
ArcWest Exploration is a project generator focused on porphyry copper-gold systems in British Columbia, operating under a JV-based model. The company currently has eight 100%-owned projects, several of which are already partnered with major producers.
The recent breakout follows the announcement of a joint venture agreement with Freeport-McMoRan on the Eagle project, where Freeport can earn up to 80% interest by spending C$35M over 10 years, including staged cash payments and a commitment to fund exploration.
This deal marks ArcWest's second major JV partnership, alongside Teck Resources (on the Oxide Peak project), further validating the quality of its portfolio. Both Freeport and Teck are known for targeting large, long-life copper assets, which adds strong institutional backing and long-term exploration potential.
The alignment of technical breakout + institutional interest signals a possible structural re-rating as the market begins to price in multi-asset optionality and tier-1 partnerships.
The chart and fundamentals now align, suggesting multi-year upside potential.
📌 Do your own research before investing!

EURUSD Bearish SMC Setup | Premium Supply Rejection + CHoCH +FVGPair: EUR/USD
Timeframe: 4H
Price reacted strongly from a Premium Selling Zone, forming multiple CHoCH (Change of Character) and BOS (Break of Structure) confirmations.
🔻 Red Zones indicate strong institutional selling
🔺 Weak High is now likely to remain protected
Market structure has shifted bearish, and price is targeting imbalances (IMB) and Fair Value Gaps (FVG) below.
⸻
✅ Entry: Taken from the premium supply rejection
🎯 Target 1: 1.16000 – Minor imbalance fill
🎯 Target 2: 1.15000 – Mid-level demand
🎯 Final Target: 1.14500 – Major liquidity zone
❌ Invalidation: Clean break above 1.18000
⸻
📉 Smart Money Confirmation Setup:
• Premium Supply
• CHoCH
• BOS
• FVG & IMB below
🔄 Missed the entry? Wait for a pullback into lower OB or supply zone.
#EURUSD #SmartMoney #SMC #CHoCH #BOS #FVG #OrderBlock #Forex #LiquiditySweep #SupplyDemand

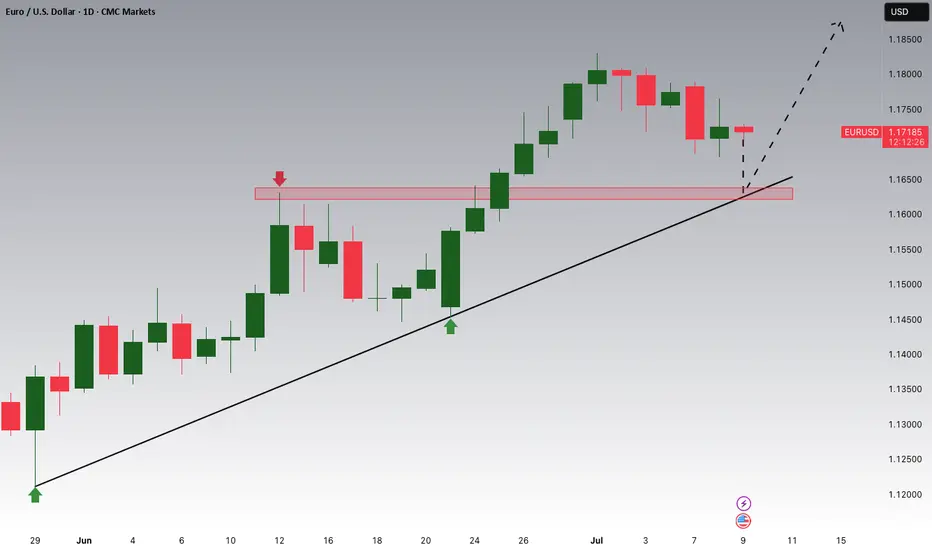
EUR/USD Correction Targets March Uptrend- Support in ViewThe Euro rally exhausted into uptrend resistance into the start of the month with EUR/USD threatening to snap a two-week winning streak at fresh yearly highs. Price has fallen more than 1% from the high and the near-term threat for a larger correction remains below the weekly open at 1.1775.
A break below the weekly opening-range today threatens further declines within this formation with initial support objective seen at the 1.618% extension / 2016 high at 1.1609/16 and the April high at 1.1573. Note that the April trendline converges on this threshold next week and a break / close below this slope would be needed to suggest a more significant high was registered last week / a larger reversal is underway- look for a larger reaction there IF reached. Subsequent support rests with the 23.6% retracement of the yearly range at 1.1440.
Initial resistance is eyed with the 78.6% retracement of the 2021 decline at 1.1748 and is backed closely by the objective weekly / monthly open at 1.1775/87- we’ll reserve this threshold as our bearish invalidation levels with a breach above the upper parallel (currently near ~1.1830s) ultimately needed to mark uptrend resumption. Subsequent resistance eyed at the 100% extension of the 2022 advance at 1.1917 and the 1.618% extension of the January rally at 1.1990.
Bottom line: A reversal off uptrend resistance into the monthly open threatens a larger correction here in EUR/USD. From a trading standpoint, losses should be limited to 1.1573 IF price is heading higher on this stretch with a close above the upper parallel needed to fuel the next major leg of the advance.
-MB

GBP/USD Poised for Fifth Daily Decline- Support in ViewThe Sterling rally failed to close above confluent trend resistance at the 2022 high near 1.3749 with GBP/USD now off more than 1.8% from the monthly / yearly high. The July opening-range seems set here at 1.3530-1.3750 and the focus is on a breakout in the days ahead with the broader outlook still constructive while within this formation.
GBP/USD is testing support today at the 61.8% retracement of the late-June advance at 1.3530 with the weekly opening-range preserved just above. Initial resistance eyed along this short-term channel with breach above the objective weekly open at 1.3645 needed to shift the focus back towards the 2022 high at 1.3749- a daily close above this level is still needed to mark uptrend resumption. Subsequent resistance objective eyed at the 100% extension of the January advance at 1.3816 and the 61.8% extension of the broader 2022 advance at 1.4003.
A break lower exposes key support at the 61.8% retracement of the May rally / 2024 high-day close (HDC) at 1.3388-1.3415. A break / close below this slope would suggest a more significant high was registered last week / a larger reversal is underway with initial support seen at the May low-day close (LDC) at 1.3176.
Bottom line: A reversal from trend resistance threatens a larger correction within the broader GBP/USD uptrend. The immediate focus is on a breakout of the weekly opening-range for guidance. From a trading standpoint, losses would need to be limited to 1.3388 IF Sterling is heading higher on this stretch with a close above 1.3749 ultimately needed to mark uptrend resumption.
-MB

EURUSD is Approaching an Important Support!!Hey Traders, in today's trading session we are monitoring EURUSD for a buying opportunity around 1.16400 zone, EURUSD is trading in an uptrend and currently is in a correction phase in which it is approaching the trend at 1.16400 support and resistance area.
Trade safe, Joe.
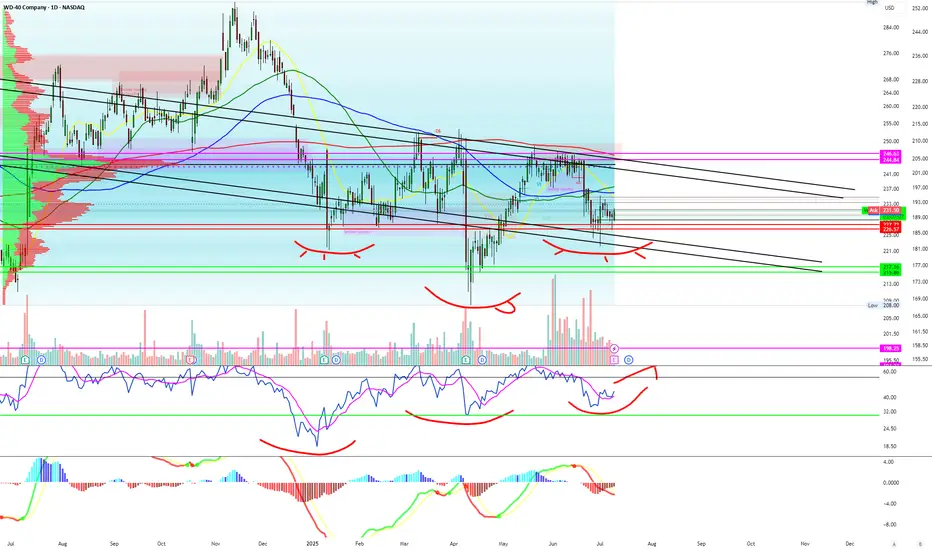
Never thought I'd be bullish WD-40 LMAOAll indicators such as RSI, descending channel pattern and MACD combined with options exposure make me believe earnings will be good in the stock prices eyes.
IWM and small cap stocks are really starting to pop off and nothing is more American then WD-40!!!
Target #1 - $240
Target #2 - $250
$3.48 Is the Line in the Sand—If DOT Holds, Next Stop $4.35DOT/USDT has shifted from a persistent downtrend into an early-stage recovery after forming a clear base near the stronger support area at $3.294. This accumulation zone attracted steady buying interest, eventually fueling a breakout past the previous resistance near $3.531, which has now become a support level.
At present, DOT is trading around $3.688, showing healthy momentum as it approaches the first resistance area. The recent price action demonstrates a breakout–retest structure that typically signals a continuation of bullish sentiment as long as key support levels hold.
The Chaikin Oscillator at the bottom confirms this accumulation phase, with sustained green histogram bars indicating that buying volume is building steadily. The indicator flipped positive before the breakout and continues to support the bias that bulls are in control on this timeframe.
There are two critical resistance zones ahead: the first around $3.974, which marks an interim profit-taking level, and the second near $4.345, a stronger barrier where sellers are likely to appear. If price closes above this higher zone with conviction, it would further confirm that the market has transitioned into a new bullish trend.
Trade Idea (Long Bias)
• Entry: Current area near $3.68 or on a small retracement toward $3.63–$3.60
• Stop-Loss: $3.480, placed just below the weaker support to protect against a deeper reversal
• Target 1 (TP1): $3.974, where partial profits can be secured
• Target 2 (TP2): $4.345, a more ambitious target aligning with the upper resistance
• Reward-to-Risk Ratio: Approximately 3.3, offering a favorable setup
As long as DOT stays above $3.531 and does not violate the $3.480 stop level, this bullish structure remains intact. If the price drops back below $3.480, it would suggest that the breakout has failed, increasing the likelihood of a retest of the accumulation zone around $3.294.
Overall, the combination of structural breakout, retest, and strengthening momentum indicators supports the idea that DOT may continue climbing toward the upper resistance levels over the next several sessions.

Repeated cycle, timing is keyMarket fluctuations are oscillating about 70% of the time, and only about 30% of the time are unilateral upward or downward, so accumulating small victories into big victories is the magic weapon for long-term success. What we need to do is to plan our positions well, and make this investment with a plan, direction, and guidance. A good trader will make your investment journey smoother. How to operate in a volatile market? The ancients said: Do not do good things because they are small, and do not do evil things because they are small. If we move it to financial management, it can be understood as: Don't be too greedy, enter the market in batches. When entering the market and covering positions, the position should be small. Although the profit is less, accumulating small victories into big victories is the key to success. The investment philosophy is composed of the investor's psychology, philosophy, motivation, and technical level. It mainly includes: stability, patience, independent thinking, discipline, trend, etc.
Judging from the current trend of gold, in the 4H cycle, it has touched 3330 many times under pressure, and the K-line has continuously closed with upper shadows, which is quite similar to yesterday's rhythm. So we must first look at the strength of the decline. The support below is at 3314 and 3306. In terms of operation, it should be treated as mainly long and auxiliary short. The upper pressure still focuses on the gains and losses of 3330.

Bark | BARK | Long at $0.84BARK, Inc. NYSE:BARK is a dog-focused company offering subscription-based products like BarkBox and Super Chewer, delivering monthly toys, treats, and pet supplies. It operates in Direct-to-Consumer and Commerce segments, selling through its website, retail partners, and e-commerce platforms. While not overly bullish here, especially given the economic / recession-fear headwinds, I think this is one of those stocks that may have a future "pop" as interest rates are lowered, or news emerges of the company expanding to new retail partners. A few insiders have recently purchased shares (~$75k under $1.00) and others have been awarded options. The book value currently rests near $0.64. It may dip between that price at $0.50 in the near-term. However, that's just been the trajectory of SO many of these SPAC stocks... dip then pop or bust.
Fundamentally, nothing to uproar over and this is a risky investment (Nasdaq delisting may occur). The positive is the debt-to-equity in 0.9x, which is pretty good for a small company. But 2026 is expected to be its worst earnings year. The future may look bright in 2027 and beyond, but can the company last? Time will tell.
Thus, for a swing trade, NYSE:BARK is in a personal buy zone at $0.84 with a risk of further near-term decline between $0.50 and $0.64.
Targets into 2027
$0.95 (+13.1%)
$1.25 (+48.8%)

GTYR at the cusp of breakoutFib 0.236 level from last peak and trend line is the main hurdle. Once it breaks, resistances on pivots and other Fib levels will be the targets.

Night range operation, technical outlook is still bearishGold fell as expected after repeated battles at 3330. Currently, gold has returned to around 3320. This shows that the rebound was mainly driven by short-term risk aversion. As market news calms down and sentiment stabilizes, the market will most likely return to the technical trend. If it unexpectedly breaks through 3330, it is expected to touch the 3345 line I mentioned this morning. The short-term 3310 line currently has certain support. From a technical point of view, I prefer to short. Once it falls below 3310, the subsequent support will move to 3295-3285. Therefore, I think it is a good choice to short again at 3320-3330.
OANDA:XAUUSD
Hasboro | HAS | Long at $66.00Hasboro $NASDAQ:HAS. Bouncing in an out of the historical simple moving average (SMA). While it may take a bit for it to spring out and continue its upward trend, it looks poised to do so. However, there is a small price gap that was never closed in the $40's that investors should stay cautious of if the downward trend continues. But a "confirmation" of a reversal will be either a continued move up or a retest of the lower historical SMA band (to close the recent price gaps) followed by a further move up. Fundamentally, NASDAQ:HAS has a high level of debt, but earnings growth is forecasted in its future. At $66.00, $ NASDAQ:HAS is in a personal buy zone, but patient investors may wish to wait for further confirmation of a reversal.
Target #1 = $73.00
Target #2 = $81.00
Target #3 = $87.00
Target #4 = $119.00 (very long-term...)
