Bitcoin & new rallyBitcoin surpassed its previous all-time high of $112,000 and is now approaching $124,700, the third resistance level for July's pivot.
Trend Lines

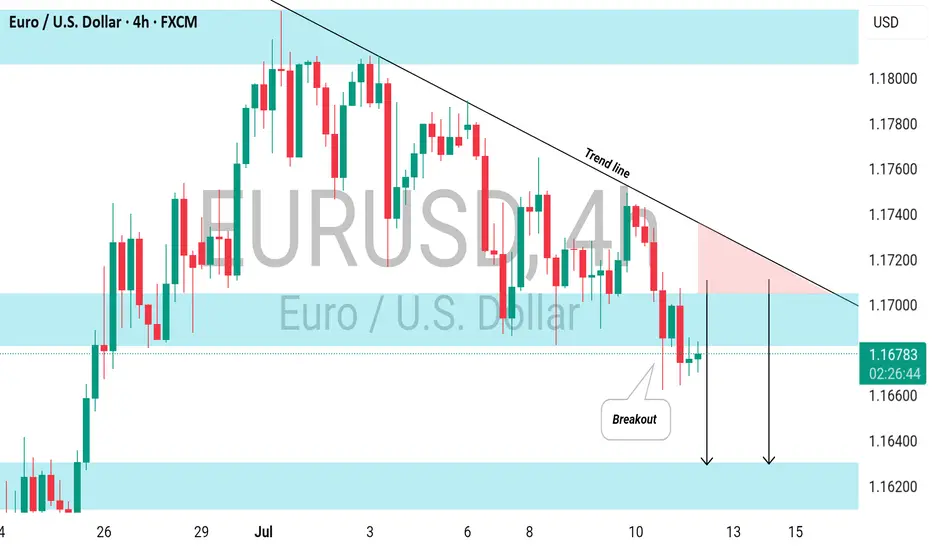
EURUSD: Bearish Continuation Ahead EURUSD is expected to maintain a bearish trend following a confirmed breakout below a significant horizontal support level.
The broken structure, along with a descending trend line, creates a contracting supply zone, indicating a strong likelihood of further downward movement.
The next target is 1.1620 support
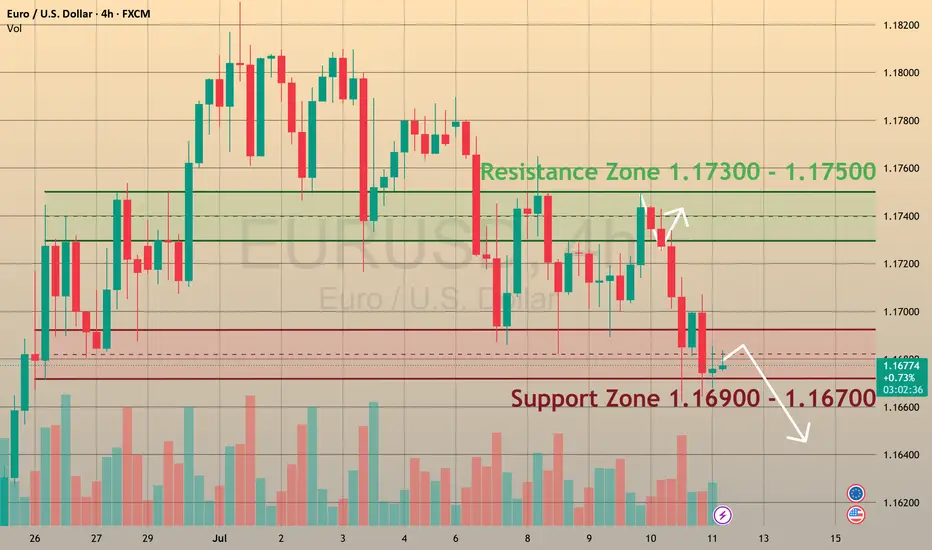
EURUSD is ready to break supportCMCMARKETS:EURUSD
The Euro fell to 1.1670 on Friday, positioning for nearly a 1% weekly loss 📊, as investors recalibrated risk exposure amid escalating trade tensions ⚔️ and shifting monetary policy signals 🏦.
📉 Market Structure:
🔻 EURUSD has traded in a bearish trend since July 1.
🔹 Support levels: 1.1680 and 1.1590.
🔹 Retested the 1.1680 support zone on Friday.
💡 How to Trade This:
✅ If the pair rebounds from support 🔄, consider BUYING with a Take Profit near the next resistance level.
❌ If the support breaks with confirmation 🩻, consider SELLING to target lower support zones.
📰 What’s Driving the Move?
🏦 Monetary Policy:
Chicago Fed President Austan Goolsbee pushed back against calls for aggressive rate cuts 🗣️, reaffirming the Fed’s focus on its dual mandate of maximum employment and price stability ⚖️. His cautious stance adds uncertainty 🤔 to the policy outlook for the second half of the year as markets weigh inflation risks vs. growth slowdown signals.
💼 Economic Data:
The labor market remains solid 💪, but recent jobless claims data show early signs of cooling 🧊, following last week’s strong NFP report.
💵 Dollar Strength:
The dollar advanced sharply against the euro 🚀, driven by risk aversion, relative yield advantages, and investor positioning ahead of upcoming inflation data and the Fed’s next policy signals 📈.
🚨 Watch for:
🔸 A confirmed breakout or rebound at 1.1680 to guide trade entries.
🔸 Upcoming U.S. inflation data 🪙 for direction on Fed policy and USD strength.
🔸 Further developments in trade tensions 🌐, which could drive risk sentiment.
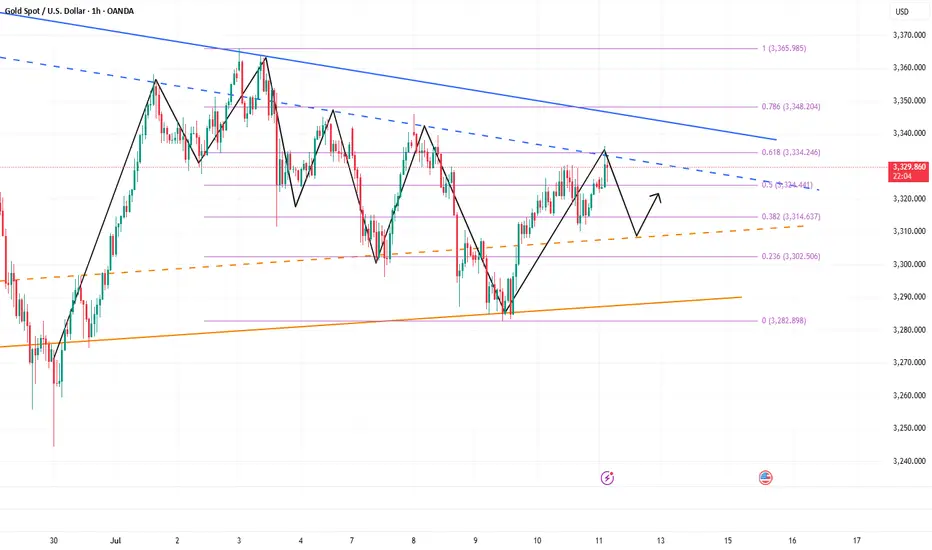
GOLD (XAUUSD): Bullish Trend-Following Movement Ahead! 📈 GOLD shows several bullish signals on the 4H chart.
Initially, the price surpassed and closed above a resistance line of a bullish flag pattern.
Following that, a confirmed Change of Character (CHoCH) took place.
The price appears poised for further growth, with the next resistance level at 3360.

UTK Xmoney: Bullish Reversal in Sight?After a prolonged bearish trend, UTK Xmoney appears to be forming a strong bottom near the $0.03–$0.04 range. The weekly chart suggests that the asset may be entering a new bullish cycle, especially considering the previous historical support and resistance levels.
My projection (green dotted line) envisions a gradual recovery, with UTK breaking through key resistances at $0.13678 and $0.51413, aiming for the $0.73614 region by 2026. This scenario is based on:
Technical Analysis: Multiple rejections of the lower support zone and historical pattern of strong upswings after prolonged accumulation periods.
Market Sentiment: Increasing adoption of Xmoney’s payment solutions, partnerships, and overall crypto market cycles.
Risk Management: If the $0.03940 support fails, downside risk increases significantly.
Trade Idea:
Long-term position from current levels ($0.03–$0.04) targeting $0.73, with partial profit-taking at $0.13 and $0.51. Stop-loss below $0.039.
Disclaimer:
This analysis is for informational purposes only and not financial advice. Always do your own research.

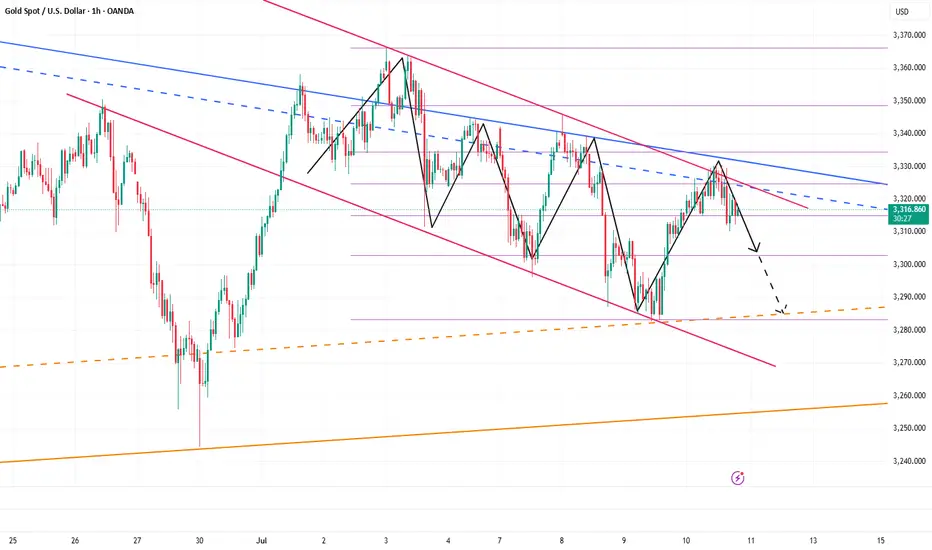
Gold’s Uptrend Is a Mirage,Bears Are Lurking Beneath!Gold has rebounded to around 3336, and seems to have tried to stand above 3335, but it has not stood firm. Therefore, it cannot be considered that the bulls have an advantage just because gold has tried to break through 3335. Recently, I have been reminding everyone that before gold stands above 3335, the bears still have the spare power to dominate the market, so I fully believe that the gold bulls and bears will fight fiercely for control around 3335!
Why do I think it is difficult for gold bulls to have a good performance in the short term? Because since gold fell and touched 3285, it has fallen below many key supports. The market is short-selling. The previous support has become a key resistance under the effect of technical top and bottom conversion, and multiple resistances are concentrated in the 3335-3345-3355 area. Under the suppression of multiple resistances, it is difficult for gold bulls to make any progress in the short term.
So before the resistance is effectively broken, I think any rebound may be an opportunity to short gold, so I will try to find the band top and short gold based on the resistance area, and now I think it is still worth a try to short gold in the 3330-3340 area as originally planned! And look at the target area of 3320-3310
Oxford Industries | OXM | Long at $38.10Oxford Industries NYSE:OXM is an apparel company that designs, sources, markets, and distributes lifestyle brands like Tommy Bahama, Lilly Pulitzer, and Southern Tide. While I am not super bullish on the retail sector given the blaring recession signals, I also don't think this is the end of life as we know it... the anticipated downside is already priced-in for many retail brands.
From a technical analysis perspective, NYSE:OXM has entered my "crash" simple moving average zone. Typically, but not always, this is an area where value investors accumulate shares in anticipation of a future rise in share price. While the price is likely to dip near $28-$30 in the near-term, the last open price gap on the daily chart since the COVID-19 pandemic was closed today. Also, last week, an NYSE:OXM Officer and the CEO bought just over $600,000 in shares near $40 and the stock is currently trading at book value.
Fundamentals:
P/E = 7.4x (apparel sector average = 22.4x)
Forward P/E = 11.4x
Dividend = 7.25%
Debt-to-equity = .2x (healthy)
Regardless of some strong fundamentals, persistent macro volatility, consumer caution, and tariff pressures may delay recovery. Analysts expect flat to declining sales in 2025, with limited organic growth. Like I mentioned above, while there is likely short-term pain here, the fundamentals are there to potentially weather the storm.
Thus, at $38.10, NYSE:OXM is in a personal buy zone with the further decline between $28-$30 likely (where additional share accumulation will occur as long as the fundamentals do not change).
Targets into 2027
$45.00 (+18.0%)
$50.00 (+31.2%)

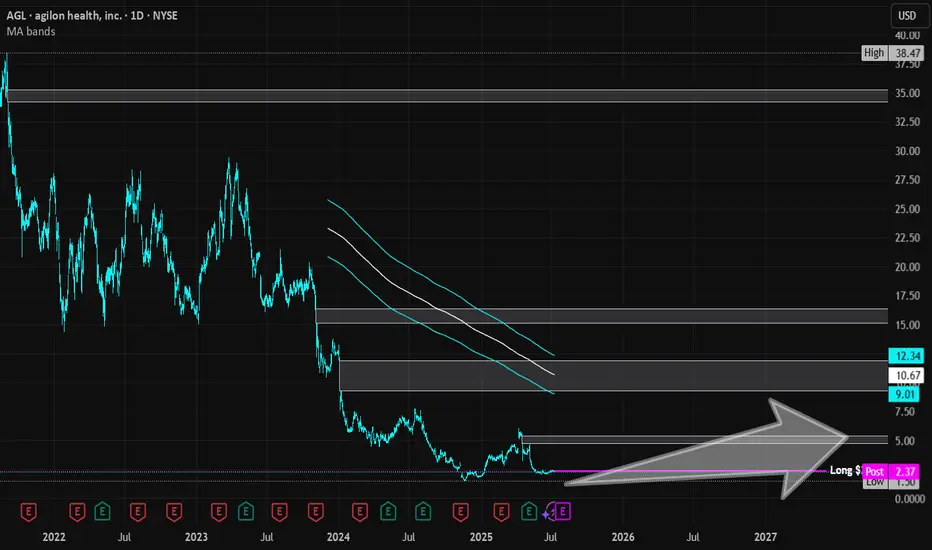
Agilon Health | AGL | Long at $2.36Reentering this trade (original: )
Agilon Health NYSE:AGL
Pros:
Revenue consistently grew from 2019 ($794 million) to 2024 ($6.06 billion). Expected to reach $9.16 billion by 2028.
Current debt-to-equity ratio 0.07 (very low)
Sufficient cash reserves to fund operations and strategic initiatives
Strong membership growth (659,000 in 2024, a 38% year-over-year increase)
Recent insider buying ($2 - $3) and awarding of options
Cons:
Rising medical costs - currently unprofitable and not forecast to become profitable over the next 3 years
Medicare Advantage Membership issues with the new political administration
No dividend
It's a gamble and I think it's a possibility this could drop near $1 in the near-term due to the Medicaid changes/fear... regardless, long-term, personal buy-zone at $2.36.
Targets in 2027
$3.70 (+56.8%)
$5.25 (+122.5%)
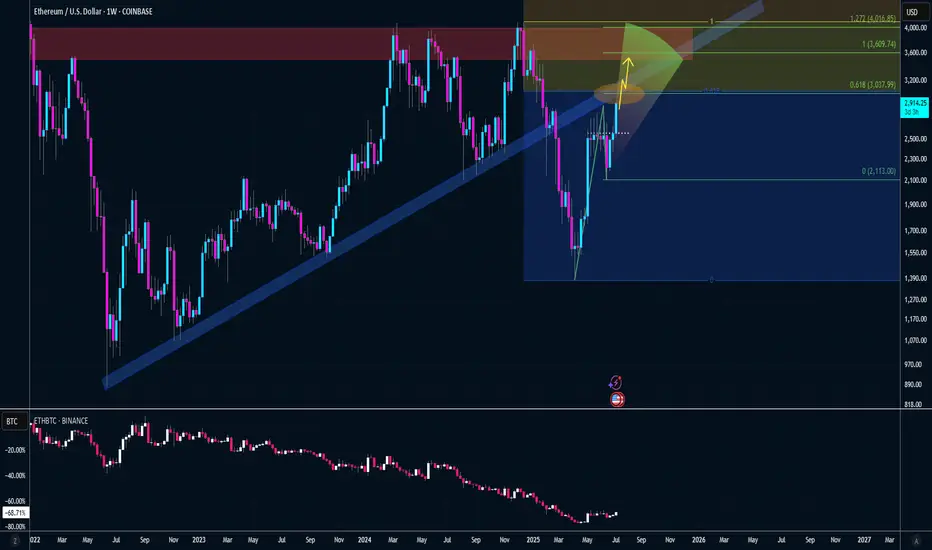
ETH - Back at the Level Everyone Forgot.Everyone’s watching ETH pump right now like it’s something new. It’s not. Look closer:
This is a look back in time to the breakdown that started to slide in Jan 2025.
That clean base around $3300 was holding for months in late 2024. It failed in January Q1, dragged us to sub-$2K by March, but now we’re right back under it.
This isn’t a random pump, it’s ETH revisiting the exact area it broke down from.
• White line = previous floor that gave out
• Dotted line = current price climbing back up into that structure
A move above $2960–$3300 flips the entire structure from resistance to reclaimed floor.
Market memory’s short, but price tends to remember everything.

Gold has a big win this dayNews: In the early Asian session on Thursday (July 10), spot gold fluctuated slightly higher, once regaining the 3320 mark, and is currently trading around $3323/ounce. On Wednesday, gold prices rebounded strongly after hitting a two-week low of 3282.61, closing at $3313.38/ounce, showing strong momentum for recovery. Trump extended the tariff agreement to August 1 and began to collect tariffs again. Although it eased market tensions, his remarks will not be extended after the expiration, and he issued tariff threats, which increased global trade uncertainty and pushed up risk aversion. The market is still facing economic and inflation concerns brought about by tariffs, which will also weaken the dollar and support gold prices.
Analysis of gold trend: After the full-day trend of gold on Wednesday, the lowest price was 3282 and the highest price was 3322, with a range of $40, so the bullish strength has come out. However, Li Siyu would like to emphasize here that gold is in a bullish trend for the time being, but it is not an absolute unilateral trend, but a fluctuating trend under the bullish trend. There are opportunities both up and down on Thursday. If it rises, you can look at 3345, and if it falls, you can look at 3285. Therefore, before there is an absolute strong unilateral rise, it is recommended that everyone keep looking at this wave of gold fluctuations. However, today's market is more important. Today is Thursday, and Thursday is often the node of the weekly change time. Today is likely to continue the rebound on Wednesday and continue to rise.
From a technical point of view, the daily line closed positive under the rebound of 3282 and stood firmly above the lower Bollinger track. If it continues to close positive on Thursday, it is necessary to pay attention to the suppression of the middle Bollinger track, that is, the high point of 3345. After breaking through, there will be another wave of rise on Friday, and you can see 3365 and 3400. Therefore, today's gains and losses of 3345 are crucial. The strong rebound in the H4 cycle is quite obvious. When it falls, it is very weak and continuous. When it rises, it is very strong and continuous. It depends on whether the continuous positive trend on Thursday will continue. Now the K-line stands firmly on the middle track of Bollinger. If it continues to rise, the high point of the upper track is around 3340-3345. In principle, the continuation of the long position will test the high point of the upper track. Therefore, it is still possible to go long today. Of course, it is not an absolute long trend now, so don't chase the rise. The support below the small cycle is around 3310-3300. If it falls back to this price, you can continue to go long. Clearly define the target. Today, we will see the gains and losses of 3345.

Gold is in the Bearish DirectionHello Traders
In This Chart GOLD HOURLY Forex Forecast By FOREX PLANET
today Gold analysis 👆
🟢This Chart includes_ (GOLD market update)
🟢What is The Next Opportunity on GOLD Market
🟢how to Enter to the Valid Entry With Assurance Profit
This CHART is For Trader's that Want to Improve Their Technical Analysis Skills and Their Trading By Understanding How To Analyze The Market Using Multiple Timeframes and Understanding The Bigger Picture on the Charts

The GBPCAD is Unstoppable due to Strong Up TrendHello Traders
In This Chart GBPCAD HOURLY Forex Forecast By FOREX PLANET
today GBPCAD analysis 👆
🟢This Chart includes_ (GBPCAD market update)
🟢What is The Next Opportunity on GBPCAD Market
🟢how to Enter to the Valid Entry With Assurance Profit
This CHART is For Trader's that Want to Improve Their Technical Analysis Skills and Their Trading By Understanding How To Analyze The Market Using Multiple Timeframes and Understanding The Bigger Picture on the Chart

Gold is in the bullish direction after correcting the supportHello Traders
In This Chart GOLD HOURLY Forex Forecast By FOREX PLANET
today Gold analysis 👆
🟢This Chart includes_ (GOLD market update)
🟢What is The Next Opportunity on GOLD Market
🟢how to Enter to the Valid Entry With Assurance Profit
This CHART is For Trader's that Want to Improve Their Technical Analysis Skills and Their Trading By Understanding How To Analyze The Market Using Multiple Timeframes and Understanding The Bigger Picture on the Charts

GBPJPY is in the Down Trend From Resistance LevelHello Traders
In This Chart GBPJPY HOURLY Forex Forecast By FOREX PLANET
today GBPJPY analysis 👆
🟢This Chart includes_ (GBPJPY market update)
🟢What is The Next Opportunity on GBPJPY Market
🟢how to Enter to the Valid Entry With Assurance Profit
This CHART is For Trader's that Want to Improve Their Technical Analysis Skills and Their Trading By Understanding How To Analyze The Market Using Multiple Timeframes and Understanding The Bigger Picture on the Charts

Gold is in the Bearish DirectionHello Traders
In This Chart GOLD HOURLY Forex Forecast By FOREX PLANET
today Gold analysis 👆
🟢This Chart includes_ (GOLD market update)
🟢What is The Next Opportunity on GOLD Market
🟢how to Enter to the Valid Entry With Assurance Profit
This CHART is For Trader's that Want to Improve Their Technical Analysis Skills and Their Trading By Understanding How To Analyze The Market Using Multiple Timeframes and Understanding The Bigger Picture on the Charts

EURUSD is in a Downside DirectionHello Traders
In This Chart EURUSD HOURLY Forex Forecast By FOREX PLANET
today EURUSD analysis 👆
🟢This Chart includes_ (EURUSD market update)
🟢What is The Next Opportunity on EURUSD Market
🟢how to Enter to the Valid Entry With Assurance Profit
This CHART is For Trader's that Want to Improve Their Technical Analysis Skills and Their Trading By Understanding How To Analyze The Market Using Multiple Timeframes and Understanding The Bigger Picture on the Charts

GBPJPY is Holding above the SupportHello Traders
In This Chart GBPJPY HOURLY Forex Forecast By FOREX PLANET
today GBPJPY analysis 👆
🟢This Chart includes_ (GBPJPY market update)
🟢What is The Next Opportunity on GBPJPY Market
🟢how to Enter to the Valid Entry With Assurance Profit
This CHART is For Trader's that Want to Improve Their Technical Analysis Skills and Their Trading By Understanding How To Analyze The Market Using Multiple Timeframes and Understanding The Bigger Picture on the Charts

EURNZD is in the downtrend after breaking TrendlineHello Traders
In This Chart EURNZD 4 HOURLY Forex Forecast By FOREX PLANET
today EURNZD analysis 👆
🟢This Chart includes EURNZD market update)
🟢What is The Next Opportunity on EURNZD Market
🟢how to Enter to the Valid Entry With Assurance Profit
This CHART is For Trader's that Want to Improve Their Technical Analysis Skills and Their Trading By Understanding How To Analyze The Market Using Multiple Timeframes and Understanding The Bigger Picture on the Charts

EURUSD Technical Analysis**Chart Overview:**
* **Pair:** EUR/USD
* **Timeframe:** 30-minute
* **Trend:** Bearish (Confirmed by lower highs, lower lows, and downward-sloping trendline)
---
🔍 **Technical Analysis :**
**1. Downtrend Structure**
* Price is consistently making **lower highs and lower lows**, confirming a **strong downtrend**.
* A clear **descending trendline** is respected multiple times as resistance.
**2. EMAs (7, 21, 50)**
* All EMAs (blue, purple, black) are sloping downward.
* Price is trading **below all EMAs**, signaling continued bearish momentum.
* EMA 50 (\~1.1716) acts as a **dynamic resistance** zone.
**3. Key Resistance Zones (Marked as R1 & R2)**
* **R1 Zone (\~1.1710–1.1720):** Previous support now turned resistance. Could see rejection here.
**R2 Zone (\~1.1730+):** Higher resistance, possibly tested if R1 breaks. Also aligns with EMA confluence.
**4. Volume Analysis**
* Volume shows **spikes on bearish candles**, which suggests **strong selling interest** at lower highs.
* No significant bullish volume breakout so far.
📈 **Price Projection Path (Red Arrows)**
* The red path illustrates a **bearish price projection**:
* Price may pull back into **R1 or R2**
* Likely to face **resistance & rejection** from those levels
* Expected to make **lower highs and resume downside movement**
* Potential drop toward **1.1670, 1.1650, and lower**
🟢 **Bullish Invalidator**
* If price **breaks and holds above R2 (\~1.1735+)** with volume, it may indicate a **trend reversal or bullish correction**.
---
**Summary:**
* **Bias:** Bearish
* **Resistance Zones to Watch:**
* R1: 1.1710–1.1720
* R2: 1.1730–1.1740
* **Targets on Downside:**
* 1.1670
* 1.1650 or lower
* **Confirmation Needed:** Bearish rejection candles or failure to break R1/R2

GO LONG ETH BEFORE "CRYPTO WEEK"Next week is "Crypto Week" in the U.S. House of Representatives. The House will consider the CLARITY Act, the Anti-CBDC Surveillance State Act, and the GENIUS Act.
Bill Helps Ethereum By...
CLARITY Act Protecting decentralized infrastructure from U.S. blacklists
Anti-CBDC Act Preserving demand for decentralized stablecoins, defending privacy
GENIUS Act Encouraging gov use of public blockchains like Ethereum
Golden Trap: Bulls Exhausted, Bears Ready to StrikeToday, the gold market is in a stalemate between long and short positions, with the market fluctuating sideways for a long time and maintaining an overall volatile trend. Although the rebound of gold has won a respite for the bulls, the rebound of gold during the day is not enough to completely reverse the decline. I think that before the 3325-3335 area is stabilized, the bears still have spare power to dominate the market!
According to the current structure, although gold rebounded again after touching 3310 during the retracement, it has retreated many times during the rebound. The candle chart is interspersed with obvious negative candle charts, indicating that the rebound strength is weak. In the short term, it is under pressure in the 3330-3340 area, and it is difficult to break through in a short time.
So I think the role of the gold rebound may be to trap more buyers, so we try not to chase gold after the rebound. The area near 3310 is not a key support in the short term. 3305-3300 is the current key support area. Once the bears regain control of the situation, gold may test the 3305-3300 area again. Once it falls below the reformed area, it may test 3280 again, or even refresh the recent low to around 3270.
So the downward potential of gold is not over yet. We can still look for opportunities to short gold in the 3325-3335 area and look at the target 3305-3295 area.
SOLB | Confirmed Descending Triangle Breakout – 32% Target📍 Ticker:
SOLB (Solvay SA – Euronext Brussels)
📆 Timeframe: 1D (Daily)
📉 Price: €30.14
📈 Pattern: Descending triangle breakout confirmed on daily close
📊 Breakout Probability estimation: ~73% (short-term triangle breakout upward)
🔍 Technical Setup (Updated on Daily Chart):
Solvay has now confirmed the breakout on the daily timeframe, closing above both the horizontal support and the descending trendline. This marks a multi-timeframe confluence breakout, increasing confidence in the projected move toward upper resistance levels.
✅ Daily candle close above descending resistance
✅ RSI breakout above 55, building momentum
📉 Stop clearly defined under €27.90 → optimal risk profile
📊 Volume expanding, validating move
🧠 Updated Trade Plan:
📥 Entry Zone: €29.90–€30.50 (daily confirmation)
⛔ Stop-Loss: Below €27.90
🔁 Hold while structure remains above descending trendline support
🎯 Upside Targets & Potential Return (from €30.14)
🎯 Target Price Return
Target 1 €33.84 +12.06%
Target 2 €39.76 +32.21%
📊 Pattern Probability – Daily Structure:
📐 Pattern: Descending Triangle Breakout
🔺 Upward breakout probability: ~73%
🎯 Full measured move supports Target 2 if buyers remain active
⚠️ Technical Signals to Watch:
🔎 Retest of descending line on lower volume = strong
✅ RSI > 55 with bullish structure
📈 Rising volume → growing institutional interest
📊 Price reclaiming structure from broader daily consolidation
💬 Solvay is transitioning from a textbook 4H breakout to a multi-day continuation setup. The alignment of pattern, structure, and momentum makes this one of the cleaner swing setups on the European market right now.
🔔 Follow @TargetTraders for high-probability technical trades.
#SOLB #BreakoutSetup #DescendingTriangle #TechnicalPattern #SwingTrade #Euronext #TargetTraders #VolumeBreakout #ChartAnalysis

More Upside in Wheaton Precious Metals? Wheaton Precious Metals has consolidated for more than a month, and some traders may think it’s poised to continue higher.
The first pattern on today’s chart is the April 21 high of $87.42. The silver company stayed below that level through June 2. It then shot above it and held the same price over the following month. That could suggest old resistance has become new support.
Second, WPM appears to have broken a falling trendline.
Third, the 8-day exponential moving average (EMA) has stayed above the 21-day EMA. That may reflect a bullish short-term trend.
Finally, Bollinger Band Width in the lower study highlights tighter movement. Will that price compression give way to price expansion?
Check out TradingView's The Leap competition sponsored by TradeStation.
TradeStation has, for decades, advanced the trading industry, providing access to stocks, options and futures. If you're born to trade, we could be for you. See our Overview for more.
Past performance, whether actual or indicated by historical tests of strategies, is no guarantee of future performance or success. There is a possibility that you may sustain a loss equal to or greater than your entire investment regardless of which asset class you trade (equities, options or futures); therefore, you should not invest or risk money that you cannot afford to lose. Online trading is not suitable for all investors. View the document titled Characteristics and Risks of Standardized Options at www.TradeStation.com . Before trading any asset class, customers must read the relevant risk disclosure statements on www.TradeStation.com . System access and trade placement and execution may be delayed or fail due to market volatility and volume, quote delays, system and software errors, Internet traffic, outages and other factors.
Securities and futures trading is offered to self-directed customers by TradeStation Securities, Inc., a broker-dealer registered with the Securities and Exchange Commission and a futures commission merchant licensed with the Commodity Futures Trading Commission). TradeStation Securities is a member of the Financial Industry Regulatory Authority, the National Futures Association, and a number of exchanges.
TradeStation Securities, Inc. and TradeStation Technologies, Inc. are each wholly owned subsidiaries of TradeStation Group, Inc., both operating, and providing products and services, under the TradeStation brand and trademark. When applying for, or purchasing, accounts, subscriptions, products and services, it is important that you know which company you will be dealing with. Visit www.TradeStation.com for further important information explaining what this means.
