Bark | BARK | Long at $0.84BARK, Inc. NYSE:BARK is a dog-focused company offering subscription-based products like BarkBox and Super Chewer, delivering monthly toys, treats, and pet supplies. It operates in Direct-to-Consumer and Commerce segments, selling through its website, retail partners, and e-commerce platforms. While not overly bullish here, especially given the economic / recession-fear headwinds, I think this is one of those stocks that may have a future "pop" as interest rates are lowered, or news emerges of the company expanding to new retail partners. A few insiders have recently purchased shares (~$75k under $1.00) and others have been awarded options. The book value currently rests near $0.64. It may dip between that price at $0.50 in the near-term. However, that's just been the trajectory of SO many of these SPAC stocks... dip then pop or bust.
Fundamentally, nothing to uproar over and this is a risky investment (Nasdaq delisting may occur). The positive is the debt-to-equity in 0.9x, which is pretty good for a small company. But 2026 is expected to be its worst earnings year. The future may look bright in 2027 and beyond, but can the company last? Time will tell.
Thus, for a swing trade, NYSE:BARK is in a personal buy zone at $0.84 with a risk of further near-term decline between $0.50 and $0.64.
Targets into 2027
$0.95 (+13.1%)
$1.25 (+48.8%)
Trend Lines

GTYR at the cusp of breakoutFib 0.236 level from last peak and trend line is the main hurdle. Once it breaks, resistances on pivots and other Fib levels will be the targets.

Night range operation, technical outlook is still bearishGold fell as expected after repeated battles at 3330. Currently, gold has returned to around 3320. This shows that the rebound was mainly driven by short-term risk aversion. As market news calms down and sentiment stabilizes, the market will most likely return to the technical trend. If it unexpectedly breaks through 3330, it is expected to touch the 3345 line I mentioned this morning. The short-term 3310 line currently has certain support. From a technical point of view, I prefer to short. Once it falls below 3310, the subsequent support will move to 3295-3285. Therefore, I think it is a good choice to short again at 3320-3330.
OANDA:XAUUSD
Hasboro | HAS | Long at $66.00Hasboro $NASDAQ:HAS. Bouncing in an out of the historical simple moving average (SMA). While it may take a bit for it to spring out and continue its upward trend, it looks poised to do so. However, there is a small price gap that was never closed in the $40's that investors should stay cautious of if the downward trend continues. But a "confirmation" of a reversal will be either a continued move up or a retest of the lower historical SMA band (to close the recent price gaps) followed by a further move up. Fundamentally, NASDAQ:HAS has a high level of debt, but earnings growth is forecasted in its future. At $66.00, $ NASDAQ:HAS is in a personal buy zone, but patient investors may wish to wait for further confirmation of a reversal.
Target #1 = $73.00
Target #2 = $81.00
Target #3 = $87.00
Target #4 = $119.00 (very long-term...)

Figs Inc | FIGS | Long at $5.24Figs Inc $NYSE:FIGS. Technical analysis play first, fundamentals second.
My selected historical simple moving average lines have converged with the stock price, which often leads to sideways trading and a reversal in the downward trend (i.e. future price increase). The downward trend is flattening, but that doesn't mean post-earnings drop to $1.50-$2.00 isn't out of the question...
The FIGS brand is growing within the healthcare world with significant opportunities overseas. While economic headwinds may impede near/medium-term growth, revenue is anticipated to grow into 2027. EPS is expected to rise from 0.01 in 2024 to 0.20 by 2027. While this is not a "value" play and there is high risk for rug pulls, something may be brewing within the chart for a move up. Tread lightly, however...
Targets
$6.00
$6.40
$7.00
$8.00

Applied Materials | AMAT | Long at $169.75Republican Ashley Moody recently dropped $200k-$500k on Applied Materials $NASDAQ:AMAT. The semiconductor boom may not be over...
Price-to-earnings: 21.68x (great in comparison to others...)
Debt-to-equity: 0.34x (low)
Cash flow: $10.4 billion (FY2024)
Insiders awarded options recently
Unless NASDAQ:NVDA brings the market down, NASDAQ:AMAT is in a personal buy zone at $169.75. While the price may dip in the near-term to the $140s, bullish until the semi boom dies...
Targets:
$195.00
$215.00
$240.00

EURUSD Below 1.1745 – Bearish Bias in PlayFX:EURUSD Technical Outlook
EURUSD maintains bearish momentum as long as the price remains below 1.1745, with a near-term target at 1.1684.
A confirmed breakout above 1.1745 would shift the trend to bullish, opening the path toward 1.1808 and 1.1883.
On the downside, a 1H or 4H candle close below 1.1684 would reinforce the bearish trend, likely extending losses toward 1.1627, and possibly 1.1557.
Support: 1.1684 / 1.1627 / 1.1557
Resistance: 1.1808 / 1.1883

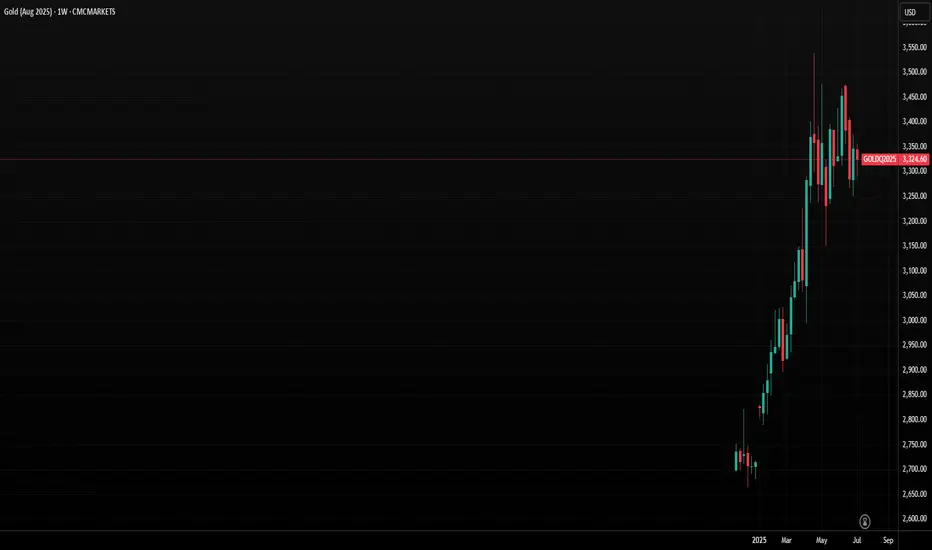
Gold at Critical Juncture as Bearish Momentum GrowsGold is showing signs of breaking down as the US dollar recovers from a steep decline. Gold and the dollar typically have an inverse relationship over the longer term. The precious metal has been trading sideways since April, but more importantly, it has been trending lower since mid-June. Gold is now approaching a critical juncture, testing an uptrend established in mid-May. Although it has previously held this support level, gold appears likely to break lower this time.
The Trend Lower Is Strengthening
The Relative Strength Index (RSI) is now trending steadily lower, forming a series of lower highs. This suggests that gold’s momentum is currently bearish, indicating potential for continued weakness in the days ahead. To reverse this bearish momentum and shift to a bullish outlook, the RSI would need to rise firmly above 50.
More significantly, gold is now very close to breaking a significant uptrend at $3,300, which was previously tested on June 27 and June 30. On both occasions, the price dipped intraday below this trendline but managed to close above it. The trendline was retested on 8 July, initially holding, but gold is dipping below this critical support level again on 9 July. A close below the trendline on July 9, followed by continued declines starting on July 10, would confirm that the uptrend has broken. This breakdown would signal further downside risk, with initial support at $3,230, followed by $3,170.
Triple Top
Perhaps even more crucially, a triple-top pattern established at the $3,400 becomes increasingly likely each time gold trends lower. The $3,170 support level is particularly significant because it forms the neckline of this triple-top pattern. A decisive break below $3,170 would confirm the triple top pattern and indicate a deeper decline, potentially targeting the range between $2,950 and $3,000.
Written by Michael J. Kramer, founder of Mott Capital Management.
Disclaimer: CMC Markets is an execution-only service provider. The material (whether or not it states any opinions) is for general information purposes only and does not take into account your personal circumstances or objectives. Nothing in this material is (or should be considered to be) financial, investment or other advice on which reliance should be placed.
No opinion given in the material constitutes a recommendation by CMC Markets or the author that any particular investment, security, transaction, or investment strategy is suitable for any specific person. The material has not been prepared in accordance with legal requirements designed to promote the independence of investment research. Although we are not specifically prevented from dealing before providing this material, we do not seek to take advantage of the material prior to its dissemination.
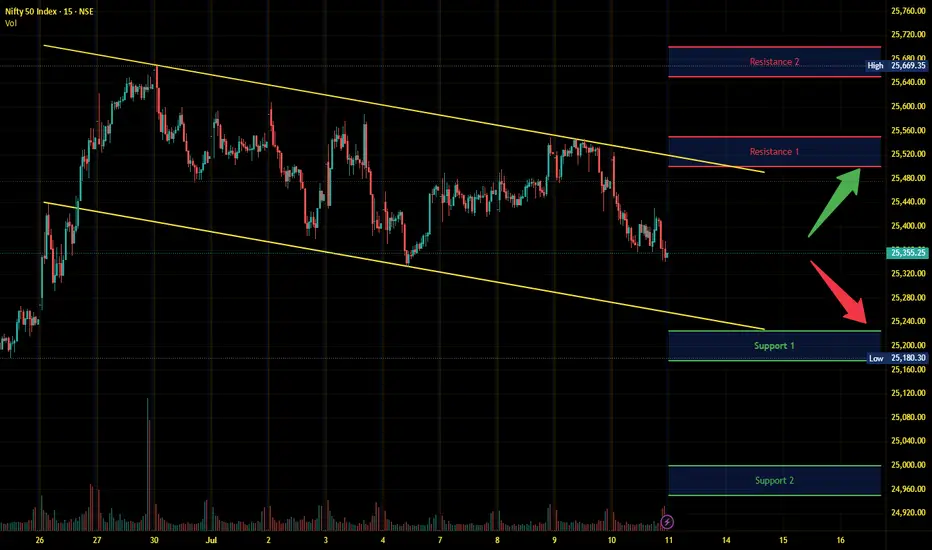
Nifty Intraday Analysis for 11th July 2025NSE:NIFTY
Index has resistance near 25500 – 25550 range and if index crosses and sustains above this level then may reach near 25650 – 25700 range.
Nifty has immediate support near 25225 – 25175 range and if this support is broken then index may tank near 25000 – 24950 range.
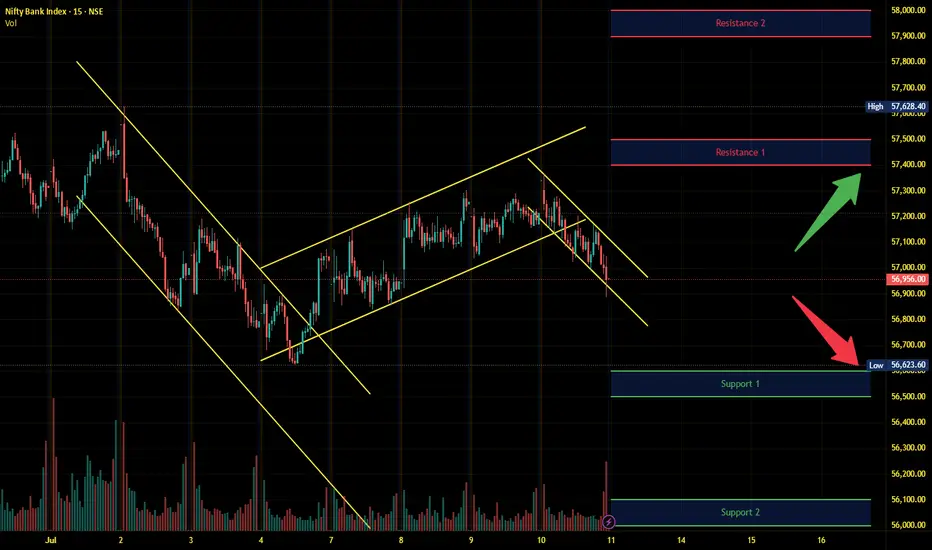
Banknifty Intraday Analysis for 11th July 2025NSE:BANKNIFTY
Index has resistance near 57400 – 57500 range and if index crosses and sustains above this level then may reach near 57900 – 58000 range.
Banknifty has immediate support near 56600 - 56500 range and if this support is broken then index may tank near 56100 - 56000 range.
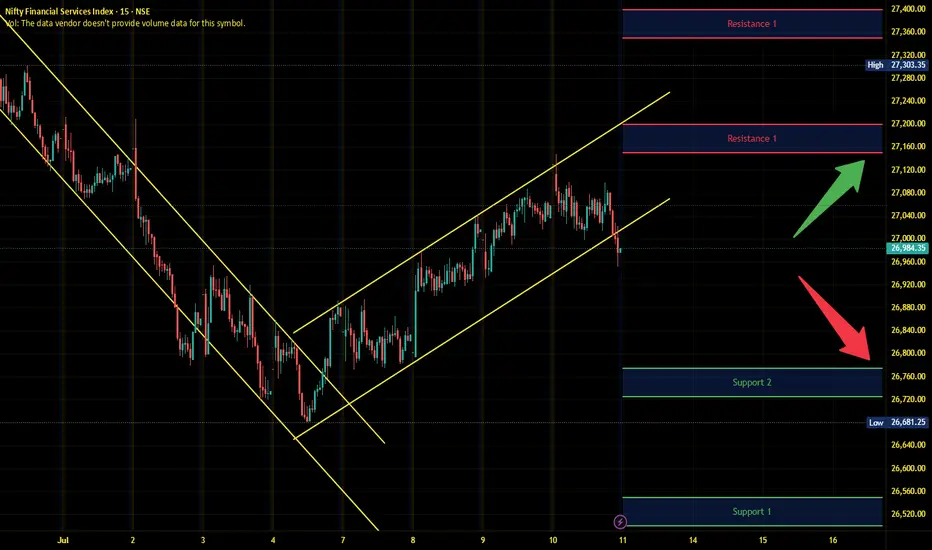
Finnifty Intraday Analysis for 11th July 2025NSE:CNXFINANCE
Index has resistance near 27150 - 27200 range and if index crosses and sustains above this level then may reach near 27350 - 27400 range.
Finnifty has immediate support near 26775 – 26725 range and if this support is broken then index may tank near 266550 – 26500 range.
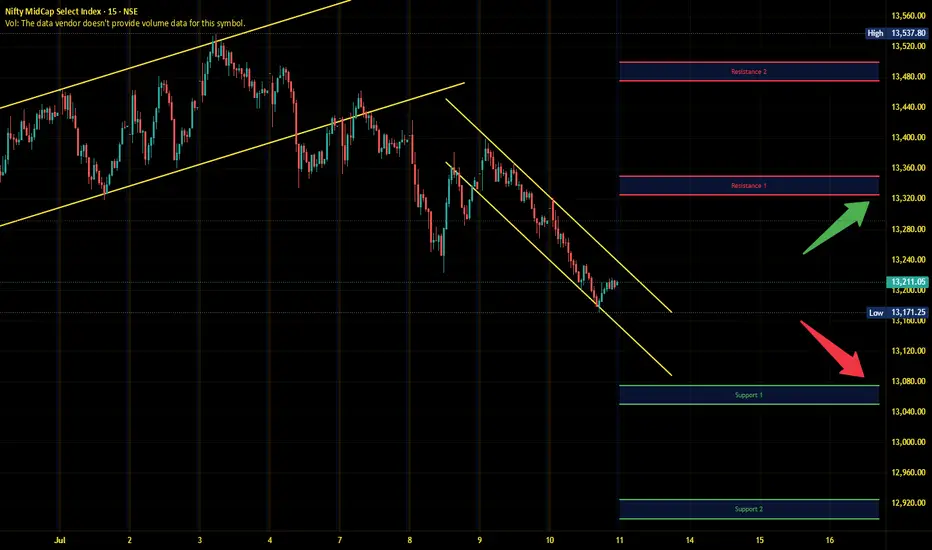
Midnifty Intraday Analysis for 11th July 2025NSE:NIFTY_MID_SELECT
Index has immediate resistance near 13325 – 13350 range and if index crosses and sustains above this level then may reach 13475 – 13500 range.
Midnifty has immediate support near 13075 – 13050 range and if this support is broken then index may tank near 12925 – 12900 range.
Bearish is still the main trend, first test 3250 supportYesterday, as the market expected a trade agreement to be reached between the US and its trading partners, risk sentiment was boosted. The strengthening of DXY and the rise in US Treasury yields put some pressure on gold.
On Monday, gold rebounded to 3320, and on Tuesday it touched above 3320 and began to fall sharply. In the short term, 3320 is a key trading position that we need to pay attention to. From the daily chart, the support line of 3320 has been completely broken, and the two major support points below are 3250 and 3200 respectively. Judging from the 4H chart, the decline may have just begun. Next, we may first face a test of the 3250 support line. If the 3250 support can be maintained, gold will maintain a volatile consolidation in the short term. Otherwise, if it falls below 3250, it will test the 3200 mark.
OANDA:XAUUSD
Gold Eyes 3365 as Tariff Tensions Support Bullish MomentumGOLD OVERVIEW
Gold extended gains to around $3,329 amid a weaker dollar and ongoing tariff tensions, with markets reacting to new U.S. trade actions and divided Fed minutes on rate cuts.
Technical Outlook:
Gold remains bullish while above 3320.
A 1H close above 3342 opens the door to 3365.
A 1H close below 3314 will turn sentiment bearish toward 3297 and potentially 3282.
Resistance: 3330, 3342, 3365
Support: 3309, 3297, 3282

Gold fluctuates, continue to short at 3345 during the dayTrump's trade policy continues to stimulate risk aversion. Although the Federal Reserve's meeting minutes are neutral, they can potentially provide support for gold. Yesterday we gave the short positions of 3321 and 3333, which have generated profits so far. At the same time, it should be noted that the 4H MACD indicator has the potential demand to form a golden cross. In the short term, there is a certain suppression force at 3330-3335. If the Asian and European sessions repeatedly test this position but fail to break through effectively, you can go short without hesitation. If you want to go short again during the day, you can consider 3340-3345 and defend 3350. The lower 3310-3305 is a relatively strong support area during the day. If the Asian session retreats to this point, you can consider going long, with the target looking at 3330-3335.
OANDA:XAUUSD
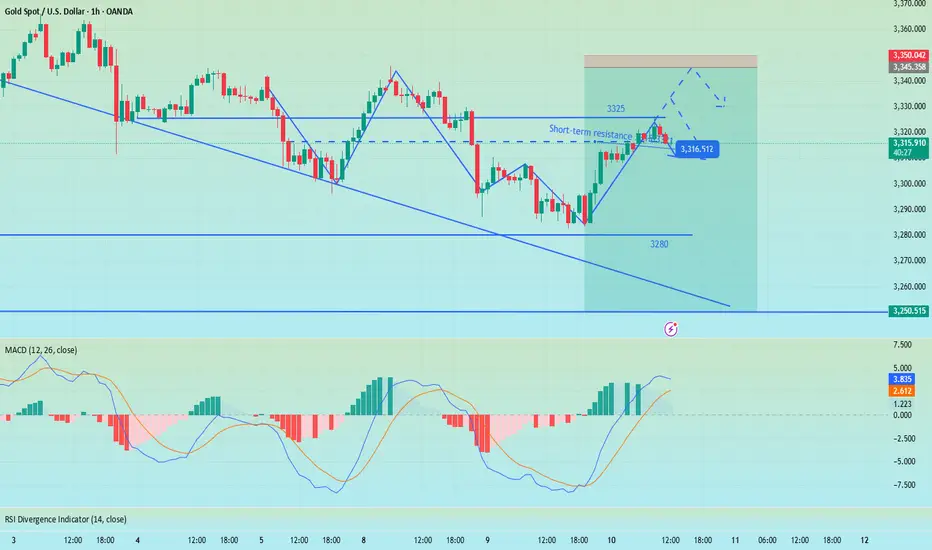
Perfect prediction, pay attention to the high short entry pointTrump extended the tariff agreement to August 1 and began to collect tariffs again. Although it eased market tensions, his remarks will not be extended after the expiration, and he issued a tariff threat, which increased global trade uncertainty and pushed up risk aversion. There was no clear direction coming out of the Fed's meeting minutes last night, but the potential bias was bullish.
At the beginning of the Asian session this morning, I also indicated that gold would rise and then fall. At present, it has reached the highest point near 3325 and then began to retreat, but the 4H golden cross has just been formed. There is still a certain pressure above 3333. If the gold price repeatedly competes for this position, we can continue to short without hesitation. The second short position today is near 3340-3345. There is potential momentum for the bulls in the short term. If the European session continues to fluctuate below 3333, then the entry of short positions will be slightly more stable. Yesterday, short orders were given at the key points of 3321 and 3333, and TP looked at 3310. If the bulls re-emerge below 3310-3305, you can consider short-term long positions and target 3330-3335.

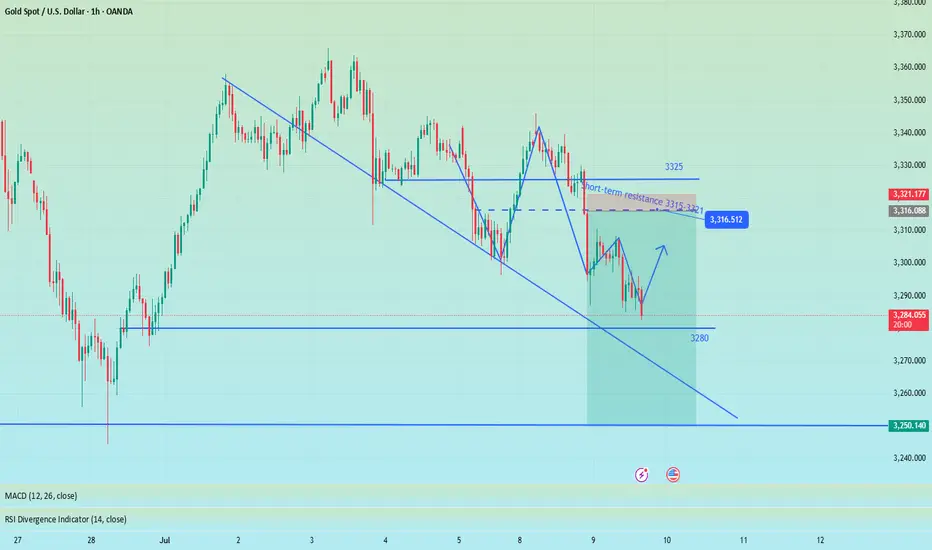
Gold rebounds as expected, NY focuses on the Fed meeting📰 News information:
1. Federal Reserve meeting minutes
📈 Technical Analysis:
Gold fell into a narrow range of fluctuations during the European trading session. As I said this morning, gold is expected to rebound in the short term and the bullish momentum needs to be released. From a technical perspective, the overall market is still in a volatile pattern. The support at the 3280 level below is still a key point that needs attention in the short term. The European session has repeatedly tested this area. If it falls below this support, it is expected to touch the 3250 level as I said. While guarding against gold diving during the NY session, the upper resistance of 3315-3321 cannot be ignored to prevent bullish retaliation.
🎯 Trading Points:
SELL 3315-3321-3333
TP 3300-3290-3280-3250
In addition to investment, life also includes poetry, distant places, and Allen. Facing the market is actually facing yourself, correcting your shortcomings, facing your mistakes, and exercising strict self-discipline. I share free trading strategies and analysis ideas every day for reference by brothers. I hope my analysis can help you.
OANDA:XAUUSD PEPPERSTONE:XAUUSD FOREXCOM:XAUUSD FX:XAUUSD FXOPEN:XAUUSD TVC:GOLD
SelectQuote | SLQT | Long at $2.18SelectQuote NYSE:SLQT is currently resting within my historical simple moving average zone. This often signals consolidation and a future move (in this case, let's hope up). Looking at the company's financials, NYSE:SLQT is currently profitable. For Q3 2025 (ended March 31, 2025), the company reported a net income of $26.0 million, up from $8.6 million in Q3 2024. This follows a strong Q2 2025 with a net income of $53.2 million. While like most companies there are likely headwinds in 2025 (earnings are projected at a loss of -$0.20 per share due to seasonal fluctuations and investments in 2025 (e.g., new Kansas facility)), profitability is likely to stabilize in 2026, with EPS forecasts of $0.05, supported by improved Medicare reimbursement rates and operational efficiencies. Ongoing Department of Justice allegations could pose risks... but SelectQuote’s recent $350M investment and cost management suggest profitability may continue if legal issues are resolved favorably.
Thus, at $2.18, NYSE:SLQT is in a personal buy zone. There is a potential for the price to dip to the bottom of the historical simple moving average channel (near $1.25) in the near-term, but time will tell.
Targets:
$2.64
$4.24

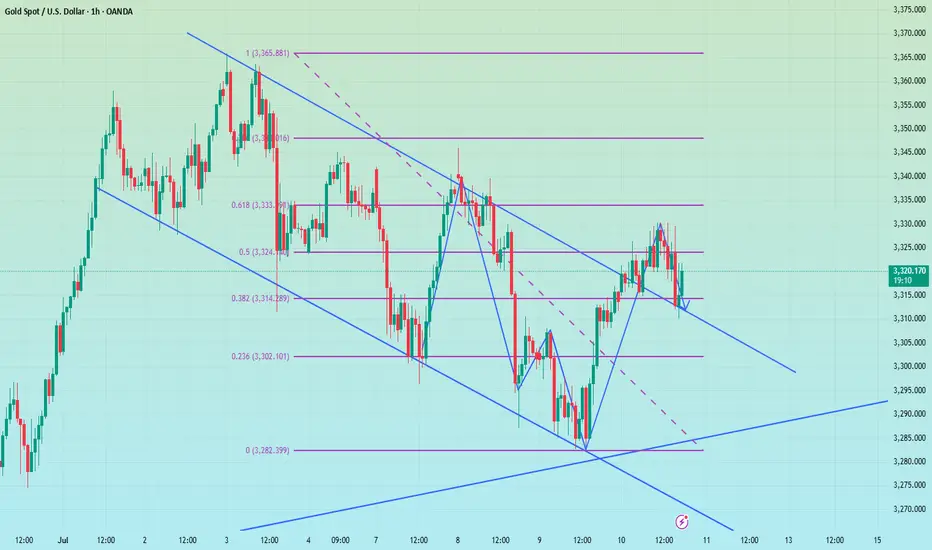
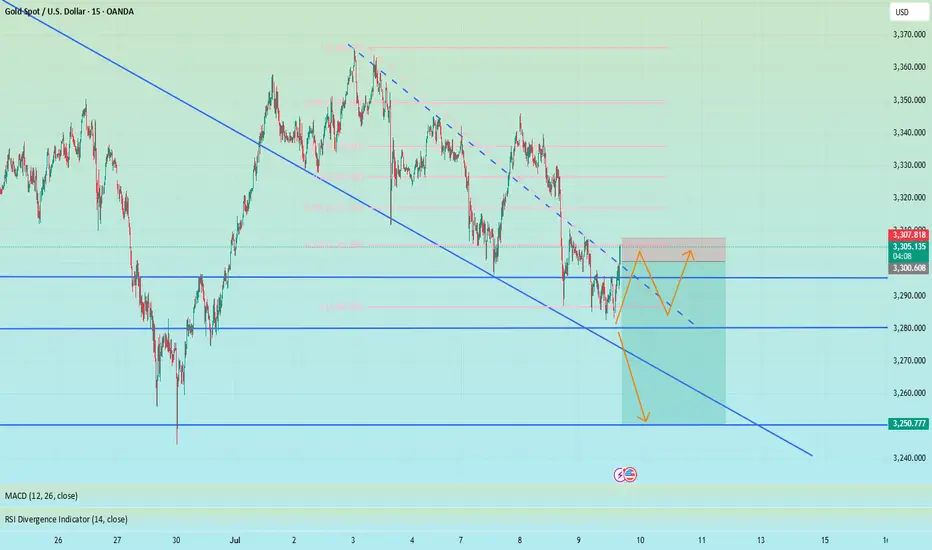
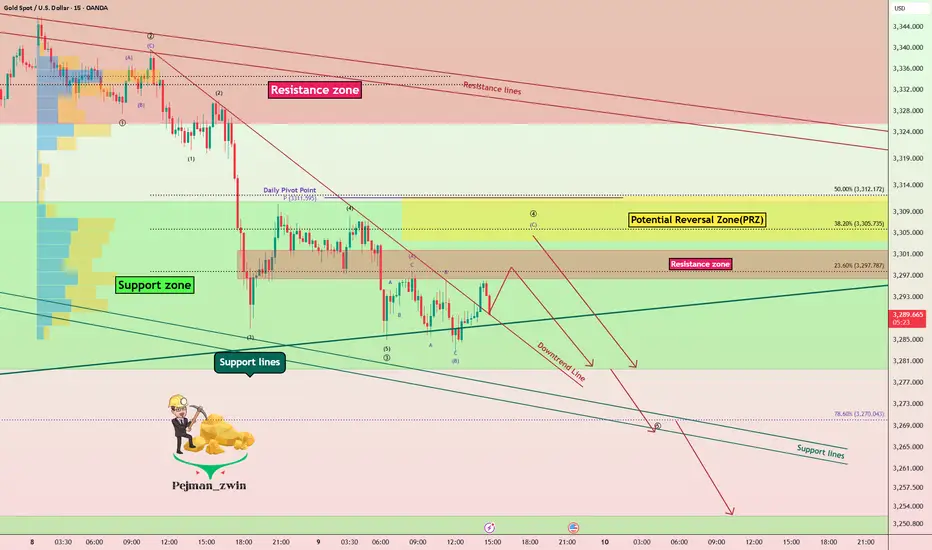
Support Under Siege – Is Gold Ready for Another Leg Down?As I expected in the previous idea , Gold ( OANDA:XAUUSD ) rose to $3,343 on the 1-hour time frame , but failed to break the Resistance zone($3,350-$3,326) and started to fall with relatively good momentum .
Do you think Gold can finally break the Support zone($3,312-$3,280) and Support lines , or will it rise again?
Gold is currently trading in the Support zone($3,312-$3,280) and near the Support line s. It has also managed to break the downtrend line .
In terms of Elliott Wave theory on the 15-minute time frame , Gold appears to be completing a main wave 4 . The main wave 4 appears to follow Double Three Correction(WXY) . Also, the main wave 3 is extended due to the high downward momentum.
I expect Gold to start falling again by entering the Potential Reversal Zone(PRZ) or Resistance zone($3,302-$3,296) and eventually breaking the Support zone($3,312-$3,280) and Support lines, Gold's falling targets are clear on the chart.
Note: Stop Loss (SL) = $3,313
Gold Analyze (XAUUSD), 15-minute time frame.
Be sure to follow the updated ideas.
Do not forget to put a Stop loss for your positions (For every position you want to open).
Please follow your strategy; this is just my idea, and I will gladly see your ideas in this post.
Please do not forget the ✅ ' like ' ✅ button 🙏😊 & Share it with your friends; thanks, and Trade safe.
CHAINLINK (LINKUSD): Very Bullish Outlook
I see 2 strong bullish confirmations on LinkUSD on a daily time frame.
The price violated 2 significant structures: a vertical falling resistance - a trend line
and a neckline of an inverted head & shoulders pattern.
With a high probability, the market will rise more.
Next resistance - 15.38
❤️Please, support my work with like, thank you!❤️

The decline in gold prices has not stopped. Do you know what to
Gold did not provide a better position to go long during the day, but continued to fluctuate, and was under pressure at 3330 many times. The short-term suppression was obvious, and the increase was limited. It is expected to usher in a decline today. Consider short-term short operations, pay attention to shorts near 3326, stop loss at 3334, and take profit at 3300. Pay attention to risks.
Short-term trading of gold in the evening of July 10: shorts near 3326, stop loss at 3334, take profit at 3306

US30 Consolidates Below Resistance – Tariff Risks LoomUS30 – Market Overview
The price is currently consolidating within the range of 44490 to 44180, awaiting a breakout to determine the next directional move.
Bearish Scenario:
As long as the price trades below 44490, we expect bearish volatility to retest 44180.
A confirmed 1H close below 44180 would open the path toward 43960 and 43760.
Bullish Scenario:
If the price closes above 44490, it will likely trigger a bullish move toward 44750, with potential extension to 44970 ATH and beyond.
Note: Market sentiment remains sensitive to tariff-related developments, which may drive sharp moves in either direction.
Pivot Level: 44490
Support: 44180, 43960, 43770
Resistance: 44750, 44960, 45100

DOGE | Preparing for Breakout Dogecoin appears to be setting up for a potential breakout from a long consolidation phase.
Key Technical Signals:
- Price has been consolidating near the range low around $0.14260 for months
- Recent price action shows higher lows formation
- RSI is showing signs of life after extended oversold conditions
Potential Long Setup:
- Entry: Current levels around $0.18025 or on any dip to support
- Target: Range high at $0.45000 (150%+ potential gain)
- Stop Loss: Below $0.14260 support level
Risk Factors:
- Crypto markets remain volatile
- Bitcoin correlation could impact movement
The technical setup suggests accumulation at these levels, with the potential for a significant move if the diagonal resistance is broken. However, failure to hold current support could lead to further downside.
