ADA/USDT – Possible ShortADA/USDT – Bearish Reaction from Key Channel Resistance | Short Opportunity
Bias: Short Setup (Counter-Trend)
Cardano (ADA) has reached a significant technical juncture following a strong bullish impulse. Price has tapped into a critical resistance zone marked by:
The upper boundary of a broadening ascending channel
A horizontal liquidity pocket at 0.6195, labeled as “Level 1”
An extended impulsive move without consolidation, suggesting potential overextension
📌 Key Price Levels
Resistance (Short Entry Zone):
Level 1: 0.6195 USDT
Bearish Targets (Take Profits):
TP1: 0.6017 – Local support & minor demand
TP2: 0.5939 – Mid-range value zone
TP3: 0.5842 – Confluence of wedge support & previous demand
The structure resembles a rising broadening wedge, typically a bearish reversal formation, especially after a sharp leg into resistance.
The breakout from the smaller consolidation wedge has now run into major supply, where early short entries may begin to scale in.
Trend Lines

Range Bound consolidation going on in the market. Range bound consolidation is going on in the market. As you can see in the chart there is consolidation going on before a substantial up or down move happens. Mostly it looks like Tariff negation deadline will be extended or India might end up getting the tariff deal sealed. all eyes on Trump and TCS results tomorrow. TCS has been reeling close to an year now after making a high of 4592 everything depends on the result tomorrow. The result can give direction to the market as TCS has good weightage (Around 6.09% in Nifty and 7.43% in BSE Sensex). TCS has 21.93% Weightage in Nifty IT index so the result tomorrow is a must watch. It can give direction to the It index as well.
Supports for Nifty remain at 25413 and 25243. If by chance this level is broken Nifty can fall further towards Mother line which is at 24862 or in worst case scenario towards Father line of daily chart at 24030.
Resistances for Nifty remain at: 25531 and 25710 Closing above which Nifty becomes very strong. After we get a closing above 25710 Nifty can swiftly move towards 25888 or even 26K+ levels.
Disclaimer: The above information is provided for educational purpose, analysis and paper trading only. Please don't treat this as a buy or sell recommendation for the stock or index. The Techno-Funda analysis is based on data that is more than 3 months old. Supports and Resistances are determined by historic past peaks and Valley in the chart. Many other indicators and patterns like EMA, RSI, MACD, Volumes, Fibonacci, parallel channel etc. use historic data which is 3 months or older cyclical points. There is no guarantee they will work in future as markets are highly volatile and swings in prices are also due to macro and micro factors based on actions taken by the company as well as region and global events. Equity investment is subject to risks. I or my clients or family members might have positions in the stocks that we mention in our educational posts. We will not be responsible for any Profit or loss that may occur due to any financial decision taken based on any data provided in this message. Do consult your investment advisor before taking any financial decisions. Stop losses should be an important part of any investment in equity.

SUI may be ready for next moveSUI has been consolidating for last 60 days and has tested the Daily FVG couple of weeks back. It looks like it is ready for trend line BO and should give 35% profit for recent high. But be cautious of low volume in the current move. Only a close above 3.08 with strong volume can confirm this.

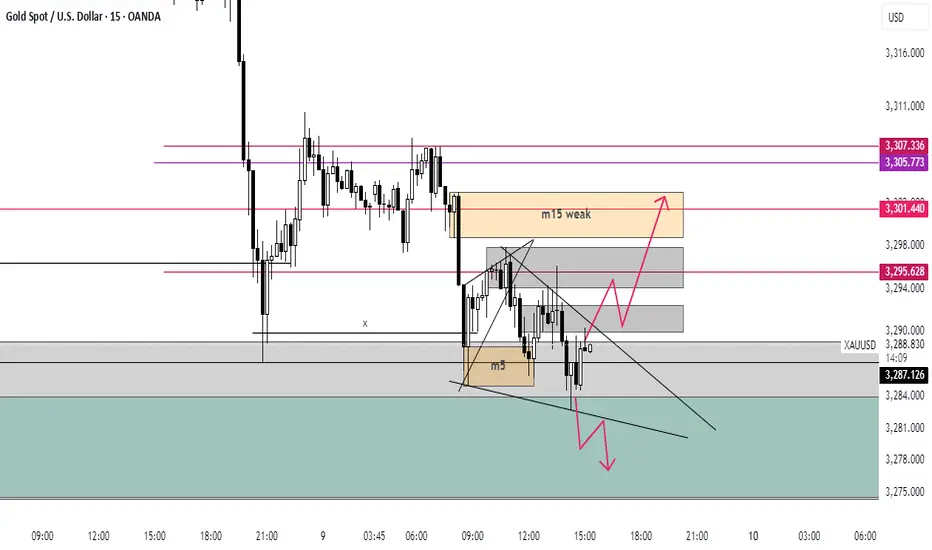
Gold Under Pressure as Dollar Strengthens – Watch Below 3297FX:XAUUSD – Technical & Fundamental Outlook
Gold prices declined on Monday, pressured by a stronger U.S. dollar following President Trump’s announcement of a potential 10% tariff on BRICS-aligned countries. The news supported the dollar and weakened demand for gold as a safe-haven asset.
Although uncertainty remains around U.S. trade negotiations ahead of the July 9 tariff deadline, signals of possible extensions and staggered implementation have further reduced short-term haven flows into gold.
Technical View:
Gold remains under bearish pressure while trading below 3320.
As long as the price stays under this level, we expect sideways consolidation between 3297 and 3320 until a breakout occurs.
A 1H close below 3297 would confirm bearish continuation, targeting 3281 and 3255.
A break above 3320 would invalidate the bearish outlook and shift momentum toward 3342.
Pivot: 3297
Support Levels: 3281 / 3255 / 3239
Resistance Levels: 3314 / 3320 / 3342
Previous idea: Click Here...

Don’t chase shorts when gold is at a low level, wait for a rebou
From the 4-hour analysis, today's upper short-term resistance focuses on the hourly top and bottom conversion position near 3318-24. The intraday rebound relies on this position to go short once and look down. The lower short-term support focuses on the vicinity of 3280. The overall support relies on the 3280-3325 area to maintain the main tone of high-altitude low-multiple cycles. In the middle position, watch more and move less, and follow orders cautiously, and wait patiently for key points to enter the market.
Gold operation strategy:
Gold 3285-3287 line long, stop loss 3277, target 3315-23 line, break and continue to hold

MAGIC | Breakout AttemptMAGIC is attempting a breakout from its long-term descending channel pattern.
Analysis:
RSI shows momentum building from oversold levels
Multiple VWAP indicators suggest institutional accumulation
Risk Factors:
Breakout needs volume confirmation
Failure at resistance could lead to retest of $0.20 support
Overall crypto market conditions remain influential
This setup offers attractive risk-to-reward if the breakout is confirmed by volume.

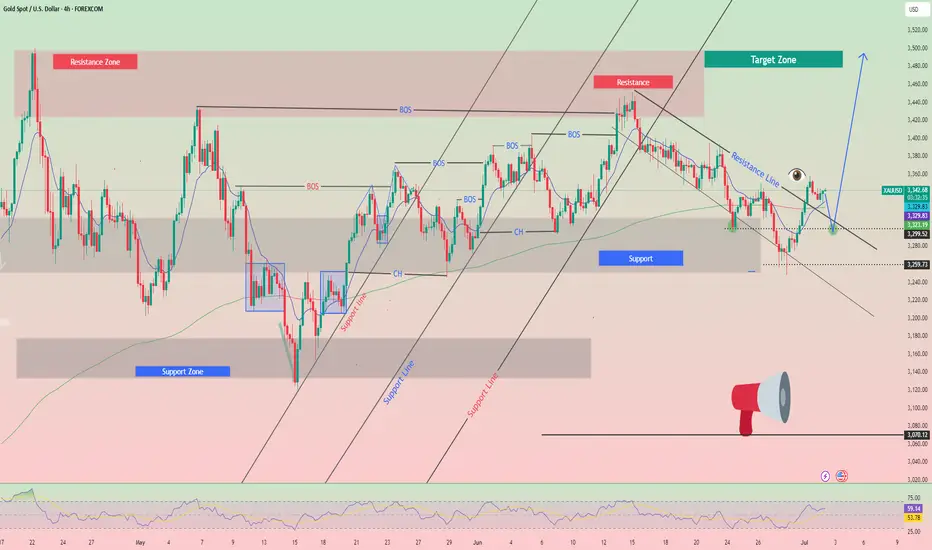
What is Dynamic Support and Resistance Levels & Zones in Forex
Dynamic supports and resistances play a crucial role in technical analysis.
Unlike classic supports and resistances, these zones change and adapt to a market price action in real time.
Learn what is dynamic support and resistance in Forex, Gold trading and how to find it easily.
Discover its main types and real market examples.
Let's start with the basics.
There are 2 major types of supports and resistances in technical analysis.
The first type is called static .
Such supports and resistances are fixed and don't change with time.
It should be strictly horizontal key levels or the zones.
Market price action and momentum beyond them do not affect these supports and resistances.
In the example above, you can find static supports and resistances on Gold. The market may return to one of those levels or the zones today, tomorrow or in a month, but it will not move.
In comparison to static supports and resistances, the dynamic ones shift with time. They constantly change and adjust as the time flies.
One of the obvious types of dynamic supports and resistances is a trend line.
Above is the example of a dynamic rising support based on trend line.
As the time goes, a support shifts and becomes higher and higher.
I found a great example of a dynamic resistance on Dollar Index.
Depending on the moment when the price tests that, the resistance will be on different levels.
The later the price tests the trend line, the lower is the resistance.
When newbie traders learn dynamic supports and resistances, they usually stop on trend lines.
But it is just a beginning.
Really significant dynamic supports are resistances will be the zones .
The areas based on static horizontal supports and resistances and trend lines.
Examine a price action on GBPCHF forex pair.
We have a static horizontal support area and a dynamic rising trend line.
Two supports intersect, composing a contracting dynamic support zone.
With time, it will become narrower, accumulating buy orders within.
On NZDCAD forex pair, I underlined a contracting dynamic resistance zone that is based on an intersection of a static horizontal resistance area and a falling trend line.
Selling orders will be distributed within.
The 2 dynamic support and resistance zones that we discussed are narrowing , but that is not always the case.
A dynamic support zone that I found on GBPNZD is expanding and broaden with time.
It is based on a dynamic falling trend line and a static horizontal support.
With time its boundaries will be wider and a bullish reaction may initiate from any level within that.
A dynamic resistance area that I spotted on EURCAD forex pair is a great example of an expanding resistance.
It is based on a static horizontal resistance and a rising trend line.
We can easily recognize how it grows with time.
Of course, another types of dynamic supports and resistances exist. But they are more nuanced and rare.
As soon as you learn to recognize the clusters that we discussed in this article, you will be able to recognize the less obvious ones as well.
Next time, when you execute a support and resistance analysis, try to find a dynamic zone. You can find it on any time frame, and forex pair and gold, and it will completely change your perspective on the market.
❤️Please, support my work with like, thank you!❤️
I am part of Trade Nation's Influencer program and receive a monthly fee for using their TradingView charts in my analysis.

USNAS100 Consolidates Between 22815–22705 | Breakout Will DefineUSNAS100 – Technical Outlook
The NASDAQ remains under pressure amid ongoing tariff uncertainty, with traders closely watching for any progress in negotiations or signs of escalation.
Currently, the price is consolidating between 22815 and 22705, awaiting a breakout to define the next directional move.
A 1H candle close below 22705 would confirm bearish continuation, targeting 22600, with further downside potential toward 22420.
A break above 22815 would shift momentum bullish, opening the way to 22880, followed by 23010.
Key Levels:
Support: 22600 / 22420
Resistance: 22815 / 22880 / 23010

Gold rebound is powerless and waiting for catalyst! European sup
In the Asian session on Wednesday, spot gold suddenly fell rapidly in the short term, falling to the lowest level of 3284. At present, gold is firmly bearish in the near term, and the price of gold may fall to $3247/ounce. The Federal Open Market Committee (FOMC) is scheduled to release the minutes of the June monetary policy meeting on Wednesday. This document may reiterate what speculative interest already knows, that is, Fed officials are satisfied with their recent wait-and-see stance.
The Federal Open Market Committee (FOMC) will release the minutes of the June monetary policy meeting. The minutes of the Fed's June 17-18 meeting to be released will send a more dovish signal than expected, and the "wait-and-see period" for rate cuts may end in late summer.
Views on today's gold trend!
Looking back at the market, it fell first and then rose on Monday, and then retreated directly on Tuesday. The market turned so sharply, and after gold broke below 3300 again yesterday, the market tended to be weak. At present, the upward trend of gold is still in effect, but buyers seem to be losing momentum. It is worth noting that the relative strength index (RSI) triggered a "sell signal" as the index fell below 50, indicating that sellers outnumbered buyers.
From the perspective of price action, gold prices need to fall below the June 30 low of $3,246/oz to pave the way for further declines. From the 4-hour trend chart and the daily trend, the key node of opening pressure is around 3,321. This position is the low point of yesterday's sideways trading, and it is also the key suppression level of the trend line and the moving average. If you want to weaken again today, this position cannot stand firm, and the support below will first look at the double support of 3,376 and 3,247!
Gold: Short near 3,321, defend 3,331, and target 3,296-3,285! Enter long orders if it falls back to around 3,276 without breaking, defend 70, and target 3,310! If it continues to break, wait for the 3,347 first-line support to take more!

SPX500 Awaits Breakout as Trade Talks Fuel Market CautionWall Street Edges Up Amid Tariff Talks & Trade Turbulence
U.S. stock index inched higher on Wednesday as markets remain on edge over President Donald Trump's aggressive tariff stance and the ongoing negotiations with global trade partners. Traders are cautiously watching for clarity, with sentiment shifting quickly on any updates.
📉 SPX500 Technical Outlook
The index continues to consolidate within a narrow range between 6223 and 6246. A confirmed breakout from this zone is needed to define the next directional move.
A break below 6223 would confirm bearish continuation toward 6194, with potential extension to 6143.
A break above 6246 would shift the bias bullish, targeting 6282, followed by 6305.
Key Levels:
Support: 6223 / 6195 / 6143
Resistance: 6282 / 6305

Is the Trend Intact? Key Signal Emerging on GER40 4H ChartHey Guys,
We could see a pullback on the GER40 index from the 24,060 level. If that happens, the 23,824 – 23,675 zone could present a potential buying opportunity. The primary trend still points upward, and bullish momentum remains intact.
Also worth noting—the rise in volume is quite striking, which supports my target level of 24,500.
I meticulously prepare these analyses for you, and I sincerely appreciate your support through likes. Every like from you is my biggest motivation to continue sharing my analyses.
I’m truly grateful for each of you—love to all my followers💙💙💙

XAUUSD INSIGHTXauusd , price is in descending contracting triangle channelling as shown in the given chart.
We will let the price to break of the channel then we decide our bias for entry.
Keep checking the channel for more update and signals.
If any query do contact me directly 🙏
Trading Signal for (XAU/USD) sell below $3,359 (21 SMA-7/8 MurraEarly in the European session, gold is trading around 3,341, below the 7/8 Murray and above the 21 SMA and the 200 EMA, with a bullish bias.
We can see that gold reached the 7/8 Murray level on the H4 chart. This has become strong resistance, so we believe a technical correction could occur below this level in the coming hours.
On Monday, we observed gold reaching a low of 3,238, where it found a technical rebound,, as this coincided with the bottom of the downtrend channel.
Gold has a bullish bias, having reached oversold levels since June 26. It is likely that after a technical correction, it could resume its bullish cycle and reach the 8/8 Murray level at 3,437.
If gold falls below 3,359 in the coming hours, we could expect it to reach the 200 EMA around 3,321. This area will be seen as an opportunity to resume buying, as a bullish trend is emerging.
The RSI indicator is showing a positive signal, so we could take advantage of a technical rebound around 3,320 or 3,305. Both levels could provide gold with good support and a buying opportunity.
VICUSDT 15-Minute Technical Analysis With 2:1 RewardThis chart shows a clear range-bound market, with price oscillating between a strong support and a well-defined resistance zone. Overall, momentum has been choppy, and frequent reversals are visible.
Support and Resistance
At the top of the chart, you have the Resistance Zone marked at 0.3498 USDT. This level has been tested multiple times and rejected. Each attempt to close above this area resulted in sharp selling pressure, confirming it as a significant ceiling for price action.
A slightly lower level, labeled Safe Take Profit, is set at 0.3392 USDT. This is a strategic target that allows traders to secure gains before price collides with the stronger resistance.
The lower part of the range is defined by Strong Support around 0.2845 USDT. This support level has been respected after previous sell-offs, showing that buyers have consistently defended this zone.
Trend and Structure
Market structure is consolidative. Price has printed lower highs over several sessions, but at the same time, it has held onto higher lows closer to the support. This compression indicates an upcoming breakout, either toward the resistance or through the support.
Short-term momentum is indecisive. The colored moving average ribbon you applied (likely a Supertrend or fast EMA) flips repeatedly between red and blue, showing the market has no persistent trend.
A notable volatility spike occurred during one of the recent candles, sweeping the lows and immediately rebounding—classic behavior near strong support. This long wick suggests that some stop-loss liquidity was taken, and buyers reacted swiftly to reclaim the level.
Volume Considerations
Although the chart doesn’t show volume, it is reasonable to assume there was a volume surge during those sharp wicks, which typically precedes either a reversal or acceleration. Before entering a trade, confirming volume is critical for validation.
Current Price Behavior
The current price (~0.3028 USDT) is stuck below the mid-range, facing hesitation. The moving averages have flattened. This is a textbook sign that the market is accumulating orders in preparation for the next decisive move.
Trade Idea
Below is a simple, clear trade idea you can consider, with bullets for clarity:
• Entry: Near 0.3028 USDT, ideally after a bullish confirmation candle that closes above recent small consolidation.
• Take Profit: The Safe TP level at 0.3392 USDT, positioned just under resistance.
• Stop Loss: Just below the Strong Support at 0.2845 USDT.
• Risk/Reward Ratio: Approximately 2:1. This offers reasonable upside relative to the risk.
This setup is effective only if price holds above the support and begins to trend higher. If price fails to sustain above 0.30, it could signal a deeper retest of support.
Scenarios to Watch
If you are trading this setup, it’s important to watch for three potential outcomes.
In the bullish scenario, price holds above ~0.300 and forms a higher low. A strong bullish candle closing near 0.31 or higher would add confirmation. If this happens, the path to 0.3392 becomes more likely, and possibly even to the full resistance zone at 0.3498.
In the bearish scenario, price loses the support at 0.2845 decisively. A clean close below this level opens up downside risk, possibly accelerating liquidations from trapped long positions.
In a consolidation scenario, price remains compressed between ~0.295 and ~0.315. If this happens, patience is necessary until a breakout confirms direction.
Execution Tips
When you plan to enter this trade, consider the following:
If you enter near 0.303, monitor the next 2–3 candles carefully. You want to see buyers stepping in with higher lows and a steady move toward 0.32. If price instead hovers sideways or moves lower, be prepared to exit quickly to protect capital.
Avoid moving your stop loss further down if the trade moves against you. This is a common mistake that often leads to larger losses.
Scaling out partial profit before the final target is a smart tactic. For example, consider closing 50% of your position near 0.325 if the price shows signs of hesitation.
Summary
Your VICUSDT 15m chart reveals a clean trading range between 0.2845 and 0.3498. The market has no clear trend, but the setup you highlighted can work if buyers confirm strength above 0.30. The plan combines a relatively tight stop, a realistic target under resistance, and a favorable risk/reward profile.

NASDAQ Potential DownsidesHey Traders, in today's trading session we are monitoring NAS100 for a selling opportunity around 22,750 zone, NASDAQ is trading in a downtrend and currently is in a correction phase in which it is approaching the trend at 22,750 support and resistance area.
Trade safe, Joe.

GOLD → Readiness to test the local bottomFX:XAUUSD is under pressure from the rising dollar and uncertainty, breaking through support levels, which opens up a corridor for the market to fall to 3255 - 3246
The price of gold is consolidating around $3300 after falling more than 1% amid expectations of the Fed minutes and news about tariffs.
Investors remain cautious: the dollar is supported by hopes for US trade deals, while the threat of new tariffs from August 1 is holding back gold's growth.
Weak inflation data in China did not support the metal, while expectations that the Fed will not rush to cut rates due to inflationary pressure from tariffs are also limiting interest in gold. Traders are waiting for the Fed minutes and new statements from Trump to determine the further direction.
Technically, the market looks weak (on D1, the price closed below the key level of 3300 on Tuesday) and there is a chance of a further decline.
Resistance levels: 3300, 3311
Support levels: 3295, 3255, 3246
Consolidation below 3295-3300 could trigger a further decline to 3255, from which the market could react with a correction.
Buying can be considered if gold reverses the short scenario, manages to strengthen to 3311, and consolidates above this level. At the moment, the price is in the selling zone...
Best regards, R. Linda!


EURUSD → Bullish daily structure. Correction before growthFX:EURUSD , after significant growth and a break of structure, has entered a local correction, the target of which may be a phase of accumulation of potential for updating intermediate highs (1.183).
The daily market model is bullish. A break of the structure has formed on D1, and the market is entering a correction phase, during which it may be interested in testing 0.5 or the 0.7 Fibonacci area before continuing its growth. I would also like to draw attention to the previously broken resistance level of 1.164 - 1.163, which, within the current correction, may act as a support level for buyers...
In addition, the market has not yet reached the liquidity level it was heading for during the correction for a possible continuation of growth. Zone of interest: 1.168, 1.164, 1.159
Resistance levels: 1.1728, 1.1766
Support levels: 1.168, 1.164, 1.159
A false breakdown of the specified support zone could change the market imbalance and attract buyer interest, which could generally support the bullish trend.
Best regards, R. Linda!

Buy Gold! The short-term bottom may have appeared!Gold continued to retreat yesterday and hit a recent low, reaching around 3287. Then gold gradually rebounded to above 3300. Relatively speaking, the rebound momentum was weak. It is expected that the long and short sides will fight fiercely around 3300. However, from the recent characteristics of gold operation, it can be seen that although the short position of gold is strong, it is difficult to continue in the short term, and I think the short-term decline of gold is basically in place, so at this stage, in terms of short-term trading, I do not advocate shorting gold directly;
As gold did not continue to fall after reaching around 3287, on the contrary, it gradually rebounded to above 3300, which may strengthen the market's consensus on the short-term bottom, thereby attracting the favor of off-site funds; from the current gold structure, if gold can maintain above 3300-3295, it may be combined with the 3287 low to build a "W" double bottom structure, which is conducive to supporting the rebound of gold.
However, as gold fell below 3300 again, the bearish trend is relatively strong, so we need to moderately lower our expectations for a gold rebound. In the short term, gold is under pressure in the 3315-3325 area, so we can temporarily look to this area for the rebound target. Therefore, in short-term trading, I do not advocate shorting gold directly, and you can first consider going long on gold in the 3300-3295 area, TP: 3310-3320-3330.

🇺🇸 XAUUSD – July 9 | Structure Testing Key Levels AgainYesterday’s clean rejection from 3328.76 gave us a profitable 300+ pip move down to 3298. Today, we’re seeing a potential double bottom near 3284.61 — the same level price held during yesterday’s drop.
📌 What I’m Watching:
🔼 Buy Setup:
Break above today’s high → bullish continuation to 3345.66
➤ Estimated 300+ pips upside
🔽 Sell Setup:
Break of today’s low = move to 3274.00
➤ If 3274 breaks, extension to 3246.00 opens up another 180 pips
Overall bias remains bullish (daily & weekly trendlines still respected), but I’ll trade what price confirms — not what I expect

1000PEPEUDST.P LONG1000PEPEUSDT.P has broken its trendline. Time for massive longs moves!
Entry Area
.010215
SL
5-10%
TP in fib areas:
-.0113737
-.0123232
-.0132727
-.0146245
Greedy target
-.0213191
#DYOR
#TYOR
#NOT A FINANCIAL ADVICE
USE LOW LEV & MARGIN ONLY!
HAPPY TRADING!

AAPL Short Term Highs IncomingAAPL 1D
Apple looks good from here.
Target 1 @ 214.30
Target 2 @ anywhere from 218 to buyside liquidity
Retest of the former high then a pullback to fair value region is possible before continuation to the next short term high.

EURUSD TRADES BEARISH
Last week, due to a fail of holding above the 1.18000 level, we saw a huge 1-hour decline of 0.39% on big selling volumes, which is not typical for such instruments as EURUSD. Since that time, the price has been moving within a descending channel and has formed a possible pennant yesterday. All of the factors "vote" for going bearish in this asset.
So, what will be the possible scenario? We may go market sell right immediately, or wait till the breakout of the pennant pattern. In this case we may set
🔽 a sell stop order at 1.17400 with
❌a stop loss at 1.17670 and
🤑a take profit at 1.16915
Additionally, EURUSD may go even further downstairs, next to a 1.16000 support level. For this case we may preserve some minor part of our position with a take profit set nearby this level.
