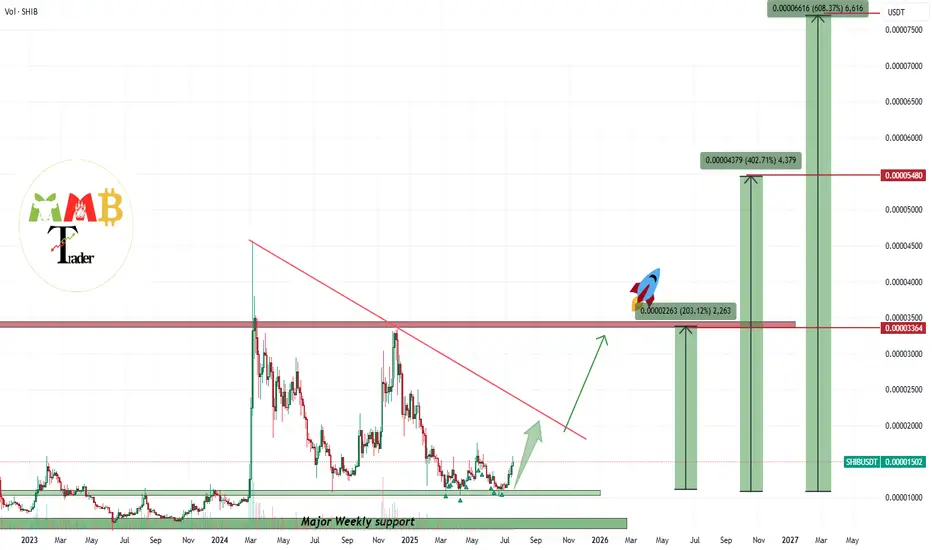
SHIBUSDT first target is +200% after years of sleepBINANCE:SHIBUSDT is not dead or sleep or it wont be any more and i think in this market soon it can see more gain and this +40% until now is just start and at least our first target which is +200% can hit soon like green arrow.
DISCLAIMER: ((trade based on your own decision))
<<press like👍 if you enjoy💚
Trend Lines
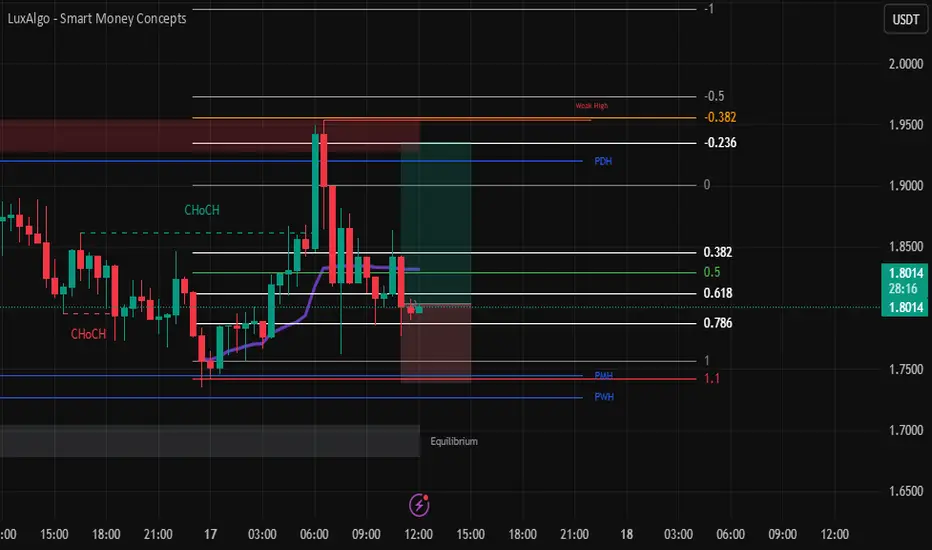
SPX LONG📘 Daily Trade Journal – Thursday, July 17
1. Trade Overview
- Asset:-SPX - Direction:** Long
- Entry Time:** After 10:00 p.m. (Vietnam Time)
- Timeframes Used:** 1H, 30m
- Bias Origin:** Bullish market structure continuation with recent change of character
---
2. Trade Idea (Before Entry)
I came to the charts shortly after 10:00 p.m. PopCat had just wicked into the 0.618 Fibonacci level. I considered it a chase, so I passed on it—didn’t get the retracement I wanted.
ETH and Solana were not retracing into the OTE zones either.
Pengu appeared more bearish—potentially forming a daily lower high, indicating slowing upside momentum. I ruled that one out too.
I ended up selecting **SPX**, trading it for the first time. Despite that, I stayed focused on structure and levels:
1H timeframe had a bullish **external break of structure.
30m timeframe showed a temporary bearish retracement, but then a bullish change of character followed.
This change of character swept the previous day’s high, which was a concern since that level was also my target, and it had already been touched—possibly by London.
Despite this, I decided to take the trade based on:
* Anchored Fibonacci from today's early session low to the current high
* Overall structure still being bullish
* Expecting a possible sweep of today’s **intraday high** and maybe even another test above **yesterday’s high**
---
### 3. **Entry Details**
* **Entry Price:** \
* **Risk Taken:** \
* **Stop Loss Placement:** Below the retracement swing low / point of invalidation
* **Confluences Used:**
* ✅ Fibonacci retracement
* ✅ Change of Character
* ❌ No AVWAP, trendlines, or order blocks used
---
### 4. **Exit Details**
*(To be completed when the trade closes)*
* **Exit Time:** \
* **Exit Price:** \
* **Reason for Exit:** \
---
### 5. **Outcome**
*(To be completed when the trade closes)*
* **P\&L:** \
* **Partial or Full Exit:** \
* **Session of Exit:** \
---
### 6. **Self-Assessment**
* ✅ **What went right?**
* Didn’t force a trade on assets that didn’t return to key levels.
* Stayed open to switching assets when familiar names didn’t provide ideal setups.
* Executed a setup based on structure, not emotional attachment.
* ❌ **What could be improved?**
* SPX target had already been swept—may need to reevaluate entering **after** key liquidity has already been taken.
* More clarity needed when trading unfamiliar assets for the first time (like SPX).
* 📋 **Did I follow my trading plan?**
* Yes. I stayed within my timeframe, followed structure, used Fibonacci, respected the process.
* 📈 **Would I take this trade again, exactly the same way?**
* Yes, with caution. Would want stronger confirmation if the target liquidity has already been touched. Otherwise, setup fits criteria.
* 🔎 **How would I rate this trade out of 10?**
* \
---
🧠 Notes for Improvement
Today, I didn’t fixate on one asset, which may be a strength.
Need to define a clearer protocol for **target levels that have already been swept**—whether to stand aside or expect continuation.
Emotionally balanced today. No FOMO trades. If this one plays out, great. If not, it’s still within plan.
---
💤 Closing Note
This is Day 3 of live journaling and publishing. One clean setup executed. No overtrading. I’ll let the market decide the outcome and stick to my commitment: one session, one plan, one trade idea. Back tomorrow—same window.
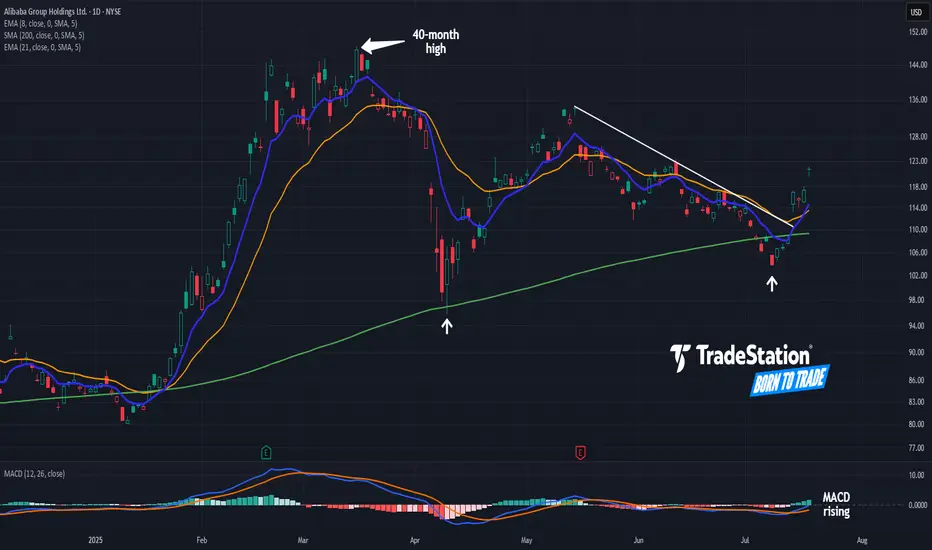
Alibaba Breaks a TrendlineAlibaba began 2025 with a big rally. Now, after a long pullback, some traders may see further upside in the Chinese tech giant.
The first pattern on today’s chart is the pair of higher lows (marked with white arrows) along the rising 200-day simple moving average. Those may reflect the development of a longer-term uptrend.
Second, BABA peaked above $148 in March. It was the highest price since November 2021. That may suggest a long-term downtrend is fading.
Third is the series of lower highs in May and June. The stock broke that falling trendline this week, a potential sign of improving price action in the short term.
Next, MACD is rising and the 8-day exponential moving average is nearing a potential cross above the 21-day EMA. Those could be viewed as further positive short-term signals.
Finally, BABA is an active underlier in the options market. (Volumes have averaged more than 200,000 contracts per session in the last month, according to TradeStation data.) That may help traders take positions with calls and puts.
TradeStation has, for decades, advanced the trading industry, providing access to stocks, options and futures. If you're born to trade, we could be for you. See our Overview for more.
Past performance, whether actual or indicated by historical tests of strategies, is no guarantee of future performance or success. There is a possibility that you may sustain a loss equal to or greater than your entire investment regardless of which asset class you trade (equities, options or futures); therefore, you should not invest or risk money that you cannot afford to lose. Online trading is not suitable for all investors. View the document titled Characteristics and Risks of Standardized Options at www.TradeStation.com . Before trading any asset class, customers must read the relevant risk disclosure statements on www.TradeStation.com . System access and trade placement and execution may be delayed or fail due to market volatility and volume, quote delays, system and software errors, Internet traffic, outages and other factors.
Securities and futures trading is offered to self-directed customers by TradeStation Securities, Inc., a broker-dealer registered with the Securities and Exchange Commission and a futures commission merchant licensed with the Commodity Futures Trading Commission). TradeStation Securities is a member of the Financial Industry Regulatory Authority, the National Futures Association, and a number of exchanges.
Options trading is not suitable for all investors. Your TradeStation Securities’ account application to trade options will be considered and approved or disapproved based on all relevant factors, including your trading experience. See www.TradeStation.com . Visit www.TradeStation.com for full details on the costs and fees associated with options.
Margin trading involves risks, and it is important that you fully understand those risks before trading on margin. The Margin Disclosure Statement outlines many of those risks, including that you can lose more funds than you deposit in your margin account; your brokerage firm can force the sale of securities in your account; your brokerage firm can sell your securities without contacting you; and you are not entitled to an extension of time on a margin call. Review the Margin Disclosure Statement at www.TradeStation.com .
TradeStation Securities, Inc. and TradeStation Technologies, Inc. are each wholly owned subsidiaries of TradeStation Group, Inc., both operating, and providing products and services, under the TradeStation brand and trademark. When applying for, or purchasing, accounts, subscriptions, products and services, it is important that you know which company you will be dealing with. Visit www.TradeStation.com for further important information explaining what this means.
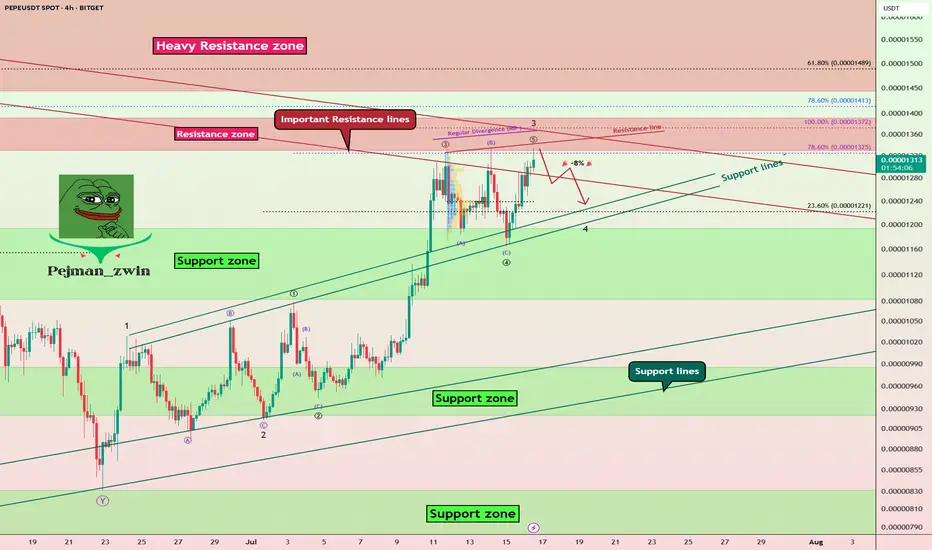
PEPE Faces Key Resistances – Is a -8% Pullback Coming?The PEPE memecoin ( BINANCE:PEPEUSDT ) is currently near the Resistance zone($0.00001392-$0.00001330) and Important Resistance lines . This is the third time that PEPE has attacked the Important Resistance lines .
In terms of Elliott wave theory , it seems that PEPE is completing the microwave 5 of the main wave 3 , so that the main wave 3 is of the extended type .
Also, we can see the Regular Divergence(RD-) between Consecutive Peaks.
I expect a -8% drop for PEPE in the coming hours.
First Target: $0.00001251
Second Target: $0.00001212
Note: Stop Loss(SL)= $0.00001400
Please respect each other's ideas and express them politely if you agree or disagree.
PEPE Analyze (PEPEUSDT), 4-hour time frame.
Be sure to follow the updated ideas.
Do not forget to put a Stop loss for your positions (For every position you want to open).
Please follow your strategy and updates; this is just my Idea, and I will gladly see your ideas in this post.
Please do not forget the ✅' like '✅ button 🙏😊 & Share it with your friends; thanks, and Trade safe.
PEPEUSDT broken trendline and bullish market aheadAs we can see on the major resistances which was red trendline broke and price now after more range here or without it can see more gain at least to the targets like 0.000017$.
DISCLAIMER: ((trade based on your own decision))
<<press like👍 if you enjoy💚

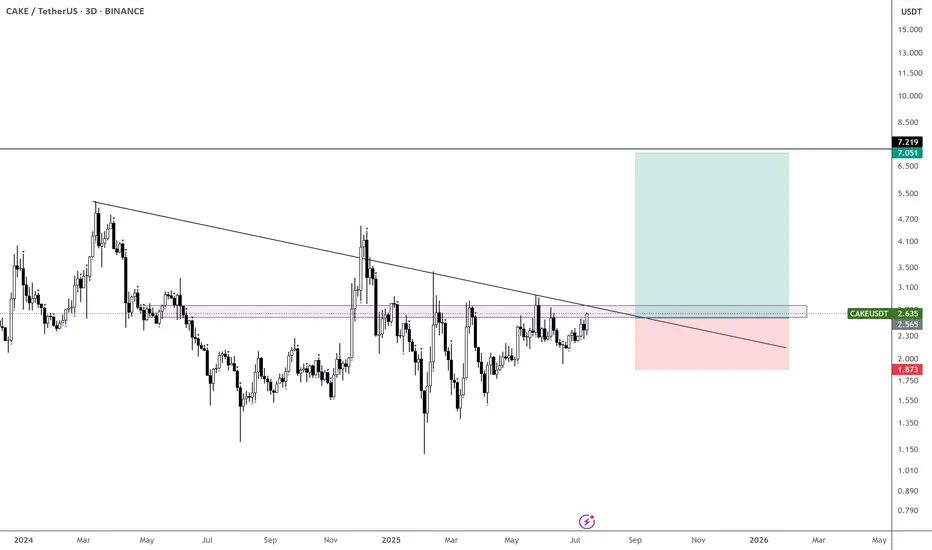
$CAKE is coiling up nicely - Aiming for $7
It hasn’t done much over the past few months, but it’s now above the yearly open and on its 6th attempt to break through the monthly supply zone.
Could this finally be the breakout that leads us toward $7?
Taking bids here and exercising patience.
With CRYPTOCAP:XRP , CRYPTOCAP:ETH , CRYPTOCAP:HBAR , and EURONEXT:ALGO already moving — and possibly CRYPTOCAP:BNB next — this could be a perfect setup for a delayed BINANCE:CAKEUSDT catch-up play.
XRP rally to $8.50After XRP broke above the resistance at $1.80 now that became the major support for the past few months and XRP is taking off again.
According to this huge monthly triangle and calculate from the breakout, so the next target for XRP is $8.50 for the coming months.

Powell's stay or departure affects the market, and gold is unlik
Yesterday, the Trump and Powell incident caused gold to rise strongly to around 3377. The rise of gold was just a moment. In the end, the gold daily line closed positive, but closed with a super long upper shadow line. In the end, the gold price quickly rose and broke through the 3377 mark, and then fell under pressure and fell into a shock closing. The daily K line closed high and fell back and fluctuated in the middle of the positive. Although the overall gold price repeatedly fluctuated and washed the market under the stimulation of the news, it ultimately failed to break through the recent large box shock range. Today we continue to pay attention to the support line of 3318-25 below. We will continue to go long if it falls back!
From the 4-hour analysis, today's short-term support below continues to focus on the vicinity of 3318-25, the short-term pressure above focuses on the 3340-45 line, and the key pressure above focuses on the 3380 line. The overall support range still maintains the main tone of high-altitude low-multiple cycle participation. In the middle position, watch more and do less, and follow orders cautiously, and wait patiently for key points to enter the market.
Gold operation strategy:
Gold falls back to the 3318-25 line and goes long, stop loss 3312, target 3340-45 line, and continues to hold if it breaks;

Pay attention to the 3350 high point suppression!At present, we are paying attention to the short-term pressure near 3340-3350. If this position is not broken today, the daily line will continue to maintain a downward oscillation state, and continue to pay attention to the short-term competition near 3340-3350. Considering that the US dollar index is at a relatively high level in the short term, there is a certain demand for pressure repair, which may also bring a certain range of fluctuations to gold. Therefore, the gold operation maintains a range of fluctuations of 3300-3350. In the short term, we also need to pay attention to the emotional impact brought by fundamentals. From the current gold trend analysis structure, the short-term support below continues to focus on the vicinity of 3310-3300, the short-term suppression above focuses on the vicinity of 3340-3350, and the key pressure above focuses on the vicinity of 3380. The overall trend is running around the 3300-3350 range. The operation is mainly to participate in the volatile market with the idea of selling high and buying low, and remain flexible in response. It is recommended to wait and see more and do less in the middle position, chase orders cautiously, and wait patiently for key points to enter the market.
Gold operation strategy: Go long when gold falls back to around 3315-3305, with a target of 3335-3340.

US30 Holds Above 44500 – Bullish Momentum in PlayUS30 | Technical Overview
The price action continues to reflect a bullish bias, supported by strong earnings reports and solid U.S. economic data. As long as the index trades above 44500, the upward momentum is expected to continue.
Technical Outlook:
Price remains bullish above 44500, with upside targets at 44640 and 44760.
A confirmed 1H close below 44500 would shift momentum to the downside, exposing support levels at 44350 and 44215.
Key Levels:
• Pivot: 44500
• Resistance: 44640 / 44760 / 44920
• Support: 44350 / 44215 / 44075

Gold Eyes 3365 – Breakout or Rejection?GOLD | Technical Outlook
Gold maintains bullish momentum as long as it trades above 3355, aiming to test the 3365 resistance level.
However, signs of rejection at 3365 may emerge, especially if the 4H candle closes below this level. In that case, expect a period of sideways consolidation between 3365 and 3342.
A confirmed 1H candle close above 3365 would signal bullish continuation toward 3373, with an extended target at 3395.
Key Levels:
• Pivot: 3355
• Resistance: 3365 / 3375 / 3395
• Support: 3342 / 3333
Outlook:
• Bullish above 3355
• Breakout above 3365 confirms further upside
• Rejection at 3365 may lead to short-term range-bound movement

The short-selling idea remains unchanged, defend 3355📰 News information:
1. Powell responds to White House issues
2. Will other countries impose reciprocal sanctions on tariffs?
📈 Technical Analysis:
Gold closed with a long lower shadow on the daily line yesterday and closed with a doji on the hourly line. In the short term, gold may continue to rise and is expected to touch the 3355 line. If gold cannot break through and stabilize above 3355, then gold may fall back. We can still consider shorting, and the target can be 3330. If the trend is as expected, it may form the embryonic form of a head and shoulders bottom. On the contrary, if the gold price breaks through 3355, stop loss on short positions and pay attention to the high resistance of 3375-3385.
🎯 Trading Points:
SELL 3340-3355
TP 3330-3320
In addition to investment, life also includes poetry, distant places, and Allen. Facing the market is actually facing yourself, correcting your shortcomings, facing your mistakes, and exercising strict self-discipline. I share free trading strategies and analysis ideas every day for reference by brothers. I hope my analysis can help you.
TVC:GOLD PEPPERSTONE:XAUUSD FOREXCOM:XAUUSD FX:XAUUSD OANDA:XAUUSD FXOPEN:XAUUSD

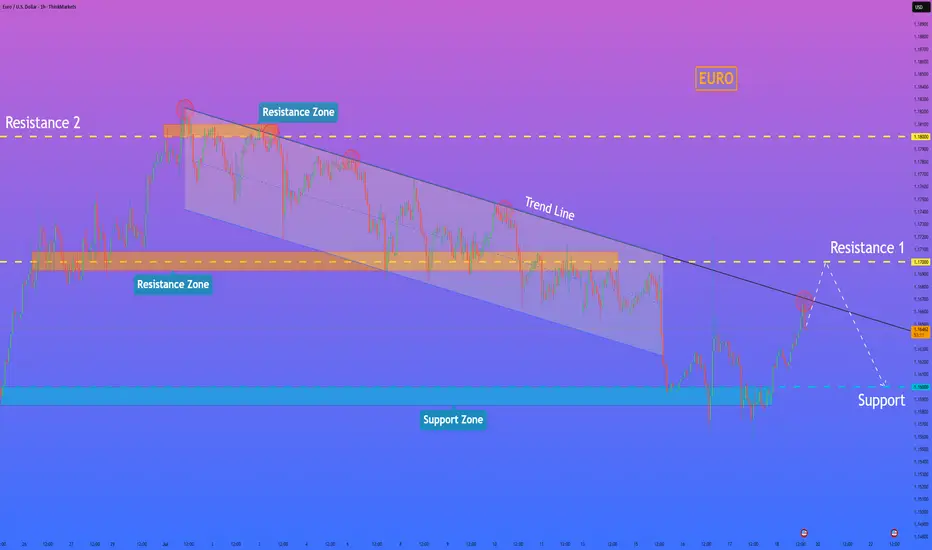
HelenP. I Euro will reach resistance level and then start fallHi folks today I'm prepared for you Euro analytics. For an extended period, the euro was trading within a clearly defined downward channel, consistently respecting its boundaries and moving under bearish pressure. Recently, however, the price staged an aggressive breakout from this structure, pushing above the upper trend line with a strong impulse. This move signaled a potential shift in momentum, as buyers appeared to take control and drive the price away from the major support zone near the 1.1600 level. Currently, following this upward breakout, the price is approaching a critical test at resistance 1. This area, centered around the 1.1700 level, is significant as it previously acted as a key pivot point and support inside the downward channel. The current price action is a classic scenario where old support is being retested as new resistance, which will determine the validity of the recent bullish move. Despite the recent breakout, I expect the upward momentum to fail as the price challenges the resistance zone 1 around 1.1700. I anticipate a rejection from this level, which would confirm the breakout as a false move and re-establish the dominant bearish trend. The primary target for the subsequent decline is the major support level at 1.1600. For this reason, my goal is set at the 1.1600 level. If you like my analytics you may support me with your like/comment ❤️
Disclaimer: As part of ThinkMarkets’ Influencer Program, I am sponsored to share and publish their charts in my analysis.
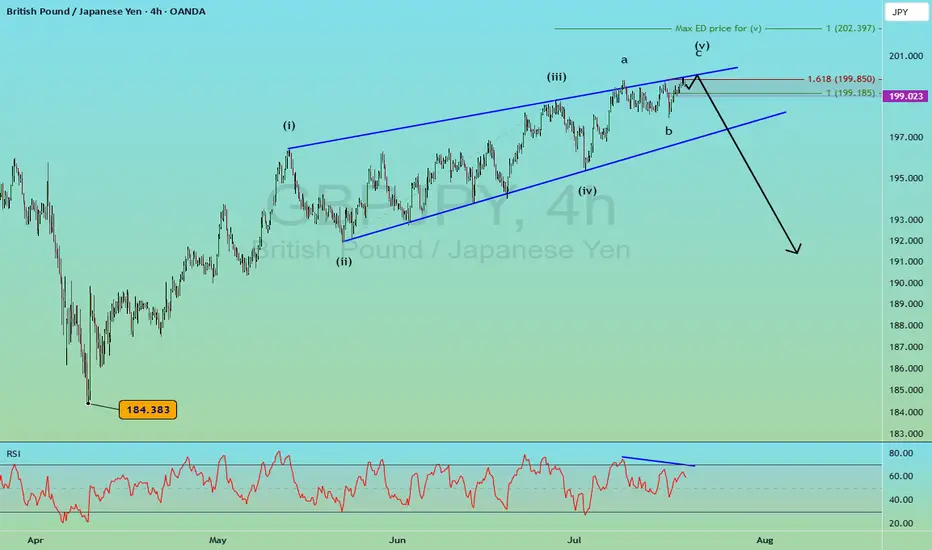
GBPJPY Large Reversal Pattern [Elliott Wave]Executive Summary:
GBPJPY shaping a diagonal pattern.
Large bearish reversal could push down to 184.
Above 202.40 voids the pattern as labeled.
I typically don't conduct Elliott wave analysis on cross pairs simply because they are the children of the two main currencies involved. GBPJPY is the child of GBPUSD and USDJPY.
With that said, I still scroll through charts looking for compelling patterns and GBPJPY caught my attention.
First, it's knocking on the door of 200...a nice round number.
Secondly, the rally from 184 in April to now appears to be a very mature Elliott wave ending diagonal pattern .
Diagonals shape in 5 waves. Remember, wave 3 cannot be the shortest of waves 1,3,5. Since wave 3 is shorter than wave 1, that means wave 5 cannot be longer than wave 3.
So we simply measure out wave 3 and apply it to the end of wave 4, and, voila, we have a maximum target for wave 5 at 202.40 .
That maximum target doesn't mean GBPJPY has to go that high, but this market is ripe for a large bearish turn. If GBPJPY does push above 202.40, then my wave labeling is incorrect.
Ending diagonals tend to be fully retraced which implies a decline back to 184 ... 1500 pips from today's price.
GBJPY may dance around in the 199 handle for a day or two.
A break below 199 could be an early warning signal of the bearish reversal. A break below the blue support trend line helps confirm the pattern.
If this bearish reversal takes hold, then GBPUSD or USDJPY likely experiences a large decline too.
BTCUSD - GOOD SUPPORT ESTABLISHED?BTCUSD - GOOD SUPPORT ESTABLISHED?📈
Yesterday, after a record-breaking nine-hour House session, U.S. lawmakers passed three major crypto bills: CLARITY Act (294-134), which establishes a market structure for cryptocurrencies, GENIUS Act (308-122) that supports U.S. stablecoin innovation and an Anti-CBDC Surveillance State Act (219-210) that opposes central bank digital currencies. All of this supports crypto and especially Bitcoin.
Technically, BTCUSD looks bullish also, establishing a new bullish trend. I expect the ATH at 123,190.30 will be rewritten soon. Where will be the next stop, I've got no idea. To my mind, the best strategy here will be to buy on trend support, then transfer the stop loss at your entry point and sell o local hikes.
Stay tuned for the next report! 🔔

USNAS100 | Consolidation 23010 - 22900, Bearish or Not Yet...USNAS100: Cautious Consolidation as Powell Uncertainty Lingers
Following political noise around Fed Chair Powell — with Trump admitting he floated the idea of replacing him — tech markets have entered a cautious consolidation. While no immediate action was taken, the underlying uncertainty continues to weigh on sentiment, especially in rate-sensitive sectors like tech.
Technically: Consolidation Before the Break
The price is currently consolidating between 22900 and 23010.
A confirmed 1H close below 22900 would signal the start of a bearish trend, targeting 22700 and 22615.
Conversely, a close above 23010 would open the path toward a new all-time high (ATH) at 23170.
Key Levels:
Support: 22700, 22615
Resistance: 23010, 23170

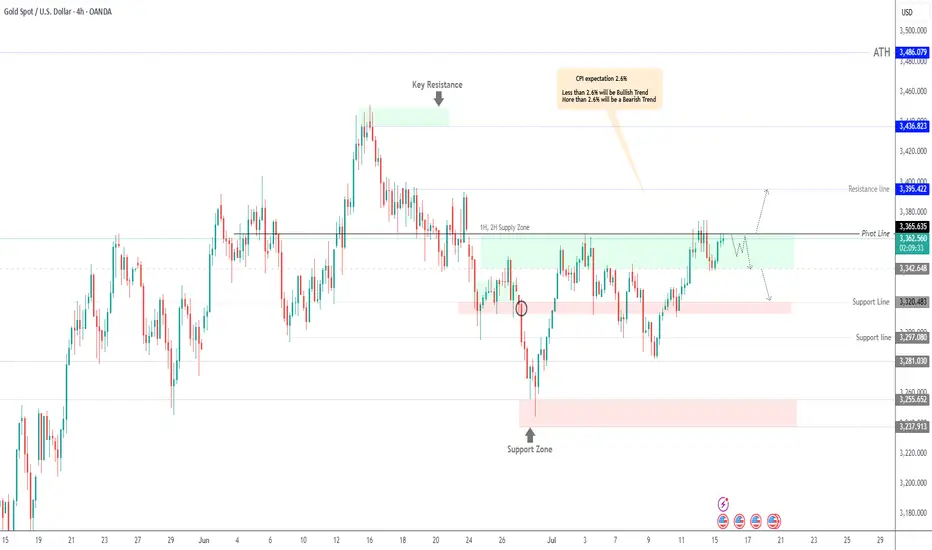
GOLD Under Pressure – CPI to Drive the Next MoveGOLD Outlook – Bearish Below 3365, CPI in Focus
Gold is showing bearish momentum while trading below 3365, with a likely move toward 3342.
However, if the price closes a 1H or 4H candle above 3365, it may shift to a bullish trend targeting 3395.
CPI data will be the key factor in determining the next move.
The market expects a print of 2.6%, which would signal no Fed rate cuts this year due to rising tariff pressures.
That said, we expect a 2.7% release, which would likely support a bearish trend for gold.
But if the release is less than 2.6% that will support the bullish trend.
Pivot Line: 3365
Support: 3342 – 3320
Resistance: 3375 – 3395
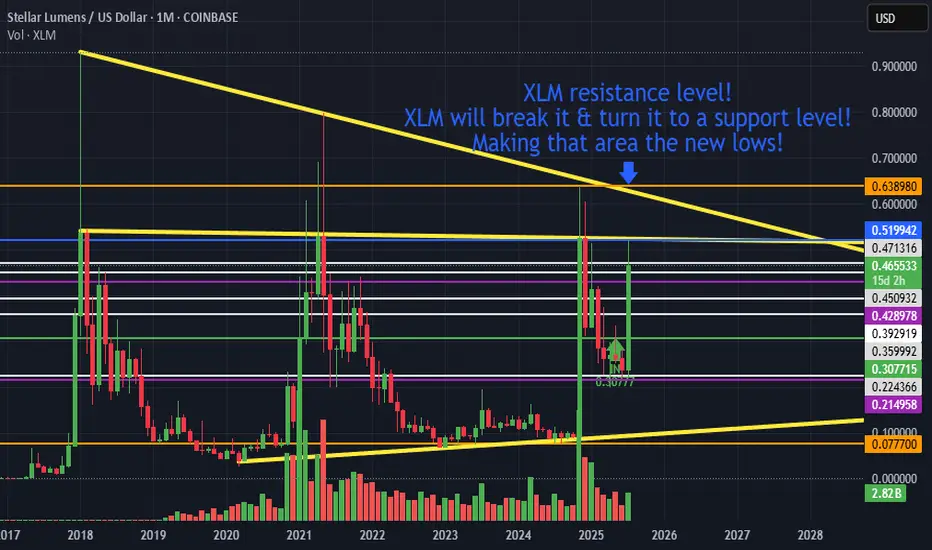
XLM new lows!XLM resistance level!
XLM will break it & turn it to a support level!
Making that area the new lows!
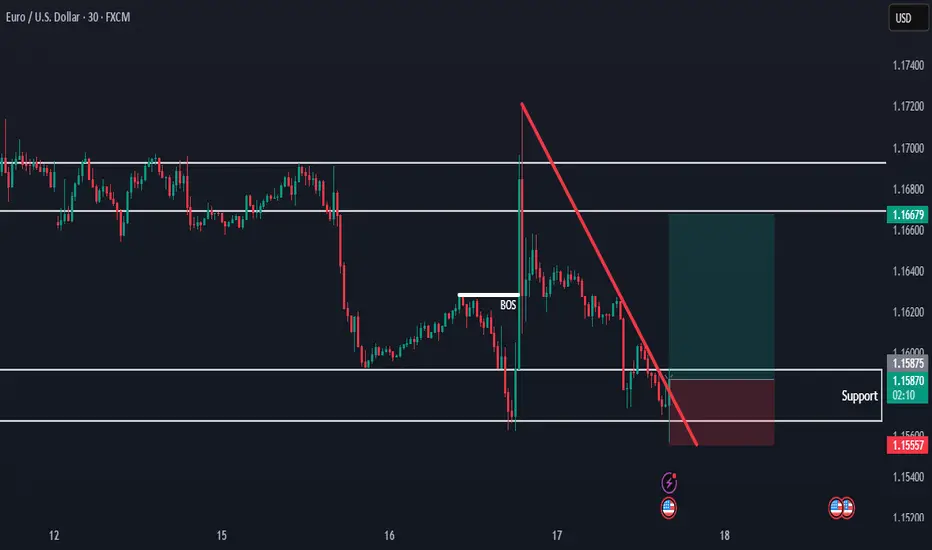
EURUSD Holding Support — Bullish Move in ProgressHello everybody!
There is a strong higher timeframe resistance now acting as support.
Price is respecting this area and starting to form a strong move to the upside.
We are looking to enter a buy position here, as the overall bullish trend is likely to continue.
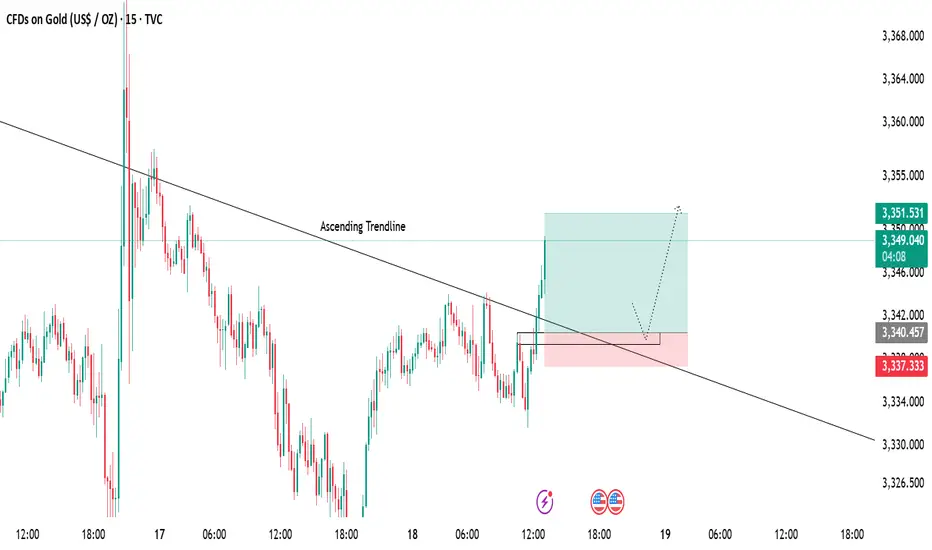
Gold 15-Min Chart Analysis Alert!Gold has successfully broken above the descending trendline, showing early signs of bullish momentum. Price has reclaimed structure and is now trading above the breakout level.
📌 Retest Zone:
We can expect a possible pullback towards the marked zone for a healthy retest before continuing the upward move.
🎯 Bullish Target:
As long as price holds above the support area, the bullish bias remains intact with targets around 3351+.
MOODENGUSDY near major resistance zone (Possible breakout ahead)As we can see price is near last and major resistance zone which is red trendline resistance and valid breakout here to the upside cause huge amount of rise and pump like green arrows on chart.
DISCLAIMER: ((trade based on your own decision))
<<press like👍 if you enjoy💚

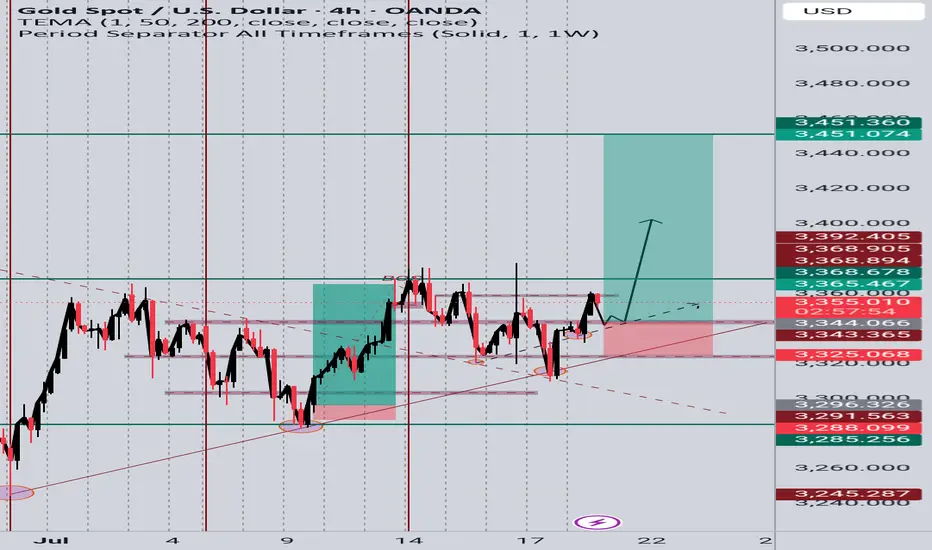
GOLD (XAUUSD) Long Idea – Breakout Confirmation📆 Timeframe: 4H
📈 Type: Long (Buy)
🎯 Entry: Around 3348-3355
🎯 Target: 3451
NOTE: Price has respected the ascending trendline from early July.
Clean breakout from a consolidation range after several rejections near 3365 resistance.
Bullish structure confirmed with higher lows and higher highs.
Fibonacci levels and support zone at ~3344 are holding strong.
Targets set at prior resistance zone (~3451), aligning with liquidity zone.
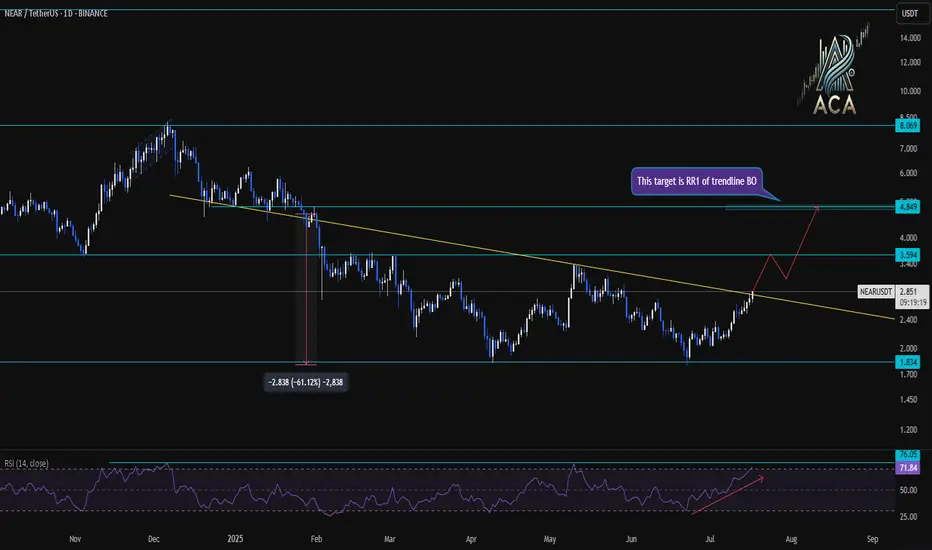
NEARUSDT Daily Chart Analysis|Strong Breakout & RSI ConfirmationNEARUSDT Daily Chart Analysis | Strong Breakout & RSI Confirmation
🔍 Let’s break down the latest NEAR/USDT daily chart, spotlighting critical resistance, target levels, and momentum signals.
⏳ Daily Overview
NEAR has confirmed a bullish breakout above its long-term descending trendline. This move comes with a surge in price and a strong daily candle—clear evidence of renewed bullish momentum.
📊 Momentum & RSI
RSI has surged to 76 (overbought zone), higher than the typical overbought level of 70. This spike reflects strong buying pressure, but also signals the possibility of near-term pullback or consolidation.
RSI-Momentum Convergence: The RSI uptrend is in lockstep with price action, confirming that bullish momentum is genuine and backed by increasing strength—not a divergence.
🔑 Key Levels
- First Resistance: $3.59—watch this closely as the next hurdle for bulls.
- Breakout Target: $4.85, which corresponds to the measured move (RR1) from the trendline breakout and aligns with the next horizontal resistance.
- Extension Target: $8.01 if momentum persists and price sustains above $4.85 in the coming weeks.
📌 Highlights
- Clear trendline breakout validated by strong RSI convergence.
- RSI has entered the overbought zone (76), backing momentum—watch for either breakout follow-through or brief cooling.
- Key levels: $3.59 (first resistance), $4.85 (breakout target).
🚨 Conclusion
Momentum is with the bulls after the breakout. Eyes on $3.59 as the near-term test; a clean move above opens up $4.85 and potentially $8.01 if momentum continues.