XLM – Bottom In, Eyes on $1+
XLM looks bottomed—hard to ask for a better setup than this.
Invalidation is clear: new lows. But as it stands, this is a clean weekly block retest that looks ready to launch.
From here, I’m expecting the move to begin.
See you above $1 CRYPTOCAP:XLM $XLMUSDT.
Trend Lines

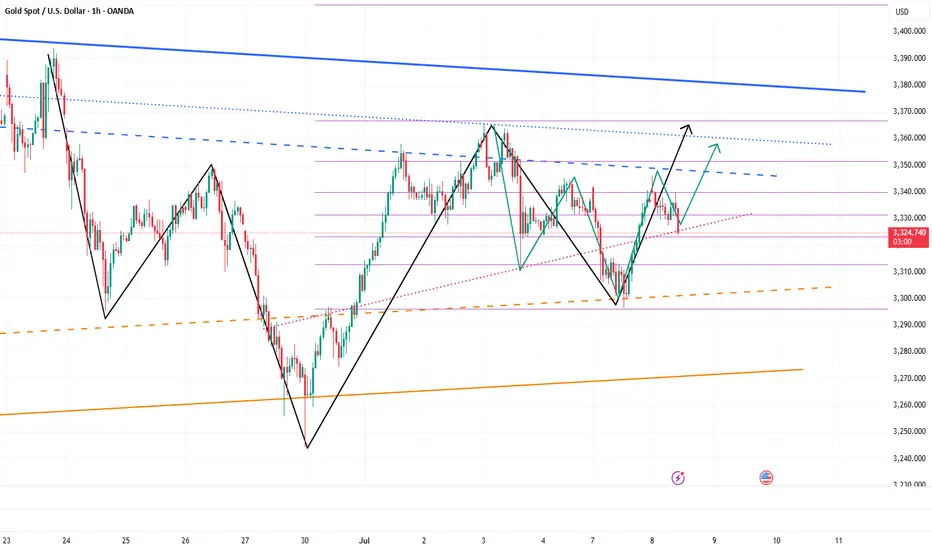
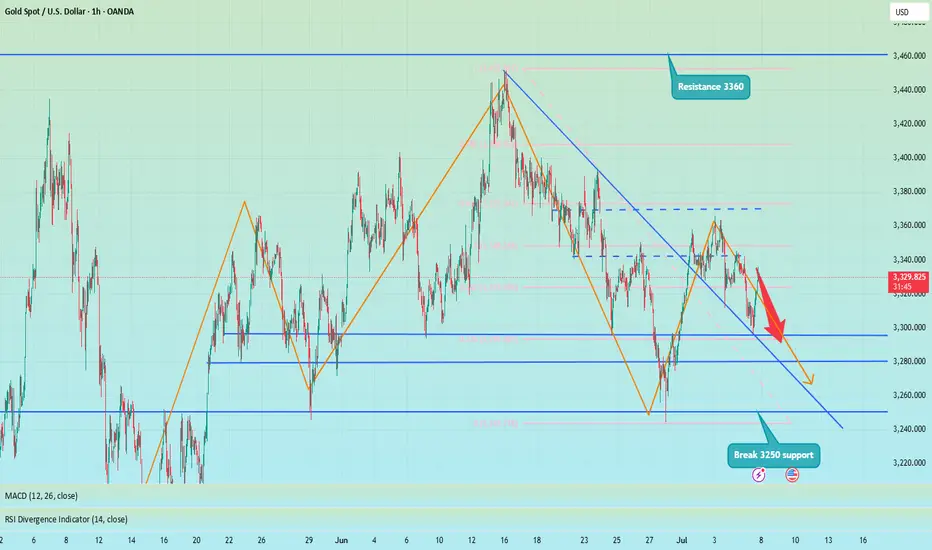
Gold is expected to regain bullish momentum and continue to 3360Yesterday, gold rebounded from 3296 and was able to reach around 3345. Although the process was rather painful, we have to admit that gold bulls still have the energy to wrestle with bears, and the gold market is not one-sidedly dominated by bears. As gold gradually tested and confirmed the effectiveness of support during the retracement process and then rebounded effectively, the short-term structure of gold gradually changed and began to favor bulls.
After gold hit bottom and rebounded yesterday, we can clearly see from the short-term structure that gold has successfully constructed a head and shoulders bottom structure in the three areas of 3295-3244-3296 in the short term, thus playing an absolute supporting role in the structure; and in the process of repeated testing of gold, there are signs of constructing a head and shoulders bottom structure in the three areas of 3310-3296-3325 locally again. Under the effect of the structural support resonance of the head and shoulders bottom, gold may not go below 3320 again, and may even regain the bullish trend and continue to the 3345-3355 area.
So I think there is a lot of profit potential in going long on gold. We can go long on gold with the 3330-3320 area as support and look towards the target area: 3340-3350-3360
GBP/JPYGBP/JPY has been bullish since April, since then price has reached a significant key area at 199.000-200.000. Over the next few days/weeks i shall be watching this pair to see if price rejects this key zone or if its able to push through. This will determine my next move as to whether we go short or long.

selling opportunity from resistance level-ForexbdNZDJPY is at a price resistance level in the H-4 market, so it is expected that the market will go into a downtrend from this level.
You can share your opinion.
⭕️Risk Warning : Trading on financial markets carries risks!
©FXBD Official Team

EURUSD Setup Scenario A – Bearish Continuation:
🔻 Sell near 1.17300–1.17340 (Resistance Zone)
🎯 Target: 1.17200 or lower
📉 Stop Loss: Above 1.17350
Scenario B – Bullish Breakout:
🔼 Buy if price breaks above 1.17350 with volume
🎯 Target: Next resistance zone (e.g., 1.17450 or more)
📉 Stop Loss: Below 1.17280
🧠 Summary:
Market is consolidating after a drop.
Watching for breakout above resistance or breakdown below support for next move.
Currently, the bias is slightly bearish, but breakout scenarios must be monitored.

GBPUSD Chart Analysis & Scenarios✅ Bullish Breakout (if breaks 1.3666):
Target: 1.3680–1.3700
Confirmation: Price closes above resistance with strong volume
❌ Bearish Rejection (if rejected at 1.3637–1.3666):
Target: 1.3610, possibly 1.3588
Watch for: Bearish candlestick pattern at resistance + drop in volume
✅ Summary:
GBP/USD is recovering strongly but faces heavy resistance at 1.3637–1.3666.
Breakout above could open room toward 1.3700.
Rejection likely if momentum weakens near resistance, targeting previous lows.

Bullish trade idea for EUR/JPYBullish trade idea for EUR/JPY:
Buy near 171.15
Take Profit at 171.78
Stop Loss below 171.10
Risk Management is important

SEI | Waiting for a Higher LowSEI/USDT is currently setting up for a potential higher low formation, but confirmation is still pending. The price action shows promise but requires patience for the setup to materialize.
Current Situation:
Price is testing the orange ascending trendline support around $0.21
Waiting for a confirmed bounce to establish the higher low
The projected path (pink arrow) outlines the anticipated bullish trajectory
Key Levels to Watch:
Critical Support: Orange trendline around $0.21 (must hold)
Confirmation Level: Clean bounce above $0.22-0.23
Target: $0.33 resistance zone if higher low confirms
What's Needed:
Strong rejection from current support levels
Volume increase on any bounce attempt
RSI showing bullish divergence signals
Risk Factors:
Break below orange trendline would invalidate the setup
Failure to establish higher low could lead to further downside
Market conditions may impact the pattern's success
This is a wait-and-see scenario where patience is key. The higher low formation will only be confirmed once price demonstrates clear rejection from support and begins moving higher.

Go long again when the gold range falls back
Yesterday, gold rebounded from the bottom, reaching the lowest point of 3296 and then rebounded. The gold price in the Asian and European sessions continued to weaken under the pressure of 3342. The European and US sessions fell and broke through the 3300 mark and continued to fall to around 3296, stabilized and rebounded. The US session ushered in a deep V rebound. Finally, the gold price rebounded and broke through and stood above the 3330 line, closing at 3336. This morning, it opened at 3338 and reached the highest point of 3345 and then stepped back. The daily K line closed at the bottom and rebounded. The overall gold price once again showed a support and stabilization pattern near the 3295-3301 line and rebounded. If your current gold operation is not ideal, I hope I can help you avoid detours in your investment. Welcome to communicate with us!
From the 4-hour analysis, the short-term support at 3318-3324 is concerned, and the short-term resistance at 3345-50 is concerned. The suppression at 3365-70 is focused on. The overall high-altitude low-multiple cycle participation is maintained unchanged. In the middle position, watch more and do less and follow orders cautiously. Keep the main tone of participation in the trend and wait patiently for key points to participate.
Gold operation strategy:
1. Go long at 3318-3324, stop loss at 3312, target at 3345-50, and continue to hold if it breaks;
2. Go short at 3345-50 when gold rebounds, stop loss at 3357, target at 3318-24, and continue to hold if it breaks;

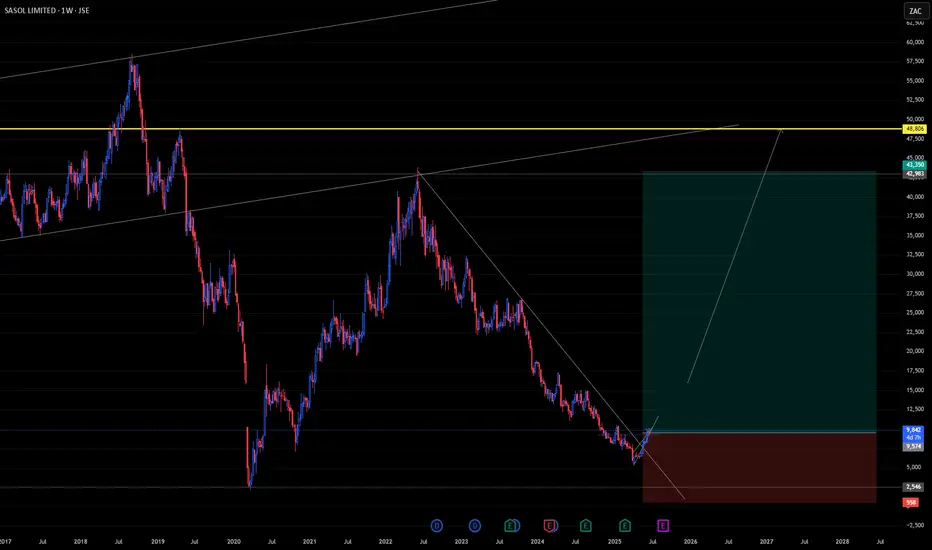
SOL Long Term Long PositionJSE:SOL credit rating has been stamped with a Ba1 by Moody's which is very unfavourable to the company, wholistically. This is as a result of its weakening operating performance mainly attributed to low demand in the chemicals market and weak oil prices.
With expectations of higher FX:USOIL prices and JSE:SOL being pretty much undervalued, trading near its supporting level of 8600 ZAC, a positive outlook is still evident. Long positions have been executed at 9574 ZAC with a possibility to further capitalize when necessary.
Cite: Sasol outlook downgraded to negative by Moody's Ratings, Ba1 rating affirmed - Luke Juricic
GOLD → Correction for confirmation before growthFX:XAUUSD is recovering due to increased demand as a safe-haven asset. After breaking through local trend resistance, an upward channel is beginning to form on the chart.
On Monday, gold tested the 3295-3300 zone (liquidity zone) and, against the backdrop of incoming economic data, is buying back the decline, forming a rather interesting pattern that could lead to continued growth, but there is a but!
Investors are reacting to President Trump's threats to impose tariffs on imports from a dozen countries starting August 1. In addition, the main question is the Fed's interest rate decision. The regulator is likely to leave the rate unchanged due to inflation risks.
Uncertainty surrounding tariffs is supporting interest in gold as a safe-haven asset. The market is awaiting further news and the publication of the Fed minutes on Wednesday.
Resistance levels: 3345, 3357, 3396
Support levels: 3320, 3311, 3295
A correction to support is forming. If the bulls hold their ground within the upward channel and above the key areas of interest, the focus will shift to 3345, a resistance level that could hold the market back from a possible rise. A breakout of this zone would trigger a rise to 3357-3396.
Best regards, R. Linda!

EURO/USD SELL SETUP "Euro/USD Potential Sell Zone: Price approaching key resistance at 1.17634,to 1.17735 with a potential reversal in sight. Selling opportunity on the horizon? Target 1ratio 3 . Let's short the Euro! 📉💡 #EuroUSD #SellZone #ForexTrading"

Gold (XAU/USD) Structure Analysis : Trendline Break + TargetGold is trading around $3,338, positioned at a decisive point where both bullish momentum and bearish pressure are converging. The price action over the past few weeks suggests a brewing breakout, supported by multiple technical factors. This analysis provides a complete breakdown of what’s happening and what to anticipate next based on the current structure.
🔹 Market Structure & Context
Since mid-May, XAU/USD has been trading within a rising price channel, respecting a well-defined ascending trendline support. This rising support zone has provided a floor for buyers to step in, especially during pullbacks, which demonstrates consistent buying interest and underlying bullish sentiment.
At the same time, gold has also been respecting a descending trendline resistance formed by multiple lower highs. This forms a squeeze pattern, suggesting that the market is building energy for a breakout. As price compresses within this wedge-like structure, the tension between bulls and bears grows, setting the stage for a sharp directional move.
This is a classic accumulation vs. compression scenario, where the outcome of the breakout will dictate short-to-medium-term direction.
🔹 Channel Support Zone – Buyer’s Stronghold
The channel support zone is critical here. This area, visible as a bold upward sloping line, has provided reliable support through repeated market cycles. It acts as a dynamic line where institutions and swing traders accumulate long positions during dips. The fact that price has respected this trendline for over a month signals the importance of this structure in current market psychology.
Any break below this zone would invalidate the bullish bias and open the door for a steeper decline. However, as long as price stays above this line, the buyers retain control.
🔹 Trendline Resistance – Key Barrier to Break
The descending trendline resistance, drawn from mid-June highs, has been a significant cap on upward moves. Each test of this trendline has resulted in a rejection, pushing price back into the range. Now, gold is testing this level again — and this time, the setup is stronger for a potential breakout due to growing momentum and multiple rejections weakening the resistance.
From a technical standpoint, the more a resistance level is tested, the weaker it becomes, and the higher the probability of a breakout.
🔹 Break of Structure (BOS) Zones – Momentum Confirmation
The chart marks both Minor BOS and Major BOS zones. These are crucial areas to watch for price confirmation.
The Minor BOS, just above the current price (around $3,360), represents a short-term structural shift. A clean break above this with strong candles and volume could trigger a momentum rally.
The Major BOS, located in the $3,400–$3,420 area, is more significant. This is the last major swing high. If gold manages to break and hold above this zone, it would confirm a complete bullish reversal in market structure — turning what was once a lower-high pattern into a potential new uptrend.
These BOS levels act as validation checkpoints for trend direction. Without a clean break, the move is unconfirmed and prone to reversal.
🔹 Next Reversal Zone – Anticipated Reaction Area
Above the BOS zones lies the Next Reversal Zone, marked in green. This is a potential area of resistance or profit-taking, based on historical price reactions, Fibonacci confluence, and psychological levels. This area spans approximately $3,420 to $3,440, which is where price might pause, consolidate, or reverse depending on momentum.
This zone doesn’t necessarily mean price will reverse immediately, but it’s a smart area for traders to monitor reactions or start managing their risk.
🔹 Price Action Flow – What Could Happen Next?
Currently, gold is testing both the trendline and the minor BOS, building momentum around this critical zone. There are two primary paths forward:
If gold breaks the descending trendline and confirms above the minor BOS:
Expect a move toward the major BOS at $3,400.
A successful break of this zone opens the path to the next reversal zone ($3,420–$3,440).
Bulls gain clear control and the market may attempt a sustained breakout continuation.
If gold gets rejected again at the trendline:
Price could drop back toward the channel support, between $3,280 and $3,250.
This would maintain the current consolidation range, with further testing likely before a breakout.
Bears may gain temporary control, but only a break below the ascending channel would signal a trend shift to the downside.
🔹 Why This Setup Matters
This chart captures a textbook breakout setup — compression at a trendline, rising channel support, and BOS zones layered in. These kinds of technical setups often precede strong moves because:
Volume typically increases after breakout zones are breached.
Market participants are watching the same structure, making reactions more predictable.
Risk-to-reward becomes favorable with tight invalidation points.
For disciplined traders, this is a high-probability environment to wait for confirmation and trade the reaction, not the anticipation.
🔹 Risk Management Reminder
It’s essential not to chase breakouts prematurely. Look for:
Strong bullish candles breaking key resistance.
Retests of broken trendlines turning into support.
Volume confirmation (spikes can signal genuine breakout vs. fakeout).
Also, be prepared for false breakouts, especially during overlapping macroeconomic events or low liquidity sessions.
🧭 Final Thoughts
This is a powerful confluence zone for gold, and whichever side breaks it will likely control the next leg. Whether you're a day trader or a swing trader, this is a must-watch area on your chart.
Stay alert, trade with confirmation, and respect your risk parameters.

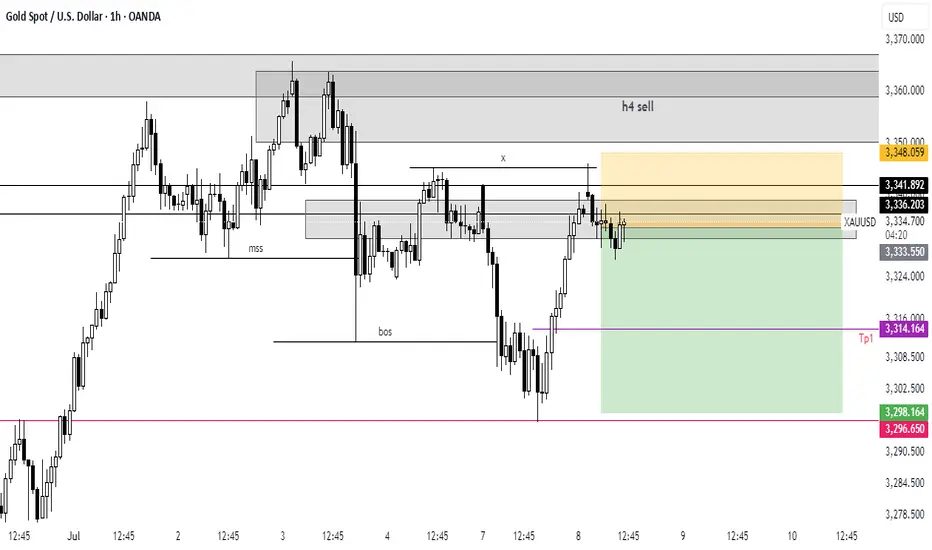
Below 3360, short sellers still have profit potential!Although gold has steadily rebounded to around 3345, compared with yesterday's gold falling below 3330 again, the rebound in the short term is not strong; overall, gold is still in a weak and volatile pattern, with pressure from the upper side at 3350-3360; and there is technical buying support in the lower 3300-3290 area. It is under the influence of the resistance area and the support area that gold lacks continuity.
So before gold breaks through effectively, I think both the long and short sides of gold have profit potential, so for the current short-term trading, we can temporarily maintain the high-sell-low-dregs trading within the range.
1. Consider shorting gold in batches with 3345-3365 as resistance, TP: 3330-3320-3310;
2. Consider going long gold in batches with 3325-3305 as support, TP: 3345-3355-3365

🇪🇺 EURUSD – July 8 | Ranging After FakeoutAfter breaking Thursday’s low, EURUSD gave us 30 pips then started ranging right at that level. Today’s price action is mildly bullish, but likely just a retest of the 4hr bearish structure that’s formed.
📌 Key Levels:
🔼 Safe Buys:
Above 1.18075 (strong resistance)
→ Breakout = ~70 pip opportunity
🔽 Sells / Deeper Pullback:
Below 1.16869
→ Potential 60 pip drop into next liquidity zone
⚠️ Current range is tight and indecisive — not worth trading until we get a break.
Bias still bullish longer-term, but patience needed here.

XAUUSD SELLThe price has come to our poi so we are shorting from the zone .
please follow to support me .
Thank you !
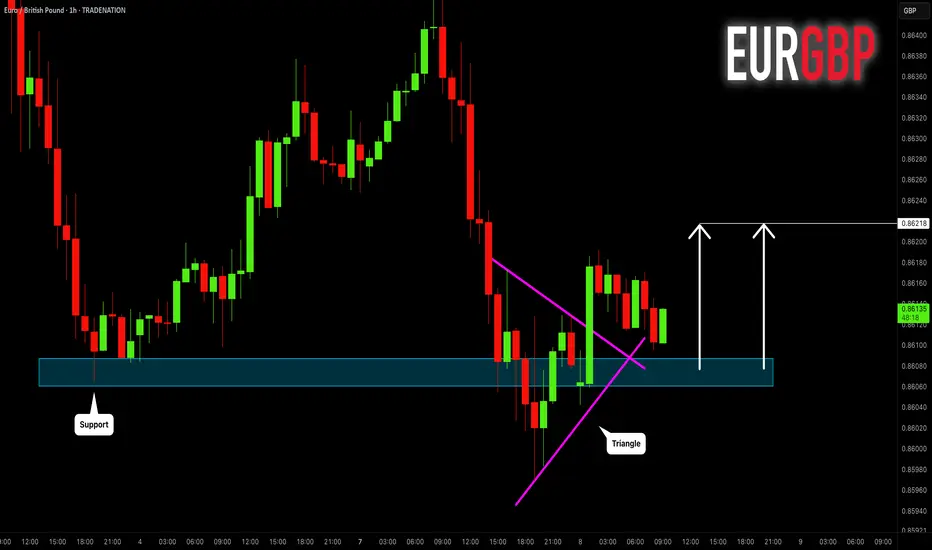
EURGBP: Bullish Move After False Breakout 🇪🇺🇬🇧
EURGBP will likely go up from a key daily/intraday support,
following a bullish breakout of a resistance line
of a bullish triangle on an hourly time frame.
The price may go up to 0.86218 level then.
❤️Please, support my work with like, thank you!❤️
I am part of Trade Nation's Influencer program and receive a monthly fee for using their TradingView charts in my analysis.
USDJPY InsightHello to all our subscribers!
Please feel free to share your personal opinions in the comments.
Don't forget to like and subscribe!
Key Points
- U.S. President Trump has officially announced that he will sign an executive order extending the reciprocal tariff suspension deadline to August 1st.
- Through a post on Truth Social, President Trump revealed that he had first sent tariff letters to allies South Korea and Japan, addressed directly to their heads of state, stating that a 25% tariff would be imposed on both countries starting August 1st.
- Hajime Takata, a member of Japan’s Monetary Policy Board, hinted at the possibility of additional rate hikes, stating: “If solid capital investment, wage increases, and the sustainability of price pass-through can be confirmed, we will need to shift gears one step at a time.”
This Week's Major Economic Events
+ July 8: Reserve Bank of Australia (RBA) Interest Rate Decision
+ July 9: Release of FOMC Meeting Minutes
+ July 10: Germany’s June Consumer Price Index (CPI)
+ July 11: UK May GDP Report
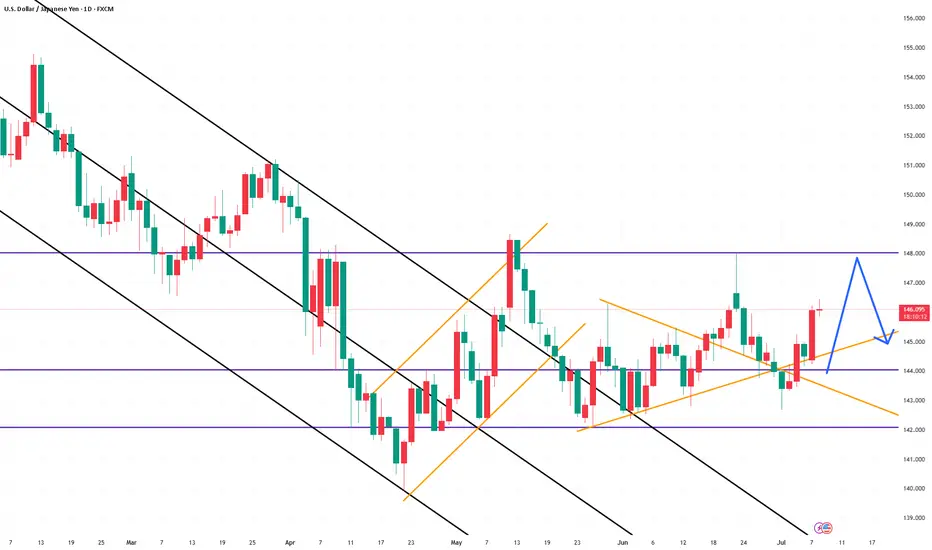
USDJPY Chart Analysis
The pair rebounded near the 142 level, showing upward momentum. This appears to reflect the impact of Trump’s announcement of high tariffs on Japan.
If negotiations proceed, the upward trend may stall. In such a scenario, a potential high around 148 is likely.
However, if the 148 level is breached, there could be an additional rally toward the 151 level.
NVIDIA (NVDA)-Trade PlanNVDA, After an explosive run powered by GenAI infrastructure and bullish earnings, the chart is setting up for either a bullish continuation or a healthy pullback.
With volatility tightening and volume compressing, this is a great moment to prepare for either breakout or breakdown scenarios.
🎯 Trade Plan – Tiered Long Setup
📌 Entry Zones (Tiered Buying):
🔹 $150
🔸 $140
🔻 $120
📈 Profit Targets:
TP1: $160
TP2: $175
TP3: $200+ – Long-term continuation play if AI macro momentum persists
📌 DISCLAIMER: This idea is for educational purposes only. Always use proper risk management and assess your own strategy

Shorts trapped? No, the head and shoulders top is still downOver the weekend, I gave a trading strategy for going long at 3315-3305. Today, I updated and optimized the long order trading, maintained the high-short-low-long trading strategy, and began to rebound near the 3300 line, and successfully touched the long TP 3333. At present, I am executing short trades again according to the trading strategy and holding short orders.
Although gold has only retreated to around 3330, I am not worried about losses and failures in short trades. As I wrote in today's post, the daily K-line chart has a head and shoulders top pattern. As long as the bulls fail to recover 3360, it is still a short trend. Therefore, in the short term, I still think that the rebound is a good opportunity for us to go short.
At present, the short-term bullish momentum of gold has been consumed and the downward trend continues. Therefore, I still insist on holding short orders in the short term.
In addition to investment, life also includes poetry, distant places, and Allen. Facing the market is actually facing yourself, correcting your shortcomings, facing your mistakes, and being strict with yourself. I share free trading strategies and analysis ideas every day for reference by brothers. I hope my analysis can help you.
FXOPEN:XAUUSD PEPPERSTONE:XAUUSD FOREXCOM:XAUUSD FX:XAUUSD FXOPEN:XAUUSD OANDA:XAUUSD TVC:GOLD
Seize the correction: It’s the right time to short goldThe current rebound is only a technical adjustment rather than a trend reversal. The rebound in the falling market is a good opportunity to arrange short orders. The hourly chart shows that the moving average pressure continues to move down to around 3340-3345. This position also serves as the long-short watershed in the previous intensive trading area, forming a key resistance barrier. If the gold price rebounds and approaches the area below 3345 and a stagflation signal appears or a top structure is formed, it can be regarded as a clear short signal. It is recommended to enter the market to seize the downward space. The current market direction is clear, and the exhaustion of the rebound is the best time to enter the market. Relying on the technical pressure level, the short position can be accurately arranged.

Gold fluctuates repeatedly, how to seize the opportunityIf the direction is right, you are not afraid of the long journey. Use time to witness your strength, use your strength to win the future, let trust become profit, and use profit to resolve doubts. The market is changing rapidly, and going with the trend is the kingly way. When the trend comes, just do it, don't go against the trend to buy at the bottom, so as not to suffer. Remember not to act on impulse when trading. The market is good for all kinds of dissatisfaction, so you must not hold orders. I believe many people have experienced this. The more you resist, the more panic you will feel, and the floating losses will continue to magnify, making you eat and sleep poorly, and you will miss many opportunities in vain. If you also have these troubles, then you might as well follow my pace and try to see if it can make you suddenly enlightened.
Gold is concerned about the short-term pressure of the 3316 line above, and focuses on the pressure of the 3325 line. If the pressure above the 3325 line is not broken, then the possibility of gold further breaking through the lower space to 3295-3300 in the short term will also increase significantly. Therefore, the main line of gold operation is still based on holding shorts and rebounding shorts. Gold can rebound to the 3316 line and 3325 line before considering participating in short shorts. In terms of operation, we first pay attention to the support of the 3295-3300 line. If the lower support is broken today, the market will reverse to the short side. Otherwise, we will continue to rebound from the bottom and look for opportunities to go long.
From the current trend of gold, pay attention to the support of the 3300-3295 line below, the short-term resistance above pays attention to the vicinity of 3316, and focus on the suppression of the line near 3325. The overall main tone of high-altitude low-multiple cycle participation remains unchanged. In the mid-line position, keep watching and do less, follow orders cautiously, keep the main tone of participating in the trend, and patiently wait for key points to participate.
Gold operation strategy:
1. Go long on gold around 3330-3295, target 3315-3320.
2. Go short on gold around 3315-3325, target 3305-3300.

Hard to find a "butter" trade than TOST - long at 42.49This is my first actual trade of TOST. No particular bias against it, just haven't traded it before. But looking at its paper results, I wish I had been.
Since the first of the year, it has outperformed QQQ more than 2:1 on a B/H basis, which I always like to see, but don't always get in a trade. But its 16.71% return pales compared to what I'd have gotten had I been trading it. It generated 16 signals since Jan 1.
The summed (non-compounded) return on those trades, collectively, would have been +49.2% and that includes an open signal that is down almost 5% right now. The average trade lasted 9 days (increased by one trade that lasted 56 days). The average gain in those 9 days was 3.08% (.33%/day or almost 8x the avg market return and 5x that of the QQQ so far this year). The median results were even better: +2.64% in 4.5 days (+0.59% per day held).
As a bonus here, the stock is well above its 200d MA and is at the upper edge of the GC overlay bullish ribbon (also a good sign of strength). Like Monday's idea, none of this guarantees success, but it ups the odds.
While I don't do price targets, the 1 open buy signal was triggered 4.77% above where the stock is now, so I expect that to be eventually taken out. But, it's been 6+ weeks since that signal already, so how soon is anyone's guess. I will likely take my profits when my profit taking signal clicks, be that in one day or in weeks. Maybe I'll get lucky and it will take out that 4.77% level in a hurry. 5 of the 16 trades so far this year have eclipsed that level, so it's not out of the question. We shall see.
The win is all I seek. What the market gods deign to give me in terms of magnitude and time required is up to them. I will accept it.
As always - this is intended as "edutainment" and my perspective on what I am or would be doing, not a recommendation for you to buy or sell. Act accordingly and invest at your own risk. DYOR and only make investments that make good financial sense for you in your current situation.
