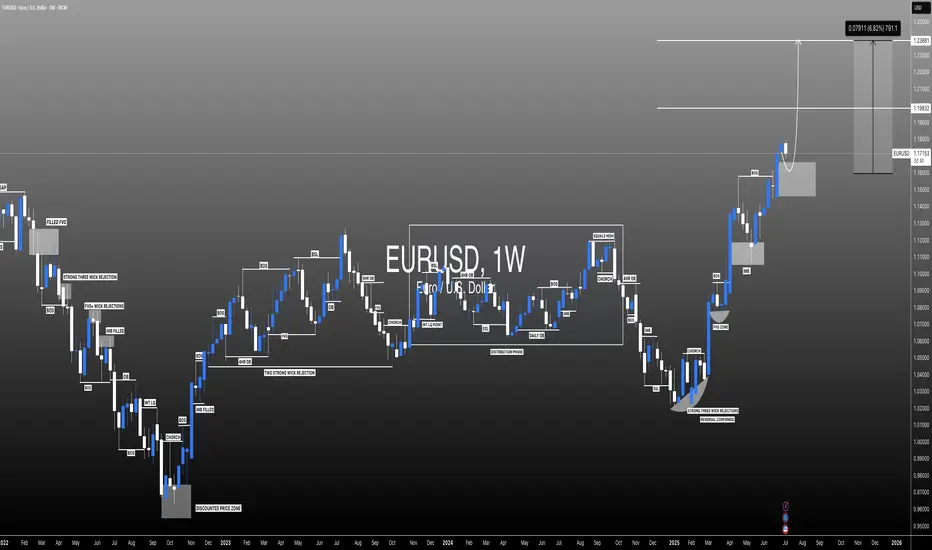
#EURUSD: Last Bullish Price Extension! Get Ready! EURUSD is approaching our buying zone, a key level, which suggests a smooth bullish reversal. As this is a swing trade, we advise keeping stop losses larger. There are two targets to keep an eye on. Remember, this is not a guaranteed move, and this is just our overview. Good luck and trade safely.
Team Setupsfx_
Trend Lines
Short-term gold bulls and bears are anxious,3330 becomes the keyAt present, the market has been fluctuating narrowly in the range of 3330-3320, and both bulls and bears are in a stalemate. However, gold has formed a double-layer head and shoulders bottom pattern, so the short-term bullish trend is definitely unchanged. In the previous post, I also mentioned that if the rebound in the European session is weak and gold continues to be below 3345, then the short-term NY session may usher in a retracement and a second bottom. Therefore, I still hold a long order of 3325-3315, and temporarily modify the TP to the 3335 line. I expect that there may be a retracement here, but there may also be a direct retracement. No matter what the situation is, we need to stabilize before entering the market.
In addition to investment, life also includes poetry, distant places, and Allen. Facing the market is actually facing yourself, correcting your shortcomings, facing your mistakes, and exercising strict self-discipline. I share free trading strategies and analysis ideas every day for reference by brothers. I hope my analysis can help you.
PEPPERSTONE:XAUUSD FOREXCOM:XAUUSD FX:XAUUSD FXOPEN:XAUUSD OANDA:XAUUSD TVC:GOLD

How to solve the problem of order being trapped in a loop📊 Gold Day Trading Strategy (Recommendation index ⭐️⭐️⭐️⭐️⭐️)
📰 News information:
1. The lasting impact of new tariffs
2. The impact of geopolitical conflicts
3. The Fed’s interest rate cut
📈 Technical Analysis:
The recent market conditions have been volatile. Many brothers have reported that they have been trapped recently. They have just been released from short positions, but have fallen into the situation of being trapped by long orders again. I have also encountered such a situation recently. Brothers who follow me must know that I have been trapped, but in the process of being trapped, I still share my trading ideas for the brothers who are trapped to check, so that we can all get out of the trap.
Gold fell as expected and hit the lowest point of 3287 before rebounding. The current 3300-3290 range given at the bottom has certain support. At present, I have answered it. As long as it does not fall below 3285, we can still go long and look for rebound correction. TP can temporarily look at 3305-3310. At present, the short-term upper watershed is near the 3321 line. As time goes by, the medium-term point can be seen at 3345. Only when the price stands above 3345 can the upward momentum continue to touch the 3380 line, or even 3400. In the short term, you can go long if you look at the support below. In the short term, pay attention to the resistance above 3315-3320. If it encounters resistance under pressure, it will fall back. On the contrary, after breaking through the first level of resistance, the upward trend will continue.
🎯 Trading Points:
BUY 3300-3290-3285
TP 3305-3315-3320-3345
SELL 3315-3321
TP 3300-3290
In addition to investment, life also includes poetry, distant places, and Allen. Facing the market is actually facing yourself, correcting your shortcomings, facing your mistakes, and exercising strict self-discipline. I share free trading strategies and analysis ideas every day for reference by brothers. I hope my analysis can help you.
TVC:GOLD OANDA:XAUUSD FXOPEN:XAUUSD FX:XAUUSD FOREXCOM:XAUUSD PEPPERSTONE:XAUUSD
JD.cm | JD | Long at $33.16Like Amazon NASDAQ:AMZN and Alibaba NYSE:BABA , I suspect AI and robotics will enhance JD.com's NASDAQ:JD automation in warehousing, delivery, and retail. There is some risk here, like other Chinese stocks, that they could be delisted from the US market if trade/war tensions rise. But I just don't think that is likely (no matter the threats) due to the importance of worldwide trade and investment. I could be way wrong, though...
NASDAQ:JD has a current P/E of 8.1x and a forward P/E of 1.2x, which indicates strong earnings growth ahead. The company is healthy, with a debt-to-equity of 0.4x, Altmans Z Score of 2.6, and a Quick Ratio of .9 (could be better).
From a technical analysis perspective, the historical simple moving average (SMA) band is still in an overall downtrend but starting to level out (accumulation of share area). It is possible, however, that the price may drop into the $20s to close out the existing price gaps on the daily chart as tariff threats arise. But that area is another personal entry zone if fundamentals hold.
Thus, while it could be a bumpy ride and the risk is there for delisting, NASDAQ:JD is in a personal buy zone at $33.16 (with known risk of drop to the $20s in the near-term).
Targets into 2028:
$44.00 (+32.7%)
$52.00 (+56.8%)

Alibaba | BABA | Long at $108.84Like Amazon, I suspect AI and robotics will enhance Alibaba's NYSE:BABA e-commerce, logistics, and cloud computing operations. There is some risk here, like other Chinese stocks, that they could be delisted from the US market if trade/war tensions rise. But I just don't think that is likely (no matter the threats) due to the importance of worldwide trade and investment. I could be way wrong, though...
NYSE:BABA has a current P/E of 14.2x and a forward P/E of 2x, which indicates strong earnings growth ahead. The company is very healthy, with a debt-to-equity of 0.2x, Altmans Z Score of 3.3, and a Quick Ratio of 1.5. If this were a US stock, investors would have piled in long ago at the current price.
From a technical analysis perspective, the historical simple moving average (SMA) band has started to reverse trend (now upward), indicating a high potential for continued (overall) price movement up. It is possible, however, that the price may reenter the SMA band in the near-term - the $80s aren't out of the question - as tariff threats arise. But that area is another personal entry zone if fundamentals hold.
Thus, while it could be a bumpy ride and the risk is there for delisting, NYSE:BABA is in a personal buy zone at $108.84 (with known risk of drop to the $80s in the near-term).
Targets into 2028:
$125.00 (+14.8%)
$160.00 (+47.0%)

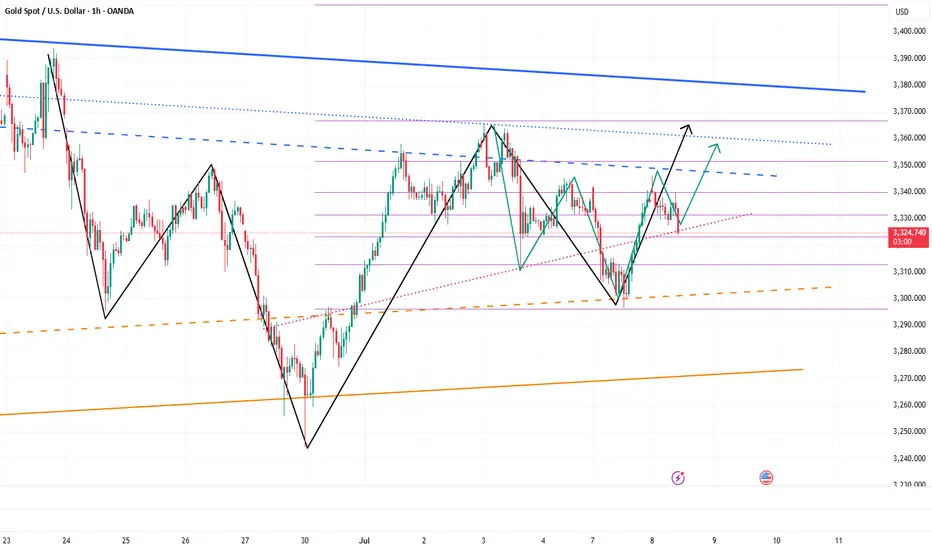
The shock continues, and the retracement continues to go long📊 Gold Day Trading Strategy (Recommendation index ⭐️⭐️⭐️⭐️⭐️)
📰 News information:
1. The lasting impact of new tariffs
2. The impact of geopolitical conflicts
3. The Fed’s interest rate cut
📈 Technical Analysis:
From the hourly chart, gold has formed a head and shoulders bottom. At present, 3320 below has formed a certain support in the short term. For now, the daily line still cannot close below 3320. If the daily line closes below 3320, the decline may open further. On the contrary, the current upper suppression position of gold is near 3350. If the daily line stands above 3350 again, it will be a bull-dominated trend and may test 3380-3390 above. In the short term, pay attention to the support line of 3325-3315 below. If it retreats to the support level, you can consider going long. Look to the resistance range of 3340-3350 above, and pay special attention to the suppression line of 3365-3370. At the same time, if the European session is always suppressed below 3345 and sideways, there is no performance, so you should consider selling it, and there may be further retreat in the evening.
🎯 Trading Points:
BUY 3330-3325-3315
TP 3340-3350-3365
In addition to investment, life also includes poetry, distant places, and Allen. Facing the market is actually facing yourself, correcting your shortcomings, facing your mistakes, and exercising strict self-discipline. I share free trading strategies and analysis ideas every day for reference by brothers. I hope my analysis can help you.
TVC:GOLD OANDA:XAUUSD FXOPEN:XAUUSD FX:XAUUSD FOREXCOM:XAUUSD PEPPERSTONE:XAUUSD

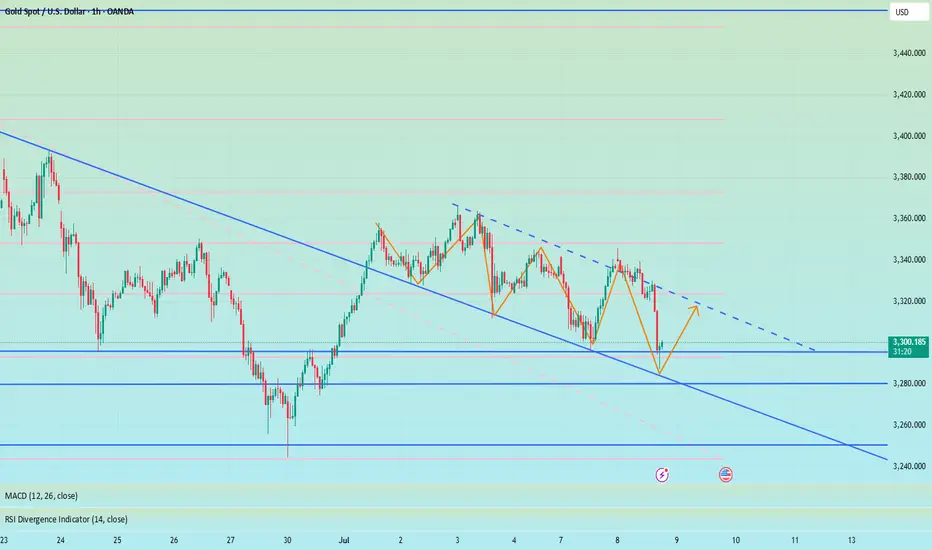
Gold Finds Supports – Is the Rebound About to Begin?Gold ( OANDA:XAUUSD ) declined to the Support zone($3,312-$3,290) and Support lines as I expected in the previous idea .
Gold is currently trading in the Support zone($3,312-$3,290) and near a set of support lines .
In terms of Elliott Wave theory , it seems that Gold has completed the Zigzag Correction(ABC/5-3-5 ) and we should wait for the next 5 impulse waves . One of the confirmation signs of the end of these corrective waves could be the break of the resistance line .
I expect Gold to trend higher in the coming hours and rise to at least $3,343 AFTER breaking the Resistance line .
Second Target: $3,364
Note: Stop Loss (SL) = $3,287
Gold Analyze (XAUUSD), 1-hour time frame.
Be sure to follow the updated ideas.
Do not forget to put a Stop loss for your positions (For every position you want to open).
Please follow your strategy; this is just my idea, and I will gladly see your ideas in this post.
Please do not forget the ✅ ' like ' ✅ button 🙏😊 & Share it with your friends; thanks, and Trade safe.

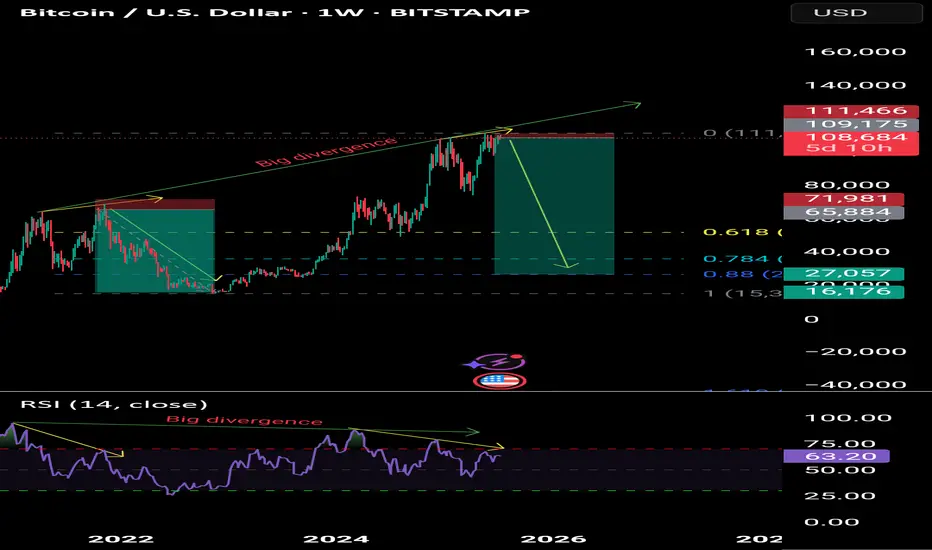
Bitcoin to the 30,000 levelBitcoin to the 30,000 level
On the weekly time frame, there is a negative divergence of Masoud and the winner is the one who keeps her sell trade below 30,000.

GBPUSD Sell analysis/ideaThis analysis is based on the daily and 4-hour timeframes and executed using reversal trading and trend formation. Complete explanation in the video!

NASDAQ Bulls Defend Pivot – Can 23,000 Break Next?USNAS100
The Nasdaq 100 is currently holding above the pivotal 22,720 level, supported by market optimism amid recent tariff-related developments from the White House.
Bullish Scenario:
Sustained price action above 22,720 keeps bullish momentum intact. A break and 1H close above 22,815 would confirm strength, opening the path toward the psychological milestone and potential all-time high at 23,000.
Bearish Breakdown:
A 1H or 4H close below 22,720 would invalidate the bullish bias and strengthen downside pressure, with initial support seen at 22,615 and deeper correction likely toward 22,420.
Key Technical Levels:
• Resistance: 22,815 · 23,000
• Support: 22,615 · 22,420

EURUSD Sell analysis/ideaThis trade is based on the daily and 4-hour timeframes and executed based on reversal trading and trend formation. Complete explanation in the video!

Gold Recovers on Safe-Haven Flows Amid U.S. Trade UncertaintyFX:XAUUSD – Market Overview
Fundamental Outlook:
Gold has recovered from prior losses, stabilizing on the back of renewed safe-haven demand amid escalating global trade tensions.
Analysts point to growing concerns over a broader U.S.-led trade war, which has pushed investors toward gold as a defensive asset. While President Trump has delayed the reimplementation of tariffs until August 1 to allow for negotiation, markets remain cautious, and volatility is expected to persist.
Technical Outlook:
Gold is currently trading above the pivot level at 3320, which has a consolidation within 3320 - 3342 range
Stability above 3342 would likely extend the rally toward 3365, with 3356 as an intermediate resistance.
However, a 1H candle close below 3320 could shift momentum back to bearish, targeting 3297 and 3281.
Support Levels: 3312 / 3297 / 3281
Resistance Levels: 3342 / 3356 / 3365

Gold's rise is consistent with my analysis
Today's market analysis and interpretation:
First, the weekly gold level: Last week, it closed with a positive K, and the closing price just returned to the lower track of the upward channel, and the 10-day moving average stood on it again; this does not rule out that the negative line break last week was an illusion; this week, the corresponding channel lower track resistance is just last week's high of 3365. Once it stands on the channel again, it is expected to gradually strengthen in the medium term
Second, the daily gold level: Yesterday, it closed with a long lower shadow cross K, so 3296 has a stabilization signal, and the wave of shocks after closing negative last week may end here; today, after filling the shadow line, it has to continue to try to be bullish, and when it breaks through and stands on the middle track, it can try to test 3400-3430
Third, the hourly gold level: Yesterday, the opening jumped and pulled up sharply, and then fell back immediately, falling from 3342 to 3296 under pressure, and the US market directly rose from 3296 to 3340; Today is exactly the same, with a gap up and a sharp pull, and it immediately fell back after touching the 3346 line. The Asian and European sessions fluctuated and stepped back to 3320; due to the loss of the middle track, there may be further room for decline before it breaks through again. The resistance is the middle track of 3330 and the upper track of the yellow channel at 3337. The support is 618 split support 3315, and further down is 3307 and 786 split support. If the support is stabilized, it will continue to be bullish. The short-term double top is 3345-46. If it breaks through and stands above, it can hit around 3365, or even 3400 and above.

COFFEE - My Commodity of ChoiceI've laid out a plan I'm looking at on one of my favorite commodities - COFFEE ☕😍
What makes it so hard is the predictability of the weather - nearly impossible for the future. However, it is odd to see that the price still bonces at key support and resistance zones, almost like any "stock". Which tells me regular market trading still applies despite the odd weather event.
The reason Coffee has fallen so hard over the past few months is supply - due to extremely favorable weather conditions, coffee supply is more than demand. Resulting, as market dynamics goes, in a drop of price.
It's unfortunate though that my favorite pack of beans at the supermarket has not gone down - weird how that works 🙄 I like a medium roast, Columbia single origin.
It's dropped -33% already, but I can clearly see the market structure entering bearish phase after the bullish phase, peak (the new high) and now likely a multi-month bearish season. The question is just where the price can bottom for such a well loved commodity.
I looked at past cycles, not too long ago we dropped roughly 44% during the bearish cycle, taking 2-3 years to move into accumulation before another impulse wave up. That places a target for entry exactly in the highlighted zone around $250ish.
But I wouldn't get too greedy on my favorite commodity, buying orders can't be too low either. This would likely have to be a multiyear hold. Pepperstone sells coffee on cash contract but I usually do futures. Pity that I didn't get in sooner, bullish cycles is also at least a 2 year journey. I'll sell when the weather is bad 😅
Next up? Chocolate for sure...

EURCAD positions for a buy! (Intraday opportunity) From what we see in H1 timeframe price is likely to trade bullish from the H1 support Level of 1.60071 technical analysis shows how price made a low at 1.59370 and a recent pullback at 1.59797 connecting the low and recent pullback gives us a nice trendline. a buy opportunity is envisaged from the current market price.

SHIB – One Last Chance for a MoveGiving CRYPTOCAP:SHIB one last shot to do something big.
It’s sitting at a strong pivotal level with some clean weekly SFPs forming.
A 2x looks doable, especially considering how well it’s been holding—though it may take time.
CRYPTOCAP:PEPE and CRYPTOCAP:DOGE are showing strength too, so SHIB isn’t alone here.
The key? CRYPTOCAP:BTC needs to cool off and give alts some breathing room over the next two months. Otherwise, BINANCE:SHIBUSDT could drop another 50%.

After repeated tug-of-war, where will gold go?At present, the gold market is divided between long and short positions. The Federal Reserve may maintain high interest rates, which weakens the investment appeal of gold; however, trade frictions and geopolitical risks provide safe-haven support for gold. Overall, market sentiment is mixed, with bulls lacking confidence, but bears have not been able to fully control the situation. Last week's strong non-farm data reduced market expectations for a rate cut in July, pushing up U.S. bond yields and the dollar, putting pressure on gold, which does not generate interest. In addition, Trump said on social media that he would impose a 10% tariff on countries that "support anti-U.S. policies." The market is waiting for the release of the minutes of the Fed's June meeting, which will more clearly show policymakers' views on the current economic situation and future policies, and may determine the direction of interest rates. If the minutes show that the Fed is inclined to maintain high interest rates for a longer period of time, gold prices may continue to face downward pressure.
From a technical perspective, gold was under pressure at a high level at the opening, so gold is expected to fall today. Today's key pressure level is 3345. Before the price effectively breaks through and stabilizes at 3345, any rebound is a short-selling opportunity; once it stabilizes at 3345, the bottom pattern is confirmed to be established, and the bulls will start an upward market. At this time, the short-selling idea should be abandoned. From a technical point of view, the 1-hour chart has shown a trend from weak to strong, and the Bollinger Bands are opening and diverging upward, indicating that the market may accelerate upward. Today's operation suggestion is to focus on low-long and high-short as a supplement. In terms of specific points, the lower support is 3327-3320, and the upper resistance is 3355-3360.
Operation strategy:
1. It is recommended to buy gold when it rebounds to around 3327-3320, with the target at 3340-3350.
2. It is recommended to sell gold when it rebounds to around 3345-3355, with the target at 3330-3320.

XLM – Bottom In, Eyes on $1+
XLM looks bottomed—hard to ask for a better setup than this.
Invalidation is clear: new lows. But as it stands, this is a clean weekly block retest that looks ready to launch.
From here, I’m expecting the move to begin.
See you above $1 CRYPTOCAP:XLM $XLMUSDT.

Gold is expected to regain bullish momentum and continue to 3360Yesterday, gold rebounded from 3296 and was able to reach around 3345. Although the process was rather painful, we have to admit that gold bulls still have the energy to wrestle with bears, and the gold market is not one-sidedly dominated by bears. As gold gradually tested and confirmed the effectiveness of support during the retracement process and then rebounded effectively, the short-term structure of gold gradually changed and began to favor bulls.
After gold hit bottom and rebounded yesterday, we can clearly see from the short-term structure that gold has successfully constructed a head and shoulders bottom structure in the three areas of 3295-3244-3296 in the short term, thus playing an absolute supporting role in the structure; and in the process of repeated testing of gold, there are signs of constructing a head and shoulders bottom structure in the three areas of 3310-3296-3325 locally again. Under the effect of the structural support resonance of the head and shoulders bottom, gold may not go below 3320 again, and may even regain the bullish trend and continue to the 3345-3355 area.
So I think there is a lot of profit potential in going long on gold. We can go long on gold with the 3330-3320 area as support and look towards the target area: 3340-3350-3360
GBP/JPYGBP/JPY has been bullish since April, since then price has reached a significant key area at 199.000-200.000. Over the next few days/weeks i shall be watching this pair to see if price rejects this key zone or if its able to push through. This will determine my next move as to whether we go short or long.

selling opportunity from resistance level-ForexbdNZDJPY is at a price resistance level in the H-4 market, so it is expected that the market will go into a downtrend from this level.
You can share your opinion.
⭕️Risk Warning : Trading on financial markets carries risks!
©FXBD Official Team

EURUSD Setup Scenario A – Bearish Continuation:
🔻 Sell near 1.17300–1.17340 (Resistance Zone)
🎯 Target: 1.17200 or lower
📉 Stop Loss: Above 1.17350
Scenario B – Bullish Breakout:
🔼 Buy if price breaks above 1.17350 with volume
🎯 Target: Next resistance zone (e.g., 1.17450 or more)
📉 Stop Loss: Below 1.17280
🧠 Summary:
Market is consolidating after a drop.
Watching for breakout above resistance or breakdown below support for next move.
Currently, the bias is slightly bearish, but breakout scenarios must be monitored.
