EUR/USD Overview - June 25: Why Did the Dollar Fall Again ?The EUR/USD currency pair continued its upward movement on Tuesday, which had stated on Monday. Let us recall that on Monday, everyone expected a "rollercoaster" right at the market open, i.e., during the night. However, the real action came closer to the evening. The first two trading days of the week were packed with events-of various kinds-capable of supporting both the dollar and the euro. So why did the U.S. currency fall out of favor with the market once again?
If we were to list all the reasons, one article certainly wouldn't be enough. so, let's start with the most local and obvious ones. As early as Monday, we mentioned that the dollar might benefit from another escalation in the Middle East, this time initiated by the U.S. But just think: can the dollar even hypothetically be considered a "safe haven" if one of the warring parties is the U.S.?
The second reason is that Trump launched a strike on Iran's nuclear facilities, and the next day, missiles were flying back-toward Qatar, Israel, and U.S. military bases. And. notably, Iran hit the American bases.
The third reason is that Trump thanked Iran for warning Washington in advance about the upcoming strike. Honestly, the only word that comes to mind here is "farce." Can this even be a war if the participants warn each other before launching attacks? Naturally, the market immediately concluded that this was not a war but a performance. That might be better in some ways-since human casualties were avoided, and that is most important. But at the same time, if the dollar had any hopes of strengthening due to a Middle East escalation, the market realized yesterday that this "escalation" was theatrical and staged.
And it gets even more bizarre. On Tuesday morning, Donald Trump announced a ceasefire. The U.S. President was so eager to establish peace somewhere-anywhere-that he declared the war over without waiting for any official statements from Iran or Israel. And just a few hours later, Iranian missiles took to the skies again. Once more, if this weren't about deadly weapons of mass destruction, the whole situation could be considered a comedy
For the res of Tuesday, Trump posted angry messages every half hour on his own social network, expressing his dissatisfaction not only with Iran but also with Israel. In the afternoon, Trump tried to persuade Israeli not to launch retaliatory strikes, and we're left wondering-does the U.S. President believe that Iranian and Israeli leaders check his Twitter feed before initiating missile attacks?
Frankly, we don' even know how to respond to this circus anymore. But the market certainly does. Why should it buy the dollar-even without the caveat "if Donald Trump remains president"? America has turned from a country with the strongest economy and military into a laughingstock. And these are just the reasons the dollar fell on Monday and Tuesday. Should we even bother listing why the U.S. currency has fallen for five months
The average volatility for the EUR/USD currency pair over the last five trading days as of June 25 is 74 pips, which is characterized as. " We expect the pair to move between the levels of 1.1551 and 1.1699 on Wednesday. The long-term regression channel is directed upward, indicating a continued bullish trend. The CCI indicator entered the overbought zone, which triggered only a minor downward correction
Nearest Support Levels:
S1 - 1.1597
S2 - 1.1475
S3 - 1.1353
Nearest Resistance Levels:
R1 - 1.1719
R2 - 1.1841
R3 - 1.1963
Trading Recommendations:
The EUR/USD pair continues its upward trend. Trump's foreign and domestic policies remain the strongest pressure factor on the U.S. dollar. Additionally, the market interprets or ignores much of the incoming data negatively for the dollar. We continue to observe a complete lack of interest in buying the dollar under any circumstances.
If the price is below the moving average, short positions remain relevant with targets at 1.1475 and 1.1353, though a significant decline in the pair is unlikely under current conditions. If the price is above the moving average, long positions can be considered with targets at 1.1699 and 1.1719 in continuation of the trend.
Explanation of Illustrations:
Linear Regression Channels help determine the current trend. If both channels are aligned, it indicates a strong trend.
Moving Average Line (settings: 20,0, smoothed) defines the short-term trend and guides the trading direction.
Murray Levels act as target levels for movements and corrections.
Volatility Levels (red lines) represent the likely price range for the pair over the next 24 hours based on current volatility readings.
CCI Indicator: If it enters the oversold region (below -250), or overbought region (above +250), it signals an impending trend reversal in the opposite direction.
Trend Lines

Gold encounters resistance at 3310-3320 and is about to fallAt present, gold has reached the 3300-3320 area as expected. As I mentioned in my previous article, we can consider shorting gold in batches in the 3300-3320 area;
Although gold once rebounded and stood above 3300, we can clearly see that when facing the short-term resistance area of 3310-3320, the bullish energy of gold has converged and began to show signs of stagflation, so the short-term resistance area of 3310-3320 is still valid.
Before gold breaks through 3310-3320, gold bears still have the upper hand. So as long as gold stays below 3310-3320 in the short term, don't be afraid of gold rebounds. Rebounds are opportunities to short gold. So I still tend to short gold at present, and have opened short gold positions according to the trading plan, hoping that gold can retreat to the target area: 3285-3275-3265. Do you think gold will fall as expected?

GBP/USD Testing Resistance at 2022 HighsSterling marked an outside weekly-reversal through slope resistance last week with the rally trading just below resistance into the close of the month at the 2022 swing high at 1.3749. Look for support at the June high at 1.3633 IF price is heading higher on this stretch with a breach / close higher exposing the 61.8% extension of the 2022 advance at 1.4003. Weekly support rests with the 78.6% retracement at 1.3414 with media-term bullish invalidation now raised to the April high-week close (HWC) at 1.3270.
-MB

GOLD → Recovery and retest of resistance. DowntrendFX:XAUUSD has been recovering since the start of the session thanks to a weak dollar, but further growth is uncertain. However, the price is still below the key range and important levels.
At the beginning of the week, gold rebounded from monthly lows amid a weakening US dollar, which remains under pressure due to trade disputes with Japan, uncertainty surrounding the budget, and expectations of a Fed rate cut in September.
However, the technical picture for gold remains bearish, and further dynamics will depend on new statements from Fed officials, labor market data, and Jerome Powell's speech on Tuesday.
Technically, after breaking through the global range support, the price is forming a correction and testing 3294. Before a possible rise to 3320 or to the 0.7 Fibonacci zone, a correction to 3271 may form, which will determine the further development of the situation.
Support levels: 3271, 3255, 3245
Resistance levels: 3294, 3320, 3347
A retest of 3295 (0.5) Fibonacci is forming. There is a possibility of a false breakout with a possible correction. If, during the correction, buyers keep the price above 3271 and return to retest 3294, we will have a chance to attempt growth to 3320 - 3347
Best regards, R. Linda!

HAL: fake breakdown and a possible bullish move.Stock: Hindustan Aeronautics Ltd NSE:HAL
• Timeframe: 1-day candles (each candle represents one day of trading)
1. Consolidation Zone: A grey rectangular box highlights an area of "consolidation" starting from around May 14th. This means the stock price has been trading sideways within a relatively narrow range, not showing a clear uptrend or downtrend.
2. Fake Breakdown: An arrow points to a price dip below the lower boundary of the consolidation zone. The annotation calls this a "fake breakdown." This implies that the price temporarily moved below the support level, but then quickly bounced back up.
3. Potential Trade Setup: The chart suggests a potential long (buy) trade based on the fake breakdown and the subsequent recovery.
• Entry Point: Around 4,897.55 (labeled "ENTRY" on the chart) which is the price at which the stock could be bought.
• Stop Loss: Around 4,733.75 (likely intended to be the "4733.60")
This is the level below which the trader would exit the position to limit potential losses if the price moves against them.
• Targets: The chart identifies three potential profit targets:
* Target 1: 5,087.85
* Target 2: 5,305.15
* Target 3: 5,497.80

RESPONSIVE INDUSTRIESResponsive Industries Ltd. is a specialized manufacturer of vinyl flooring, synthetic leather, and luxury vinyl tiles (LVT) used in infrastructure, automotive, and lifestyle segments. It has a growing international footprint, with exports contributing significantly to its revenue mix. The stock is currently trading at INR 237.00, showing a sharp uptick on the back of strong volume and renewed investor interest.
Key Levels
Support Levels: INR 137.05, INR 164.90, INR 199.30 Swing Level: INR 237.00 Possible Upside: INR 318.95, INR 363.30, INR 419.80
Technical Indicators
RSI (Relative Strength Index): At 51.18, the RSI signals a neutral to mildly bullish setup. While not yet overextended, it hints at improving strength following recent accumulation.
Volume: At 4.66M, volume has expanded alongside price, indicating strong institutional interest and increased market participation.
Sector and Market Outlook
Responsive Industries operates in the infrastructure-linked materials and engineered surface solutions space, benefiting from:
Rising demand for affordable and decorative flooring in commercial real estate and transit hubs
Government-backed infra investment in healthcare and education facilities
Global shift toward eco-friendly, customizable vinyl solutions
Risks include exposure to PVC price volatility, logistics and export cycle sensitivity, and fluctuating margins due to competition and input costs.
Latest Developments
Export Growth: Significant volume growth reported in key geographies including Europe and Middle East
Product Innovation: Launch of high-durability and antimicrobial vinyl flooring for institutional use
Financial Performance: Operating margins improved on the back of scale efficiencies and better realization per unit
Dividend Update
Responsive Industries declared a dividend of ₹1.50 per share, reflecting improved profitability and a consistent payout policy.
Analysis Summary
Responsive Industries is gaining upward traction after a prolonged base formation. With volume expanding and indicators turning constructive, the stock appears to be transitioning into a positive trend. Supported by sector tailwinds and operational leverage, it presents a compelling case for further attention among mid-cap industrial growth names.

The latest analysis and layout of gold in July made a good start📰 News information:
1. Geopolitical situation
2. PMI data
📈 Technical Analysis:
Yesterday, we gave the idea of looking at the upper resistance of 3310-3320. The 4H pressure is still at 3327. As long as this key resistance level is not effectively broken, gold will fall again. On the contrary, if it stabilizes above 3327, the trend may reverse. In the short term, pay attention to the upper resistance of 3327. If it is not broken, you can short with a light position. If it falls below 3300-3290, consider going long.
🎯 Trading Points:
SELL 3310-3320
TP 3305-3300
BUY 3300-3290
TP 3310-3320-3350
In addition to investment, life also includes poetry, distant places, and Allen. Facing the market is actually facing yourself, correcting your shortcomings, confronting your mistakes, and strictly disciplining yourself. I hope my analysis can help you🌐.
TVC:GOLD FXOPEN:XAUUSD PEPPERSTONE:XAUUSD FOREXCOM:XAUUSD OANDA:XAUUSD TVC:GOLD

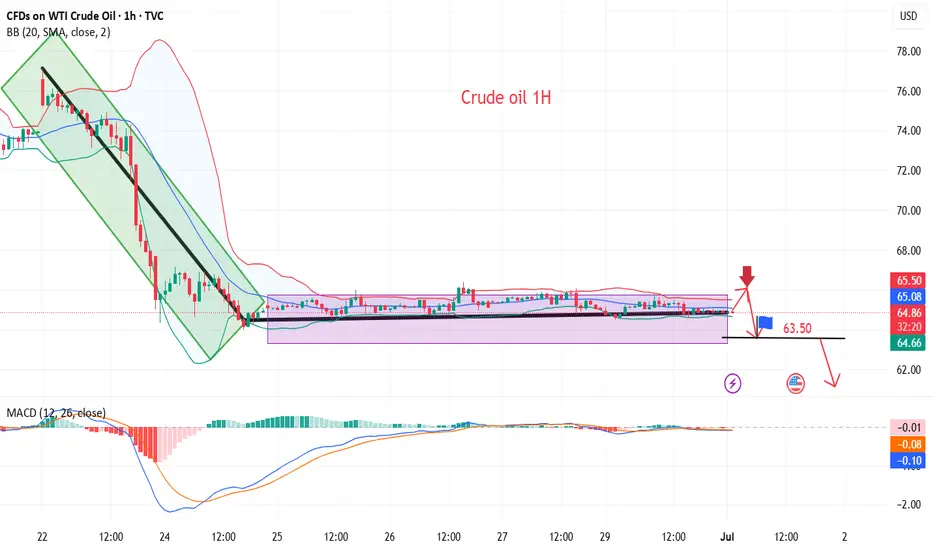
Crude oil continues to correct, short-term ideas
💡Message Strategy
WTI crude oil prices recovered from a two-week low but remained about $12 below the previous Monday's high as upside was limited by Middle East peace and expectations that OPEC+ countries will agree to increase supply again this week.
📊Technical aspects
From the daily chart level, crude oil fluctuates upward in the medium term and tests around 75. The K-line closes with a large real negative line, which has not yet destroyed the moving average system and is still supported. The medium-term objective upward trend remains unchanged.
However, from the perspective of momentum, the MACD indicator crosses downward above the zero axis, indicating that the bullish momentum is weakening. It is expected that the medium-term trend of crude oil will fall into a high-level oscillation pattern.
The short-term trend of crude oil (1H) continues to fluctuate in a narrow range, and the oil price falls back to the lower edge of the range. Pay attention to the support strength of 64. In terms of momentum, the MACD indicator is at the zero axis position, and the long and short forces are equal. It is expected that the trend of crude oil will maintain a fluctuating consolidation pattern during the day.
💰Strategy Package
Short Position:65.50-66.50,SL:67.50,Target: 64.00-63.00
The limit is 3320. Rebound and still short📰 News information:
1. Gold market liquidity at the end of the month
2. Impact of geopolitical situation
📈 Technical Analysis:
Currently, gold has rebounded to around 3295, reaching our ideal trading area. I have given the short-selling trading idea in the previous post. At present, in the short term, we still maintain the short-selling trading idea before effectively breaking through the upper resistance. Focus on the 3325 line of resistance
🎯 Trading Points:
SELL 3295-3310-3320
TP 3285-3270
In addition to investment, life also includes poetry, distant places, and Allen. Facing the market is actually facing yourself, correcting your shortcomings, confronting your mistakes, and strictly disciplining yourself. I hope my analysis can help you🌐.
OANDA:XAUUSD FOREXCOM:XAUUSD FX:XAUUSD PEPPERSTONE:XAUUSD FXOPEN:XAUUSD TVC:GOLD

XAUUSD/GOLD Geopolitical conflicts have escalated again. Next week is a week of heavy news. How will the gold price focus next week? How to trade? Look at the news preview first.
1. Geopolitics, Russia-Ukraine conflict, Palestine-Israel conflict, Iran-Israel conflict.
2. ADP data, NFP data.
3. Tariff deadline.
The above three news are enough to cause drastic fluctuations in the gold price.
On Friday, the New York market followed my expectations. After rebounding around 3282, it fell back. Finally closed around 3274.
The impact of the weekend news is huge. From the news perspective, the opening price of next Monday will be higher than the closing price on Friday. In terms of operation, you can pay attention to buying at a low price after the market opens.

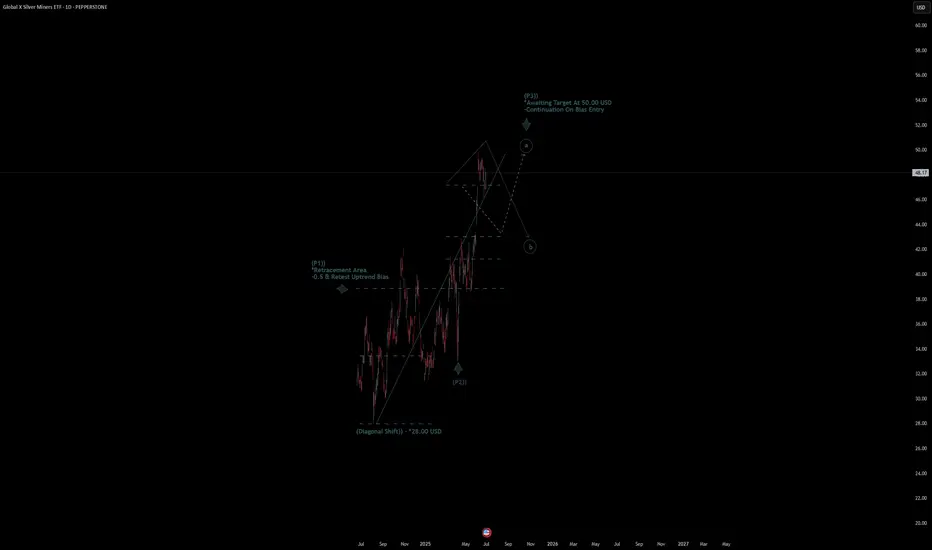
Global X SIlver ETF Quote | Chart & Forecast SummaryKey Indicators On Trade Set Up In General
1. Push Set Up
2. Range Set Up
3. Break & Retest Set Up
Notes On Session
# Global X SIlver ETF Quote
- Double Formation
* (Diagonal Shift)) - *28.00 USD | Completed Survey
* Awaiting Target At 50.00 USD
- Continuation On Bias Entry | Subdivision 1
- Triple Formation
* (P1)) / (P2)) & (P3)) | Subdivision 2
* (TP1) = a / Long Consecutive Range
* (TP2) = b / Short Consecutive Pullback | Subdivision 3
* Daily Time Frame | Trend Settings Condition
- (Hypothesis On Entry Bias)) | Regular Settings
- Position On A 1.5RR
* Stop Loss At 45.00 USD
* Entry At 48.00 USD
* Take Profit At 53.00 USD
* (Uptrend Argument)) & No Pattern Confirmation
* Ongoing Entry & (Neutral Area))
Active Sessions On Relevant Range & Elemented Probabilities;
European-Session(Upwards) - East Coast-Session(Downwards) - Asian-Session(Ranging)
Conclusion | Trade Plan Execution & Risk Management On Demand;
Overall Consensus | Buy
Gold Wave Analysis – 30 June 2025
- Gold reversed from support level 3250.00
- Likely to rise to resistance level 3400.00
Gold recently reversed up from the support level 3250.00 (which stopped wave (b) at the end of May, as can be seen from the daily Gold chart below) intersecting with the lower daily Bollinger Band and the 50% Fibonacci correction of the upward impulse from May.
The support level 3250.00 was further strengthened by the upward-sloping support trendline from February.
Given the clear daily uptrend, Gold can be expected to rise to the next resistance level 3400.00, which stopped the previous short-term correction ii.

ZCXUSDT Breaks Key SupportZCXUSDT has broken below a strong support level, followed by a clean pullback and continuation to the downside. The projected target stands near $0.016, presenting a potential accumulation opportunity. If the structure plays out, the full downside objective aligns with the broader setup target highlighted on the chart.

Short BTC, it is about to retrace and test 100000 again!As BTC gradually fell back, the rebound did not stand above 110,000 in the short term, proving that there is strong selling pressure above, and the trend line formed by the technical high point 111,000 and the second high point 110,000 formed an important resistance area, which limited the rebound space of BTC and strengthened the demand for BTC's short-term retracement.
According to the current trend, the short-term oscillation bottom area of 106,000 may be broken at any time. Once it falls below the oscillation area, it may arouse a certain degree of profit-taking chips and stimulate BTC to accelerate its decline. I think BTC will at least test the 105,000-104,000 area again during the retracement, and may even test the 100,000 integer mark again.
Therefore, shorting BTC is still the preferred option for current short-term trading.
Consider shorting BTC in the 108,000-109,000 area, and the target area in the short term is 104,500-103,500. After breaking this area, the target can be extended to 101,000-100,000.
BINANCE:BTCUSDT BINANCE:BTCUSDT BITSTAMP:BTCUSD


Short gold, it will fall again when encountering resistanceIn the short term, gold retreated to around 3274 and then rebounded again, and it is only one step away from 3300. Will gold regain its bullish trend again?
I think it is difficult for gold to break through in the short term. Although gold retreated to around 3274 and successfully built a double bottom structure with the second low point and the low point of 3245, it only increased the rebound space; it is not enough for gold to regain its bullish trend. Since gold fell and broke through, the confidence of bulls has been hit hard. The previous support at the technical level has formed a strong resistance area after the top and bottom conversion, and to a certain extent helped the short force. In the short term, gold faces resistance in the 3310-3320 area. Before gold breaks through this area, the short energy still has the upper hand.
Therefore, shorting gold is still the first choice for short-term trading.
It is appropriate to consider shorting gold in batches in the 3300-3320 area, and look at the target: 3385-3375-3365

Go long on dips and short on rallies📰 News information:
1. Gold market liquidity at the end of the month
2. Impact of geopolitical situation
📈 Technical Analysis:
Last week we predicted that gold would rebound. Today, after gold rebounded as expected, we gave a short trading strategy. Gold fell precisely at the point we gave, 3295, and successfully hit our TP3280-3270. The result confirmed the correctness of our trading strategy. Next, we will focus on the long trading opportunities below 3270-3260.
🎯 Trading Points:
BUY 3270-3260
TP 3290-3300
SELL 3295-3300-3310
TP 3280-3270
In addition to investment, life also includes poetry, distant places, and Allen. Facing the market is actually facing yourself, correcting your shortcomings, confronting your mistakes, and strictly disciplining yourself. I hope my analysis can help you🌐.
TVC:GOLD FXOPEN:XAUUSD PEPPERSTONE:XAUUSD FX:XAUUSD FOREXCOM:XAUUSD OANDA:XAUUSD

NZDUSD → Pre-breakout consolidation. One step away from a rallyFX:NZDUSD is consolidating, but the chart shows signs of readiness to shift to a distribution phase, which could lead to a rally.
Against the backdrop of a falling dollar, which is continuing its main trend, the NZD may break out of consolidation in a distribution pattern. Since the accumulation is quite large (taking into account the long squeeze), the trend may be strong.
A pre-breakout consolidation is forming relative to 0.6080, followed by the price breaking through the resistance of the global trading range. Consolidation above 0.6080 will confirm the breakdown of the structure, which could trigger distribution
Resistance levels: 0.6080, 0.612
Support levels: 0.6062, 0.604
The price may be supported by a bullish trend and a decline in the dollar. A breakout from the 4-month consolidation may be accompanied by a continuation of the uptrend until the intermediate high of 0.6355 is reached in the medium term.
Best regards, R. Linda!

SOLANA → BINANCE:SOLUSDT.P is consolidating after breaking through trend resistance. The market trigger is 148.0, and Bitcoin is provoking the market to recover...
The market is buying back all the losses. SOL breaks the local downward resistance and forms consolidation with a trigger of 148.0. The market has come to life following the rallying Bitcoin. If the general trend continues, SOL may break out of the accumulation zone and form a distribution towards 154.0
The latest retest of resistance is provoking a correction. Before rising, the price may test the zone of interest at 144 or the lower boundary of consolidation at 142.2. The ideal scenario would be a false breakdown of support at 142.2 before rising.
Resistance levels: 148.0, 154.2
Support levels: 142.2, 137.5
Fundamentally, the situation for the crypto market is improving. Technically, the market is also showing positive dynamics. SOL is consolidating after growth, which is generally a positive sign. Now we need to wait for the price to break out of consolidation and continue its growth. One of the signs of this is a rebound from the 0.5 range and a quick retest of resistance with a gradual squeeze towards the trigger.
Best regards, R. Linda!


Trading Recommendations for NZD/USDNZD/USD remain in a dominant bullish wave that began in April. Wave extremes from a "horizontal pennant" on the chart. The bearish phase since May 26 remains a part of internal correction. The bullish leg from June 23 has reversal potential.
Weekly Forecast:
The pair is likely to continue its upward movement for a few more days. A sideways trend and reversal conditions are expected near the resistance zone. Downward movement becomes more probable in the second half of week.
Potential Reversal Zones
Resistance: 0.6070 / 0.6120
Support: / 0.5940 / 0.5890
Recommendations:
Selling: Low potential and potentially risky.
Buying: Can be considered if reversal signals appear near the support zone.

Gold Threatens Yearly Support- Bulls on NoticeGold is threatening a break of the yearly uptrend with Friday’s decline clearing the monthly range low. The focus into the start of the month is on technical support at the 5/29 swing low / May low-day close (LDC) 3240/45.
A break / close below this threshold would be needed to suggest a more significant correction is underway towards the 38.2% retracement of the November rally at 3132 and the 100% extension of the April decline at 3072- both areas of interest for possible downside exhaustion / price inflection IF reached. Resistance now at 3355/80 with a breach above the Record high-close at 3431 needed to mark resumption of the broader uptrend.
-MB
