EURJPY: Bullish Outlook Explained 🇪🇺🇯🇵
There is a high chance that EURJPY will continue rising
from an underlined horizontal support.
I see 2 strong price action confirmations:
the price violated a resistance line of a bullish flag
and a neckline of a double bottom pattern.
Goal - 170.4
❤️Please, support my work with like, thank you!❤️
I am part of Trade Nation's Influencer program and receive a monthly fee for using their TradingView charts in my analysis.
Trend Lines

BTC/USDT Back Test Perhaps it's not surprising to say that I see a chance to put the $99,000 zone back in the test. Just because of the FVG. Even if it doesn't happen, I see an upward trend now.


LTC Buy / Long SetupAs price wants to move in a range, SO that's another setup for LTC, invalidation is same as for short setup, candle closing below the mention zone immediately close the trade otherwise wick doesn't matter, wick do the damage body tells the story.

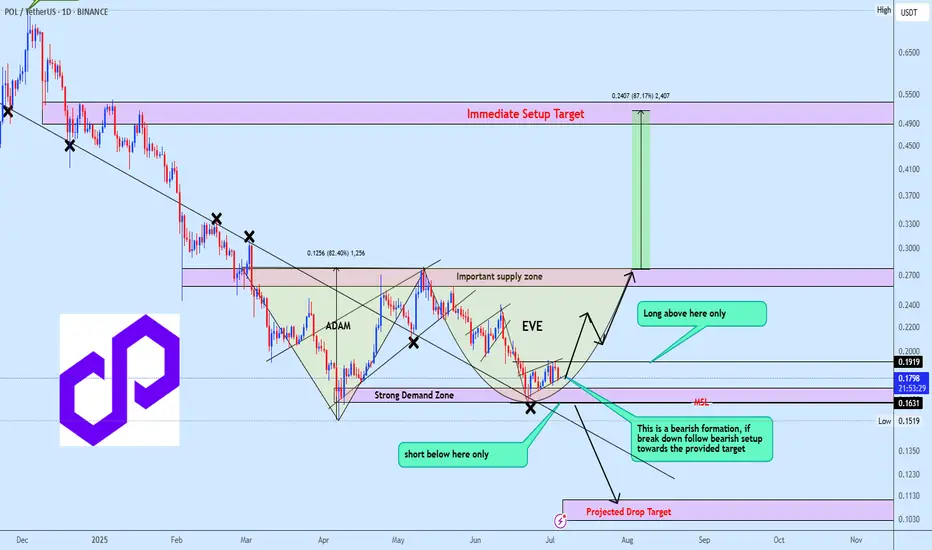
POLUSDT reversal time or bearish ContinuationPOLUSDT is currently shaping a potential Adam and Eve formation, with price consolidating inside a mini bearish flag. A breakdown from the flag would invalidate the bullish setup and likely trigger a continuation toward the projected downside target.
However, if the strong demand zone holds, we could see a bullish reversal unfold, confirming the Adam and Eve structure and opening the path toward the upside projection highlighted on the chart.
At this stage, the focus is on confirmation, not speculation. Waiting for price to validate direction will be key to positioning correctly in this setup.
$TSLA Bullish Pennant Forming on Daily – Breakout Loading?Tesla ( NASDAQ:TSLA ) is currently trading within a bullish pennant formation on the daily timeframe — and this one is textbook.
It entered the pennant from lower prices, forming a clear flagpole. Since then, price has been compressing between:
📉 Two descending resistance levels → Lower highs
📈 Two ascending support levels → Higher lows
This symmetrical tightening creates a classic bullish continuation setup — if the breakout confirms. Also found support at horizontal level of support/resistance $229.
What I’m watching:
⇒ Break above pennant resistance with volume
⇒ Reaction to any macro or Tesla-specific news during this compression (earnings July 23)
TSLA has a habit of explosive moves after consolidation. Keep this one on high alert.
#TSLA #Tesla #technicalanalysis #bullishpennant #tradingview #DisciplineTrading

Are we still in an oscillator?Been over a month in this channel now. Now clear signs of breaking up or down. We are likely headed back to the 30 day SMA, and from there who knows. I tend to like the upside here being above the SMA, but we all know it can crack down and retest the lows yet again. I'm saying we retest the highs first.

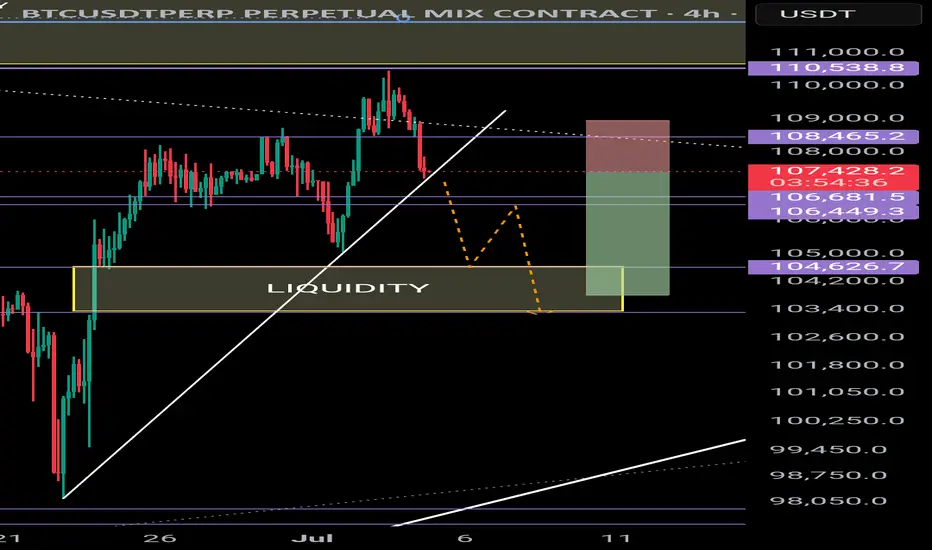
BTC correction - target4H
A break below the uptrend (white line) could result in a move down to 103,400 📉 which would fill a Fair-value-gap and grab liquidity.
Short position:
-3% vs +1%
2.3:1 Reward to Risk
I win when I don't postLets see how it goes.
The consolidation that occurred because of the U.S holiday has led to giving buyers more power.
If not, I have a Stop Loss in place. We either win or we lose.
5th wave analysis + Market Structure support zone + Heads & shoulder(4H Timeframe) - we are currently in the right shoulder.
Risk what you can afford to lose

SASOL: Potential Recovery After Breaking 2002 Low ZoneSASOL has broken below its 2002 low zone and returned back into it. The unconventional price action and recent bullish momentum suggest possible recovery movements. Keep watch on price behavior around this historical support level.

Gold fluctuates frequently, how to seize the opportunity?We started high-altitude layout from 3365. We took the lead in seizing this wave of decline opportunities and firmly held the bearish view. We harvested short orders all the way to 3325. The gold short orders were continuously stopped at profit, and the rhythm was very steady. The current market fluctuated repeatedly and the direction was chaotic, but we always insisted on executing the strategy - do it when you see it, and you can reap good rewards if you can hold it. Although there is support and resistance at the 3333 line in the short term, it is not recommended to chase more. The risk is relatively large. The key is to step back more. Wait for the 3325-3315 area to consider laying out long orders. We do not do dead shorts, nor do we blindly do more. We always maintain flexible response and rational judgment on the market.
From the current trend of gold, pay attention to the short-term support of 3325-3320 below, focus on the support position of 3315-3310, and pay attention to the short-term resistance around 3345-3350 above. The overall main tone of high-altitude low-multiple cycle participation remains unchanged. In the mid-line position, keep watching and do less, chase orders cautiously, and wait for the opportunity to enter the market after the key points are in place. For more specific operational details and strategy updates, please pay attention to the notification at the bottom 🌐 and pay attention in time.
Gold operation suggestions:
1. Go long near 3325-3315, target 3335-3345.
2. Go short near 3340-3350, target 3330-3320.

BTC shorting opportunity comes againBTC climbed above 108000 again, and the short-term bullish power was slightly stronger. According to the current strength, BTC still has room for growth, but it is still under pressure in the 109000-110000 area in the short term; if there is no major positive news, BTC may find it difficult to break through the resistance area in the short term under the current conditions, and may even experience stagflation and retreat again after approaching the resistance area.
Therefore, I think shorting BTC with the help of the resistance area is still the first choice for short-term trading. We can boldly short BTC in the 108500-109500 area and look towards the target area around 106000 again.

Go short before breaking 3350, go long before falling to 3320📰 News information:
1. Geopolitical situation
2. Tariff implementation and interest rate cut bill
📈 Technical Analysis:
As I said, the US stock market closed early today, and the market will lack some momentum. It is difficult to have a large fluctuation. It is expected to fluctuate and consolidate. I also explained in the previous post that the upper pressure in the short term is at 3340-3350. If it is touched, we can try to short and defend 3360. If it falls back to 3323, we can try to go long for the first time. If it continues to fall, it is expected to reach 3315-3305. Therefore, if it first touches 3323, go long, SL 3316, and consider going long if it touches 15-05 below.
🎯 Trading Points:
SELL 3340-33350
TP 3330-3320-3310-3300
BUY 3323
TP 3333-3340-3350
BUY 3315-3305
TP 3325-3333-3340
In addition to investment, life also includes poetry, distant places, and Allen. Facing the market is actually facing yourself, correcting your shortcomings, confronting your mistakes, and strictly disciplining yourself. I hope my analysis can help you🌐.
TVC:GOLD OANDA:XAUUSD FX:XAUUSD FOREXCOM:XAUUSD PEPPERSTONE:XAUUSD FXOPEN:XAUUSD

PARTI Setup: Key Reversal Zone Could Spark +50% RallyToday, I want to analyze the Particle Network ( BINANCE:PARTIUSDT ) project for you, which has a chance of increasing by +20% to +50% in the short term .
Let's first take a look at the fundamental state of the Particle Network (PARTI) project .
Particle Network is building a modular Layer-1 blockchain with a focus on Chain Abstraction, aiming to unify user experiences across multiple chains through:
Universal Accounts – Single account across all chains
Universal Liquidity – Access liquidity without bridging
Universal Gas – Seamless cross-chain transactions without gas token concerns
The project has:
Raised $25M+ funding from top-tier investors (Binance Labs, Animoca Brands, Spartan Group)
Integrated with 60+ blockchains and 900+ dApps
Reached over 1.3M testnet accounts and 27,100 daily transactions (Messari Q1 2025 report)
Recently launched UniversalX (a cross-chain DEX) as its flagship dApp
Summary:
Particle Network shows strong fundamentals with innovative tech, a growing ecosystem, and backing from major players in crypto. Long-term success will depend on user adoption of Universal Accounts and dApps like UniversalX.
------------------------------------------------------
Now let's take a look at the PARTI token chart on the daily time frame .
PARTI token is currently trading near Potential Reversal Zone(PRZ) , Monthly Support(2) . There is also a possibility of a Range channel forming, we should wait for the confirmation of the second bottom .
I expect the PARTI token to start rising again from the Potential Reversal Zone(PRZ) and near $0.14 .
Note: Stop Loss(SL)= $0.1177
Please respect each other's ideas and express them politely if you agree or disagree.
Particle Network Analyze (PARTIUSDT), Daily time frame.
Be sure to follow the updated ideas.
Do not forget to put a Stop loss for your positions (For every position you want to open).
Please follow your strategy and updates; this is just my Idea, and I will gladly see your ideas in this post.
Please do not forget the ✅' like '✅ button 🙏😊 & Share it with your friends; thanks, and Trade safe.

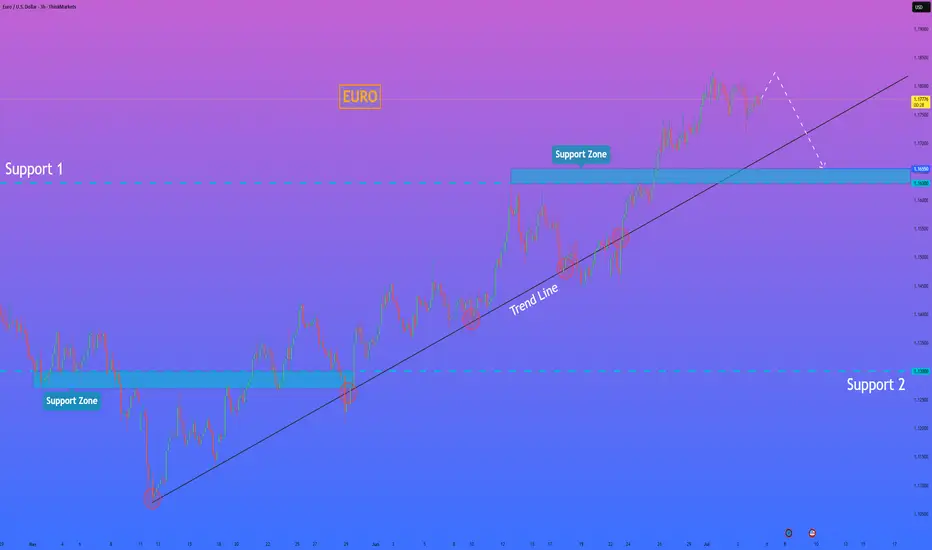
HelenP. I Euro may soon reverse and test support near $1.1655Hi folks today I'm prepared for you Euro analytics. If we look at the chart, EURUSD has been climbing steadily within an uptrend, bouncing multiple times from the trend line and making higher highs. However, despite the recent bullish structure, the pair is now showing signs of slowing momentum. The price is approaching a possible turning point near the top, and the latest candles show hesitation. Now the pair is trading near 1.1790 and still staying above the trend line, but I believe it may rise a bit more and then break down below the trend line. Once this structure is broken, I expect sellers to take control and push EURUSD toward the nearest support zone between 1.1655 and 1.1630 points. This zone acted as a key level in the past and may serve as the next area of interest for buyers. Given the extended movement and potential loss of bullish pressure, I remain bearish and expect EURUSD to move down to retest support. The level of 1.1655 is my current goal. If you like my analytics you may support me with your like/comment ❤️
Disclaimer: As part of ThinkMarkets’ Influencer Program, I am sponsored to share and publish their charts in my analysis.
SWARMS | High Risk Microcap PlayThe AI agent token SWARMS presents a compelling bullish opportunity after breaking above its long-term descending trendline.
Entry Options:
Option 1: Aggressive entry on trendline break confirmation around $0.027
Option 2: Conservative entry on pullback to green support zone near $0.02
Targets & Risk:
Target Zone:
Pink resistance box around $0.16-$0.18 (500%+ upside potential)
Stop Loss:
Below $0.02 to invalidate breakout
Risk Considerations:
Microcap volatility requires careful position sizing
AI narrative could drive momentum but remains speculative
Watch for rejection at major resistance levels
The projected path suggests significant upside potential as the token rides the AI trend revival. However, traders should manage risk appropriately given the speculative nature of microcap tokens.

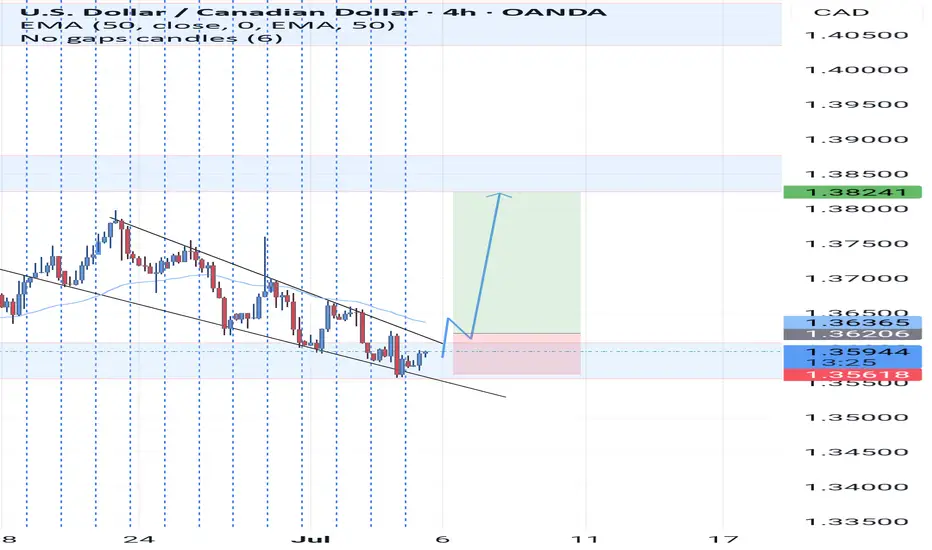
Usdcad Usdcad as we can see is on a uptrend we hv 1d 1w on a uptrend and we are expecting a break and a retest on the 4hrs den we buy but this trade is a high probability trade
BTCUSDBTCUSD | Quiet Market Play – Conditional | Trade Based On Bearish Candle Closure
After a sharp upward move, price is now losing momentum and consolidating.
Currently entering a short position after breaking the resistance
Trade includes full risk management, marked on chart. 🔴📉

H | Pushing for New HighsHumanity Protocol demonstrates exceptional bullish momentum. The bullish trajectory suggests this AI-related token could benefit from renewed sector interest.
Key Technical Signals:
Price trading well above the ascending trendline, indicating sustained bullish momentum
Clean breakout above horizontal resistance with strong volume confirmation
Trading Opportunity:
Entry: Current levels or on a slight pullback
Target: $0.136 (2x trading range extension with 40%+ upside potential)
Stop Loss: Below $0.075 to protect against trendline breakdown

Trading Recommendations and Analysis for USDJPYThe technical picture on Monday may shape future developments in the medium term. The week began a gap up, followed by the formation of a long upper shadow. The daily close occurred exactly at the support level of 146.11 thereby closing the gap.
Today's trading also opened exactly at the same level, and the candle is already black in the early hours of trading. This defines Monday's movement as false, thus creating a strong bearish signal, with a potential breakdown of the 143.45 support and a subsequent decline toward the MACD line, which coincides with the target level of 141.70. The Marlin oscillator has turned downward. its return to negative territory will add additional pressure on the price.
In the H4 timeframe, the price has consolidated below the 146.11 level, making it easier to settle below the MACD line eventually.
A break below 145.48 -the June 11 high-will serve as confirmation. The Marlin oscillator appears to be fixed in bearish territory and has joined the new downward movement.

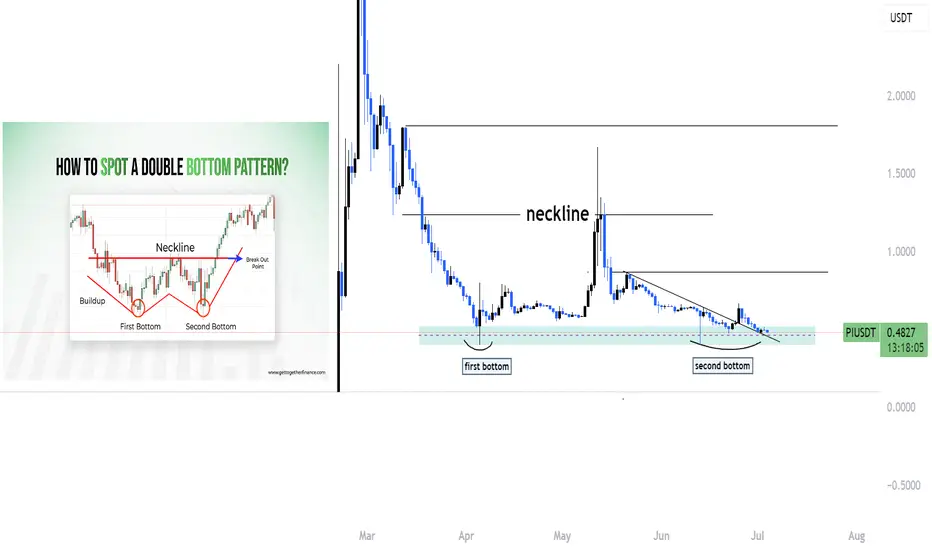
Piusdt making double bottom ??Hello traders, I hope you're all doing well!
Currently, we're seeing an interesting setup on PI that could lead to a potential bullish move. Let's break it down:
🔹 Double Bottom Formation
PI appears to be forming a double bottom on the higher time frame — a classic bullish reversal pattern. This indicates that the market has tested a key support level twice and failed to break lower, which often suggests that selling pressure is weakening.
🔹 Trendline Breakout
In addition to the double bottom, we’ve also broken out of a descending trendline that has been acting as dynamic resistance for some time. A clean breakout with volume often signals a shift in market structure from bearish to bullish.
🔹 Strong Support Zone & Liquidity
We are still holding above a strong support zone, where previous demand has stepped in. This area has likely accumulated a lot of liquidity, with stop-losses from retail traders sitting just below. If price holds this level, it may trap sellers and trigger a short squeeze, pushing the price higher.
🔹 Possible Upside Move
As long as we remain above this support and confirmation continues, there is a high probability of an upward continuation. This could be the start of a bullish leg, especially if we see a break of recent highs with strength.
📈 Conclusion
This confluence of technical signals — double bottom, trendline breakout, and liquidity resting below support — gives us a strong reason to watch this setup closely.
👉 Like and follow if you’re seeing the same structure or planning to trade this move. Let’s ride it together!
USNAS100 Key Level: 22,740 – Will the Trend Continue or Reverse?USNAS100 Update – Bullish Momentum Holds Above 22,740
USNAS100 has continued to push higher, following through as expected from yesterday’s analysis.
The index maintains bullish momentum as long as it trades above the key pivot at 22,740.
However, a 1H close below 22,730 could trigger a bearish correction toward 22,615.
A sustained break below that level may shift the trend to bearish.
Key Levels:
• Resistance: 22,870 / 23,000
• Support: 22,615 / 22,410

SPX500 Holds Above 6,225 – Bullish Trend Intact for NowSPX500 Update – Bullish Pressure Holds Above Pivot
SPX500 continues to show bullish momentum, as highlighted in our previous analysis. The price remains supported by strong buying volume above the key pivot zone at 6,225.
As long as the price stays above this level, a retest toward 6,225 remains possible before another leg higher.
However, a confirmed break below 6,225 would signal potential bearish momentum and shift the short-term structure.
Key Levels:
• Pivot Line: 6,246
• Resistance: 6,265 / 6,287 / 6,325
• Support: 6,225 / 6,191 / 6,143
