EUR/USD Slips Toward Trend SupportEuro plunged nearly 1.6% from the highs with price rebounding this week at former resistance at the 1.618% extension of the May advance. While the risk remains for a deeper correction towards the April uptrend, we’re looking for signs of support / that a low is in.
EUR/USD is trading within the confines of a proposed descending channel with price rebounding off confluent support at the lower parallel yesterday. The immediate focus is on this recovery with initial resistance eyed at the 61.8% retracement of the recent decline / the high-day close (HDC) at 1.1560/85. Ultimately, a breach / close above the 2016 high would be needed to mark uptrend resumption towards the upper parallel (currently near 1.1680s) and the August 2015 high / 78.6% retracement of the 2021 decline at 1.1714/47- both regions of interest for possible top-side exhaustion / price inflection IF reached.
Initial support rests at 1.1455 and is backed by the 38.2% retracement of the May advance at 1.1415. Note that the April trendline converges on this threshold mid-week and a break / close below this slope would be needed to suggest a more significant high weas registered las week / a larger trend correction is underway. Subsequent support rests with the objective monthly open at 1.1347 and the 2023 high / 61.8% retracement at 1.1276/82- look for a larger reaction there IF reached.
Bottom line: The Euro rally remains vulnerable to a test of uptrend support while below 1.1585. From a trading standpoint, losses would need to be limited to the April trendline IF price is heading higher on this stretch with a close above 1.1616 needed to mark uptrend resumption.
-MB
Trend Lines

BTC Testing Crucial Support – Breakdown or Bounce ?Bitcoin is currently testing a critical support zone around $103,573 – a break below could trigger a sharper move toward $101,400.
Price rejected from ~$105.8K
Support holding... for now
RSI dropping fast – now near 34 (1H TF)
Weakening momentum visible
This level is the last line of defense for bulls. If it cracks, expect volatility.
Watch closely. Break = panic or buying opportunity?
DYOR. Not Financial Advice.

Trading Signals for Gold Sell below $3,443 (21 SMA -7/8 Murrray)The XAU/USD trend remains bullish as long as the price consolidates above 3,384.
Therefore, it would be prudent to buy gold as long as the price consolidates above3,444, where the 7/8 Murray level is located.
Gold's volatility will continue over the next few days, so we believe it could move between 3,386 and 3,356.
Consequently, if gold consolidates and breaks above 3.498, it would be seen as a buying opportunity, with targets at the 8/8 Murray level around 3,600/
Last tow months, gold gapped around 3,498. This will likely be seen as a buying opportunity if the price breaks above the psychological level of $3,439
Conversely, below the R_1 around 3,443, gold will be seen as an opportunity to sell, targeting 3,400 and the bottom of the uptrend channel around 3,338.
The RSI indicator is showing a negative signal, so we must be cautious when buying, as a very strong technical correction could occur.

Israel-Iran Confrontation. (I expect upward movement in USD/CADIsrael and Iran are exchanging missile strikes, but it seems markets are trying to play their own game, assuming that this conflict will not cross the nuclear threshold. in the meantime, investors are shifting their focus to key events this week.
The main highlights will be the consumer inflation reports from the UK and the eurozone. In the EU, inflation is expected to stabilize at 1.9%, while in the UK, it is forecast to decrease from 3.5% to 3.3% year over year.
This week will also bring central bank meetings in Switzerland, the UK, and, of course, the U.S. Federal Reserve-which will likely take center stage and divert attention from the tow European central banks.
Other events worth focusing on include the release of the Philadelphia Fed Manufacturing Index U.S. retail sales figures.
But let's return to the week's main event-the Fed's final monetary policy decision, which will be made over two days, Tuesday and Wednesday. According to the consensus forecast, the central bank is expected to leave the key interest rate unchanged at 4,50% The main reasons for this are persistently high consumer inflation figures, which showed an annual increase last week (albeit smaller than expected), and uncertainty about the consequences of Donald Trump's presidency. Fed Chair Jerome Powell has previously cited both as reasons to pause the rate-cutting cycle.
So, what might come of the Fed holding rates steady?
Frankly, not much. Ongoing uncertainty will continue to be the primary driving force in the markets. Traders are starting to anticipate rate cuts in the second half of the year. However, I believe there is a strong chance that rates will remain unchanged until next year. This is due not only to risk of inflation returning to 3% and the murky geoeconomic policies of the U.S.-China trade war and its unclear outcome.
Given this combination of negative factors-each of which obstructs rate cuts-and the fact that the market has already priced these into its expectations, we can anticipate a continuation of existing trends.
The pair is declining amid rising crude oil prices, which support the Canadian dollar, a commodity-linked currency. If oil prices resume upward momentum, USD/CAD will face pressure again. If the pair fails to rise above 1,3600, a decline toward 1.3435 is likely. A potential sell level is 13560.


Analysis of Trades and Trading Tips for the Japanese YenThe price test at 144.27 occurred when the RSI indicator had already moved significantly above the zero line, but the strong U.S. labor market data offered a high probability of the dollar strengthening against the yen, which I decided to take advantage of. As a result, the pair rose toward the target level of 145.06.
The confident growth in U.S. non-farm employment recorded in May exceeded experts' expectations' causing noticeable fluctuations in currency, markets. The publications of data showing the creation of 139,7000 new jobs versus the forecasted 127,000 instantly strengthened the U.S. dollar, putting pressure on the Japanese yen. The yen's reaction to the news was immediate: the currency weakened significantly against the dollar. Investors perceived the data as a signal of the strength of the U.S. economy and the likely continuation of Federal Reserve's tight monetary policy. Furthermore, the stable unemployment rate in the U.S. recorded at 4.2%, also reinforced the market's optimistic sentiment.
Today's data shows that Japan's GDP for the first quarter was revised upward, which helped the yen recover slightly from Friday's losses against the U.S. dollar. However, despite the positive revision, Japan's economy still faces serious challenges. Weak domestic demand and an aging population continue to pressure growth, while geopolitical uncertainty poses additional obstacles. The Bank of Japan maintains a wait-and-see approach and has no plans to raise interest rates for now, which had previously provided good support to the the yen. Strong growth in bank lending also contributed to increased demand for the yen.

30x in BrettBrett is gonna 30 x during ALT rally. This is how I am going to invest in it.
do you agree with me?

HelenP. I Bitcoin can correct to trend line and start move upHi folks today I'm prepared for you Bitcoin analytics. In this chart, we can observe how the price developed a gradual upward trend, respecting the trend line as dynamic support multiple times. After each interaction with this line, the price showed a consistent pattern of rebounding and continuing its upward movement. Recently, the price faced a notable correction, which pushed it back toward this trend line once again, a critical zone that has proven its relevance as a support area. Upon touching the line, the market reacted with a bounce, signaling that buyers are still active and defending the structure. The price began to climb again, regaining some momentum, though it hasn’t yet managed to break the previous highs. Now BTCUSD is hovering near the ascending trend line, preparing for what could be another retest. If the trend holds, we may see a short-term decline toward this line, followed by a bullish rebound. I expect the price to push higher from this level, targeting the resistance zone near 108300, which also acted as a rejection area in the past. If you like my analytics you may support me with your like/comment ❤️
Disclaimer: As part of ThinkMarkets’ Influencer Program, I am sponsored to share and publish their charts in my analysis.

HelenP. I Gold can rise to resistance level and drop to $3325Hi folks today I'm prepared for you Gold analytics. After a steady climb, the price began to lose momentum and eventually corrected back to the trend line. This zone acted as dynamic support and initiated a new wave of upward movement. However, unlike the previous impulse, the price started consolidating within a symmetrical triangle, signaling indecision and weakening bullish pressure. Now the structure is tightening near the resistance zone, where the price has already been rejected multiple times. The market appears to be preparing for another interaction with the resistance level around 3430. Given the overall context, fading bullish energy, repeated rejections, and the triangle formation, I expect the price to test the resistance one more time before reversing downward. My goal is the trend line support, which aligns with 3325 points. This zone offers a logical area for the price to move next, especially considering the limited momentum above and the growing risk of breakdown inside the triangle. If you like my analytics you may support me with your like/comment ❤️
Disclaimer: As part of ThinkMarkets’ Influencer Program, I am sponsored to share and publish their charts in my analysis.

GOLD → Consolidation within a falling wedgeFX:XAUUSD is consolidating. A major player is gathering a trading position inside a wedge ahead of distribution. But the main question is: in which direction?
Gold lost ground again on Friday after mixed holiday trading on Thursday. Traders are waiting for new signals from the Fed and monitoring the situation in the Middle East. Interestingly, gold fell as the conflict escalated further (which is not logical overall). The dollar is in a global bearish trend, and traders are waiting for a decision from Powell (who is under pressure from Trump to cut rates).
Technically, if we look at the wedge, we can see how difficult it is for the market to move. The price is stuck inside the consolidation. The intraday movement is very short, with long tails and a very weak reaction to both false breakouts and level break. Large players are building up positions inside the current channel. This may only hint at the possibility of future implementation (distribution).
Resistance levels: 3360, 3396, 3420
Support levels: 3338, 3320, 3302
On D1 - H4, gold is in a countertrend (bullish trend) correction and is testing the trend support + 0.7 Fibo zone. Below, there are fairly strong areas of interest — 3320 and 3302 — which gold may test before rising. However, within the wedge, there is a fairly high probability of a breakout of resistance and the 3360 level, followed by a rally to the liquidity zone at 3396
Best regards, R. Linda!

Stick to shorting gold and holding itAlthough gold has risen sharply to around 3375 in the short term due to the dovish remarks of Fed officials, it has not made an effective breakthrough. Therefore, gold has not reversed its trend due to the short-term rebound. Gold is still in an obvious short trend. In the short term, gold is obviously under pressure in the 3365-3375 area. If gold fails to break through this resistance area, then after gold consumes a certain amount of long energy, gold shorts will counterattack again and are expected to retreat to the 3350-3340 area again.
In the case that good news cannot support the continued rebound of gold, the market's bullish confidence will be hit again, and the short confidence will be further strengthened, stimulating gold to accelerate its decline, and it is even expected to fall below the 3350-3340 area. Therefore, in short-term trading, I still advocate shorting gold, and I am currently holding a short position in gold, and I look forward to the accelerated decline of gold as expected!

#GBPUSD: A strong bullish move incoming, comment your views The price has shown a possible price divergence, which could lead to a long-term move to 1.37. We expect the US dollar to weaken, which will likely push the price of GBPUSD to our target. Key economic data will be released later today and tomorrow, which could shape the price pattern.
Good luck and trade safely!
Team Setupsfx_

Hold on to the high point and go short decisively!Gold closed the weekly line today, maintaining the idea of oscillating downward. The 4H consecutive negatives tested the support of the lower Bollinger track. Although it was roundabout and saw-sawed, every decline would be accompanied by a new low. Therefore, hold the high point to see the bottom break and accelerate. The lower side will gradually look to 3338 and 3315. Among them, 3315 is a strong support for the weekly line. If it is not broken, you can consider going long; the upper rebound pressure is 3361 and 3375. In terms of operation, short according to the rebound strength, and the specific points are subject to the bottom 🌐 notification.
Operation suggestion: Short gold in batches near 3361-3375, with a target of 3350-3340.

GOLD Under Pressure as Volatility Rises – Key Support in FocusGOLD – Overview
Gold remains under bearish pressure driven by ongoing geopolitical instability and uncertainty around recent U.S. economic data.
As long as the price trades below 3347, a corrective move toward 3322 is expected.
A 15-minute close below 3322 would likely extend the decline toward 3303, where a rebound may occur.
However, if the price reverses and stabilizes above 3347, this would support a move higher toward 3365 and 3379.
Market Note:
Overall conditions remain highly volatile and unstable, with sharp intraday swings likely.
• Support: 3322 / 3303 / 3281
• Resistance: 3364 / 3379 / 3393

Perhaps 3300 or even 3280 is foreseeable!Obviously, gold is currently fluctuating downward, and in the short term, there is a certain support in the 3340-3330 area, so gold will not fall below this support area in one fell swoop, and it is still possible to rebound to the 3360-3370 area with the support of this area. If gold encounters resistance and retreats again after touching the 3360-3370 area, if there is no major good news, gold is likely to fall below the 3340-3330 area. After gold falls below this support area, the 3300 and 3280 areas are foreseeable.
So according to the above logic, I still hold a long position executed near 3345, and I am very much looking forward to gold reaching the 3360-3365 area;
If gold continues to rebound to the 3365-3375 area, I will try to short gold again; and look forward to the accelerated downward movement of gold!
The above is a preview of the performance of gold. There may be some deviations in the specific execution of transactions, because in short-term transactions, it is necessary to judge the true breakthrough and false breakthrough in advance, but I will still roughly follow the above preview process to execute the transaction! I also hope that this can provide some reference for everyone!

GOLD (XAUUSD): Technical Analysis & Important Pattern to Watch
For some known reason, Gold remains bearish this entire week.
The market is currently correcting within a falling channel - a bullish flag on a 4H time frame.
Ahead, I see a bunch of strong intraday supports.
From one of these structures, a bullish rally may resume.
A trigger that you should look for is a bullish breakout of
a resistance line of the flag and a 4H candle close above that.
A bullish continuation will be expected then.
❤️Please, support my work with like, thank you!❤️
I am part of Trade Nation's Influencer program and receive a monthly fee for using their TradingView charts in my analysis.

ETH Gears Up for 8% Rally After Holding Key Support at $2,484Ethereum (ETH) is currently positioning itself for a potential bullish breakout on the 4-hour chart. After facing a period of mid-June consolidation and volatility, ETH has stabilized above the key support zone at $2,484–$2,551, which previously served as a strong reaction level. This range has now been retested successfully, and price action suggests growing bullish pressure.
At present, ETH is trading around $2,552, holding just above the defined support, which has acted as both a psychological and technical base. The past few candles show reduced selling momentum and a pattern of accumulation that often precedes a breakout. Buyers are stepping in at higher lows, and this shift in structure could signal the beginning of a new leg upward.
The overall setup suggests that Ethereum is now in a classic breakout-retest formation. Volume, while still moderate, has started to pick up slightly, which strengthens the case for a continuation toward the upper resistance zones. The resistance lines at $2,666 and $2,761 represent short- and mid-term upside targets, both previously tested levels where price struggled to close above. If ETH manages to break past $2,666 cleanly, a move to $2,761 becomes increasingly likely.
🔹 Trade Idea (Buy Setup)
• Entry Point: Around $2,552
• Stop Loss: $2,484 (placed just below the major support zone and recent reaction low)
• Target 1 (TP1): $2,666
• Target 2 (TP2): $2,761
• Risk-to-Reward Ratio: ~1:3.16
• Upside Potential: 8.26%
• Downside Risk: 2.62%
This trade setup provides a high-probability long opportunity, with a clearly defined support zone backing the entry. The stop loss at $2,484 gives the trade sufficient breathing room while minimizing downside risk in case of short-term volatility.
There is also a second entry opportunity defined at $2,416, should the market dip unexpectedly before continuing upward. However, this entry is more aggressive and should be approached with flexible risk management — the stop loss for this reentry point is not fixed and should be adjusted as per the trader’s individual risk appetite.
What further strengthens the bullish case is that this reentry zone aligns closely with a historical swing low that previously triggered a strong bullish reversal. If price tests this level again, it may offer a last-chance opportunity for buyers before a larger move unfolds.
The double target strategy — TP1 at $2,666 and TP2 at $2,761 — reflects realistic profit zones based on past price structure and market behavior. Both targets lie within resistance levels that saw significant reaction in recent trading sessions, making them ideal zones for partial or full profit-taking depending on price momentum.
In the broader context, despite ETH’s recent 10% drop, the asset’s ability to hold above the $2,480–$2,500 region demonstrates resilience. This range now acts as a solid foundation from which bulls could initiate a breakout, especially if macro conditions (like BTC strength or positive ETH-related news) align in coming days.
In summary, Ethereum presents a clean long setup from $2,552 with targets up to $2,761, backed by technical support, improving volume, and a bullish price structure. A secondary entry is available at $2,416 for those with higher risk tolerance. If momentum builds above $2,600, ETH could rapidly revisit prior swing highs — and this chart structure makes a compelling case for being prepared ahead of that move.

Analysis of the Short-Term Downtrend in Spot Gold Prices AgainstBased on the attached chart and extracted text information, here is a graphical analysis and trend determination of the spot gold price against the US dollar (Gold Spot / US Dollar).
Trend Analysis:
- General Trend: Based on the available data, there appears to be a short-term downtrend. The decline in price and confirmation of selling levels indicate strong selling pressure. However, this trend must be confirmed using other technical indicators.
- Price Range: The chart indicates a broad price range between approximately $3,000 and $3,500 over the past several months. This indicates significant volatility in the price of gold.
Support and Resistance Levels:
- Support Levels:
- The $3,219.944 level represents an important support level.
- The $3,100 and $3,000 levels may also act as support levels if the downtrend continues.
- Resistance Levels:
- The $3,353.820 level (the current buy level) could act as an immediate resistance level.
- Higher levels in the $3,400-$3,500 range represent potential resistance levels if the trend reverses.
- Monitoring Support Levels: The aforementioned support levels should be monitored to identify potential buying points in case of a bounce.
Based on the available data, there is a short-term downward trend in the spot gold price against the US dollar, starting from these areas:
- Entry price of the deal: $3,355.00
- Stop loss price for the trade: $3,381.00
- Target price for the deal TP1: $3,320.00
- Target price for the deal TP2: $3,280.00
- Target price for the deal TP3: $3,219.00

A glimmer of hope for bullish lovers!Gold is currently dominated by bears, but thanks to the support of risk aversion caused by geopolitical conflicts, gold has shown a certain degree of resistance to decline while falling. Therefore, the current market direction is very clear, with weak and volatile downward movement. But under this market situation, we cannot short gold excessively. We can only wait for it to rebound to the pressure level and then short gold, or try to go long on gold with strong support.
At present, gold has touched the 3350 area again, which has a certain support effect. If gold cannot effectively fall below 3350, then gold may still rebound to the 3370-3380 area again; but once gold effectively breaks the support near 3350, gold is expected to continue to fall to the 3340-3330 area.
In terms of short-term trading, I think it is possible to consider starting to try to go long on gold in batches in the 3350-3330 area, TP: 3365-3375

XAUUSD SellWe will wait till the price to come to our zone and we enter sell by confirming the structure change .
Please follow to support me .

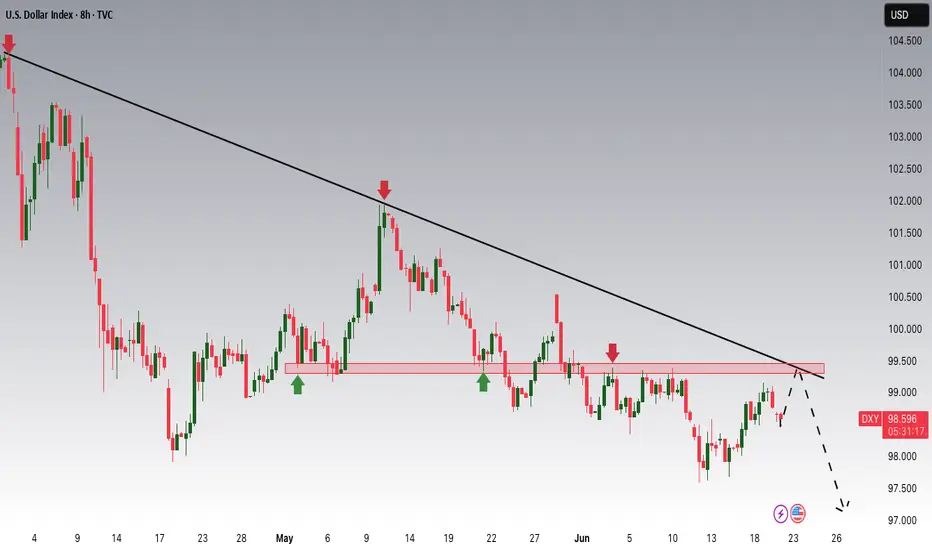
DXY Potential DownsidesHey Traders, in today's trading session we are monitoring DXY for a selling opportunity around 99.300 zone, DXY is trading in a downtrend and currently is in a correction phase in which it is approaching the trend at 99.300 support and resistance area.
Trade safe, Joe.
Upondo qatha neDolaThe FX:GBPUSD pair is projected to reach a high of 1.403 in the near future, driven by a combination of factors including improving UK economic data, hawkish signals from the Bank of England, and a weakening U.S. dollar amid expectations of Federal Reserve rate cuts. Market sentiment has turned increasingly bullish on the pound, supported by stronger-than-expected inflation figures and resilient growth indicators. If current trends continue, the pair could test the 1.403 resistance level, marking a significant move in favor of sterling.

BITCOIN (BTCUSD): Strong Bullish Confirmation?!
Bitcoin has a high chance to rise more, following
a strong bullish reaction to a rising trend line on a 4H.
Goal - 108000
❤️Please, support my work with like, thank you!❤️
