Gold remains strong, and we continue to buy on pullbacks!ADP employment unexpectedly turned negative, and the probability of a rate cut increased again
The ADP employment report released on the same day showed that the number of private sector jobs in the United States decreased by 33,000 in June, the first net loss since March 2023, and the May data was also significantly revised down to +29,000. After the release of the ADP data, the probability of the Federal Reserve's interest rate cut in July quickly rose from 20% before the data was released to about 27.4%. The market's bet on a rate cut before September has almost been fully factored in, and federal funds futures also show that the possibility of a 50 basis point rate cut has risen to 22%.
This "frown-making" data released a strong signal of cooling in the labor market before Thursday's non-farm report. If today's non-farm continues to be weaker than expected, it may force the Federal Reserve to act faster.
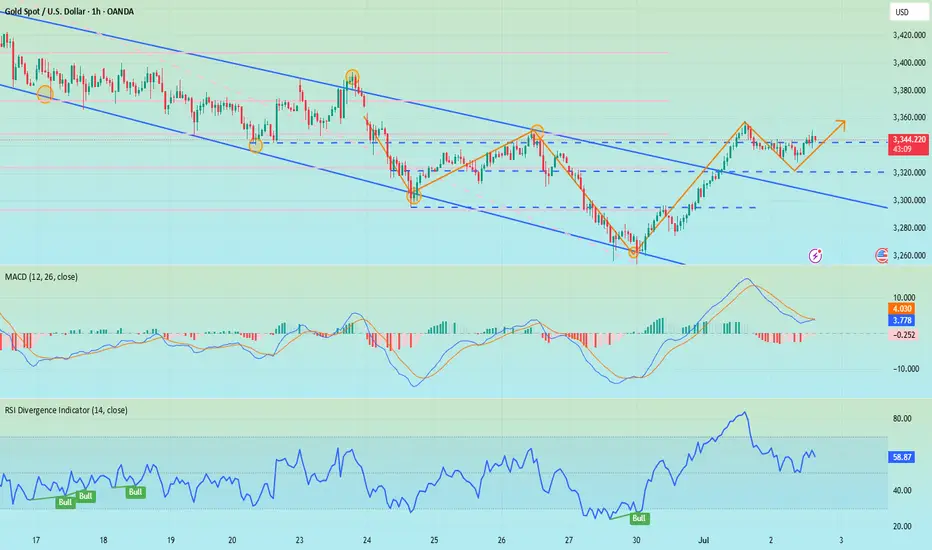
Gold opened high and then retreated continuously. From the daily chart, gold is still in an upward trend in the long term. The previous market rebounded effectively after touching the downward trend line, and the rebound force was considerable. With the restart of the bullish force, the main idea can carry the trend and do more on dips. In addition, from the 4-hour chart, gold has broken through the previous downward trend line and has gone out of the V-shaped reversal pattern, which means that the previous short-term downward trend has ended. At present, a new trend is also opening up in the 4-hour chart. The rise of gold has also established an upward trend line. You can consider buying on dips based on the upward trend line 3332. However, due to insufficient bottoming time in the previous stage, it may still face the risk of decline, so you should set the stop loss with caution. From the 1-hour chart, gold fell after opening high, and the bullish trend remains unchanged. The points for long orders can consider 3334 and 3328.
Gold operation suggestions: Go long on gold near 3325-3335, with a target of 3350-3360.
Trend Lines

Gold strengthens, looking for low-buy opportunities
In the matter of trading, everyone's cognition and operation are different, and it is difficult to find people who can really resonate. This huge difference in trading cognition makes many traders often fall into a situation of having nothing to say in social interaction, and it is difficult to find bosom friends who can really discuss trading in depth and understand each other.
1. The US ADP National Employment Report released yesterday showed that private employment decreased by 33,000 in June, which was the first net decrease in jobs since March 2023, in sharp contrast to the 29,000 increase in May after the downward revision. The market had expected 95,000 jobs to increase in June, and this unexpected decline has raised investors' doubts about the health of the US labor market. So I think the unexpected weakness of the ADP data has led the market to bet on the Fed's interest rate cut, and this expectation has driven the rise in gold prices in the short term.
2. The trade agreement reached between the United States and Vietnam reduced the tariffs previously planned to be imposed on Vietnamese exports, easing market concerns about trade tensions. I believe that against the backdrop of increasing global economic uncertainty, gold's position as a safe-haven asset has become increasingly solid, which will become an external factor affecting the gold market in the future.
Technical aspects:
Weekly chart: Upward trend, long-term buy on dips.
Daily chart: Symmetrical triangle consolidation, cautious wait-and-see in the medium term.
4-hour chart: Downward channel breaks upward, short-term buy on dips.
30-minute chart: Upward trend, short-term buy on dips.
Intraday operations focus on bullish opportunities in the 3350 area, defend 3343. Continue to look above 3365.

BTC Breakdown Escalates Bearish MomentumBitcoin has officially broken below the critical 104K support level, invalidating the recent short-term bullish structure. The price action reflects a clear shift in market sentiment, confirmed by the bearish EMA/SMA crossover and a firm rejection from the strong supply zone between 110K–111.8K.
This rejection formed a clean lower high around 110K, followed by a decisive drop below the weak supply area and failure to hold 104K a key level previously acting as a demand floor. The current structure now favors downside continuation, with the 98K zone as immediate focus.
If bearish momentum persists, attention will shift toward the Weak Potential Reversal Zone and eventually the Recommended Buy Back Zone around the 84K–86K area. This zone aligns with a historical support range and may offer high-probability entries for medium-term accumulation.
Until price reclaims the 104K–105.5K region, rallies are likely to be sold off within the supply zones. Short-term traders may look to trade the breakdown toward the highlighted support levels, while long-term investors should monitor price reaction within the buyback region.

XRPUSDT → Resistance retest. Coin inside the flatBINANCE:XRPUSDT is rising towards resistance at 2.3288 due to a shift in the fundamental background to positive and a rally in Bitcoin, but there is always a but...
On the daily chart, XRP is trading below strong trend resistance, and there is also a fairly strong and voluminous liquidity pool at 2.3300 ahead, which could provide strong resistance. Bitcoin is also approaching its critical level of 110500, which may temporarily hold back growth, and a correction in the flagship could trigger a correction in the rest of the market...
Focus on resistance and the liquidity pool at 2.3288. A sharp approach and capture of liquidity without the possibility of continuing growth could lead to a correction by half or the entire local range (to 2.16).
Resistance levels: 2.3288, 2.357, 2.45
Support levels: 2.25, 2.213, 2.16
If the retest of resistance at 2.3288 ends in a false breakout, then subsequent consolidation below the level could trigger a correction to the above support and interest zones.
Best regards, R. Linda!

Bitcoin Just Broke Out! Is $117K Next? (MA50 + Fibo 161% Confirm🚨 MAJOR BTC MOVE!
After weeks of consolidation, Bitcoin has officially broken the downtrend and showed a strong bounce from the MA50, turning previous resistance into support.
📈 Setup Breakdown:
✅ Downtrend breakout confirmed
✅ Clean reaction from MA50
✅ Long entry triggered with upside targets
🎯 Target 1: $112,644 (161% Fibo)
🎯 Target 2: $117,351
📊 This could be the beginning of a new leg up. Watch price behavior at key levels and manage risk accordingly.
💬 What’s your take? Are we heading to $120K or is this a bull trap? Drop your thoughts below 👇
🔁 Like & Share if you caught this move!
📺 Follow for more real-time setups @ TradeWithMky 🧠📉
—
“TradeWithMky – where altcoins speak louder than Bitcoin!”

GOLD → Retesting resistance may lead to a breakout.FX:XAUUSD breaks the downward resistance line on the senior timeframe and tests the upper limit of the trading range amid the falling dollar and Powell's speech. The metal may continue its upward movement.
The dollar's rise was short-lived after Fed Chairman Jerome Powell hinted at an imminent interest rate cut, but not in July... The probability of a rate cut in July fell to 22%, and in September to 72%.
Markets are awaiting fresh employment data (ADP and Nonfarm Payrolls), which could influence the prospects for rate cuts. Weak reports could revive interest in gold, but for now, the asset remains under pressure due to the short-term strengthening of the dollar and uncertainty surrounding Fed policy.
Technically, if the pre-breakout structure remains intact and gold continues to attack resistance within the local range of 3347-3330 (3335), the chances of further growth will be high...
Resistance levels: 3347, 3358
Support levels: 3336, 3316, 3311
The global trend is upward, and locally, the price is also returning to growth. If the bulls can maintain the current trend, break through the resistance at 3347, and hold their ground above this level, then the next target will be 3390-3400. I do not rule out a correction to 3325, 3316 (liquidity hunt) before the growth continues.
Best regards, R. Linda!

AUDUSD → Pre-breakout consolidation for trend continuationFX:AUDUSD may continue its upward trend. After another local distribution, the currency pair is consolidating and may repeat the cycle
The dollar index continues to fall, the global trend is clear, and the price is testing multi-year lows. After yesterday's speech by Powell, the decline may intensify amid expectations of a rate cut, which will only support AUDUSD.
AUDUSD is moving within an uptrend, stopping below resistance at 0.6583, but is not going to fall.
There was a false breakout (the zone was tested), the structure is not broken, and the price continues to squeeze towards resistance, which could lead to a breakout and growth
Resistance levels: 0.6583
Support levels: 0.6566, 0.6556
There is potential accumulation in the market, and the market is choosing growth against the backdrop of a falling dollar as its direction. Accordingly, the currency pair is one step away from a possible realization phase. Thus, if the price breaks 0.6583 and consolidates above this zone, it may continue to grow in the short and medium term.
Best regards, R. Linda!

Bitcoin’s not done dropping. Selling pressure’s still on!Welcome aboard ✌️
In order for Bitcoin to climb higher, we first need a deeper correction.
Right now, price is stuck inside a channel — and it’ll take stronger momentum to break out.
🔻 So for now, I’m expecting further downside. Stick with me and don’t miss this bearish wave!
BINANCE:BTCUSD OANDA:BTCUSD

Gold trend remains bullishThe investment market will not simply move in the expected direction. The road to success is tortuous. Once it goes in the opposite direction, it will lose direction and enter a cycle. The same is true for the market. The trend is certain, but it will never simply move in the predetermined direction. There will be twists and turns during the period that will shake people's hearts. At this time, you need a good attitude to face it and not be affected by the short-term trend. This is why we have been firmly laying out the bands in the early stage, and the reason for successful profits. Only by keeping the original intention can we succeed. The investment market requires concentration and perseverance, and then to reap profits!
At present, the overall rise of gold remains stable. Although the fluctuation has narrowed compared with yesterday, it has not fallen sharply after touching the previous pressure level, indicating that the support below is still effective. Although affected by the ADP data, the technical pattern still maintains a bullish idea. For prudent operations, it is recommended to maintain a low-long strategy and pay attention to the short-term support area near 3333-3328 below. After retreating to this position and stabilizing, you can continue to arrange long orders, and focus on the support area near 3325-3315. If the daily level stabilizes above this position, continue to maintain the bullish rhythm of retreating low and long and following the trend. The upward target looks at the 3355-3360 area. If this area continues to be blocked, consider light positions to arrange short orders, and the target is bearish adjustment. If the market breaks through strongly and stabilizes, it is expected to test the 3370-3380 area. The specific strategy adjustment will be prompted dynamically during the intraday according to the real-time market, and steadily follow the bullish trend to grasp the benefits.

GBPUSD InsightHello to all subscribers,
Please feel free to share your personal opinions in the comments. Don’t forget to hit the booster and subscribe!
Key Points
- According to the ADP National Employment Report, U.S. private employment in June decreased by 33,000 compared to the previous month — the first negative figure since March 2023. This has strengthened expectations for interest rate cuts.
- U.S. President Donald Trump announced that a trade agreement has been reached with Vietnam. Reportedly, Vietnam has agreed to significantly lower its tariffs to 20% in exchange for opening its market. This has raised hopes for progress in ongoing trade negotiations with other countries.
- The EU trade team is currently in Washington, D.C., negotiating with the U.S. side and is reportedly requesting preemptive tariff exemptions in certain sectors.
- In the U.K., the welfare reform plan proposed by the Labour government has been significantly scaled back. Prime Minister Keir Starmer has not confirmed his confidence in Chancellor Rachel Reeves, leading to growing speculation that she may be replaced. If Reeves — who has emphasized fiscal discipline — is replaced, there are concerns that fiscal control could loosen.
Key Economic Events This Week
+ July 3: U.S. Non-Farm Payrolls (June), U.S. Unemployment Rate (June)
GBPUSD Chart Analysis
After maintaining an upward trend, GBPUSD experienced a sharp drop. However, the pair appears to have regained its bullish momentum with support from the trendline. The upward view will be maintained toward the resistance level of 1.40000, the trend’s previous high.
That said, caution is advised near the 1.38000 level, where the previous sharp decline occurred, as this zone could introduce volatility.

ECOWLD - Heading towards 52 WEEK HIGH ?ECOWLD - CURRENT PRICE : RM2.00
ECOWLD broke out a 6 month down trendline on 01 JULY 2025 with high trading volume indicating strong bullish momentum. The stock is bullish as the price is above both 50 and 200 EMAs. Furthermore the share price is near 52 Week High. RSI is above 50 and below 70 indicating stock is bullish and not considered overbought yet. Nearest target will be RM2.16 (52 Week High resistance) and then if the trend resume, it may propel higher to hit next target at RM2.28. Support level is the low of 23 JUNE 2025 candle - RM1.77.
ENTRY PRICE : RM1.99 - RM2.02
TARGET : RM2.16 and RM2.28
SUPPORT : RM1.77
Notes : On 26 JUNE 2025 the company announced its increasing QUARTERLY EARNINGS. May visit company website or TheEdge for get more information.

#XAU/USD SELL TRADE SETUP [SHORT]In this analysis we're focusing on 2H timeframe. As we know, Gold is moving in a strong bearish trend. The best selling zone is 3295 - 3305 key levels area. If gold encounters rejection from this zone, we can anticipate a potential decline in price towards its targeted levels.
Target 1:3260
Target 2:3250
Target 3:3240
Wait for a retracement to sell with strong confirmation and proper risk management.
#GOLD 2H Technical Analysis Expected Move.

USOIL is Nearing the Daily TrendHey Traders, in tomorrow's trading session we are monitoring USOIL for a buying opportunity around 64.30 zone, USOIL is trading in an uptrend and currently is in a correction phase in which it is approaching the trend at 64.30 support and resistance area.
Trade safe, Joe.

I can't feel my toes.I'm frozen... frozen in time. I can't shake this feeling--trying to unwind. I need to calm down. I need to stop... but I cannot. I can't shake this ceiling; it's already set in stone.

$QBTS 20$ again or 10$ again?
Posting this idea based on sentiment/technical analysis and not being fixed on any fundamentals here. just some experience on certain sectors like AI, Quantum, Uranium, Nuclear; price looks like it established a support that is diagonal over long term view. Today based on offering more equity to market we saw pre-market move up. resistance still at 15.52 region. if this plays well we can see an easy 20$. if not going back to previous support around 10-11$ region.
feel free to enlighten me if I am wrong, cheers folks!

I have shorted gold as expected and held on patientlyEven under the influence of the ADP data, which is bullish for the gold market, gold has not effectively broken through 3350, and even showed signs of falling back after rising several times. The resistance above is becoming more and more obvious, which may further weaken the market's bullish sentiment and confidence, thereby strengthening the dominance of the bears.
Although gold has not effectively fallen yet, from the perspective of the gold structure, even if gold wants to rise, it still needs to be backtested and support confirmed before rising, and the current retracement is far from enough, so gold still has a need for structural retracement; and before the NFP market, gold rose slowly but was far from enough to break upward, and there was no volume support, so the illusion of gold rising may be to lure and capture more bulls;
Therefore, out of caution, I try to avoid chasing gold at high levels; and I believe that shorting gold is still the first choice for short-term trading at present. And I have executed short trades in the 3340-3350 area according to the trading plan, and held it patiently. I hope that gold can retreat to the 3320-3310-3300 area as expected.

ADP data has been released, how to position gold in the future📰 News information:
1. ADP data, for reference of tomorrow's NFP data
2. Interest rate cuts and Powell's dovish comments
3. Geopolitical impact on the gold market
📈 Technical Analysis:
The ADP data was significantly bullish after it was released, but gold did not rise sharply in the short term. Instead, it touched the resistance of 3350 that we gave and then fell back. I also saw a lot of fake traders in the market who immediately told their brothers to go long and look towards 3380 after the ADP data was released. To be honest, I think these people are typical hindsight experts. If everyone is like this, then anyone can be called a trader, right?
Back to the topic, I still hold short orders at 3340-3350. In the short term, gold will fluctuate and be bearish to seek restorative support, so the best place to go long is to look at the retracement below, which will at least touch 3333-3323. If it falls below this support, it will go to 3315-3305. On the contrary, if it gets effective support at 3333-3323, then gold will rebound as expected to form a head and shoulders bottom.
🎯 Trading Points:
SELL 3340-3350-3355
TP 3333-3323-3315-3295
BUY 3335-3325
TP 3345-3355-3375
In addition to investment, life also includes poetry, distant places, and Allen. Facing the market is actually facing yourself, correcting your shortcomings, confronting your mistakes, and strictly disciplining yourself. I hope my analysis can help you🌐.
FXOPEN:XAUUSD PEPPERSTONE:XAUUSD FOREXCOM:XAUUSD FX:XAUUSD OANDA:XAUUSD TVC:GOLD
Silver Wave Analysis – 2 July 2025- Silver reversed from support level 35.50
- Likely to rise to resistance level 37.30
Silver recently reversed up with the daily Hammer from the support level 35.50 (which stopped the previous waves (iv) and 4, as can be seen from the daily Silver chart below).
The support level 35.50 was strengthened by the 38.2% Fibonacci correction of the upward impulse from May and the support trendline from April.
Given the clear daily uptrend, Silver can be expected to rise further to the next resistance level 36.80 – the breakout of which can lead to further gains toward 37.30.

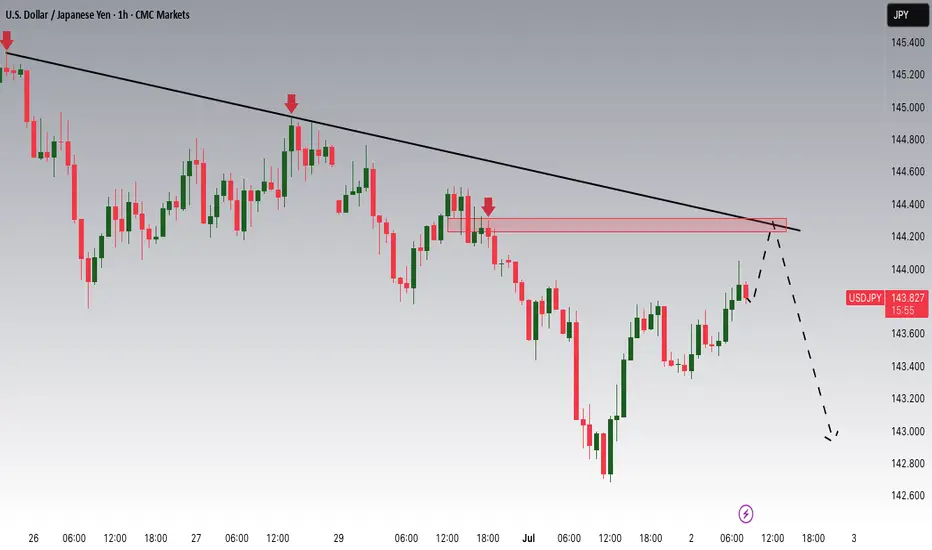
USDJPY Potential DownsidesHey Traders, in today's trading session we are monitoring USDJPY for a selling opportunity around 144.200 zone, USDJPY is trading in a downtrend and currently is in a correction phase in which it is approaching the trend at 144.200 support and resistance area.
Trade safe, Joe.
EURGBPHigher Highs (HH) & Higher Lows (HL): The pattern of higher highs and higher lows is an indication of an uptrend, showing that the buying momentum is strong.
Entry: Place a buy stop order just above the recent higher high (HH). This allows you to enter the trade if the price continues moving upward, confirming the bullish momentum.

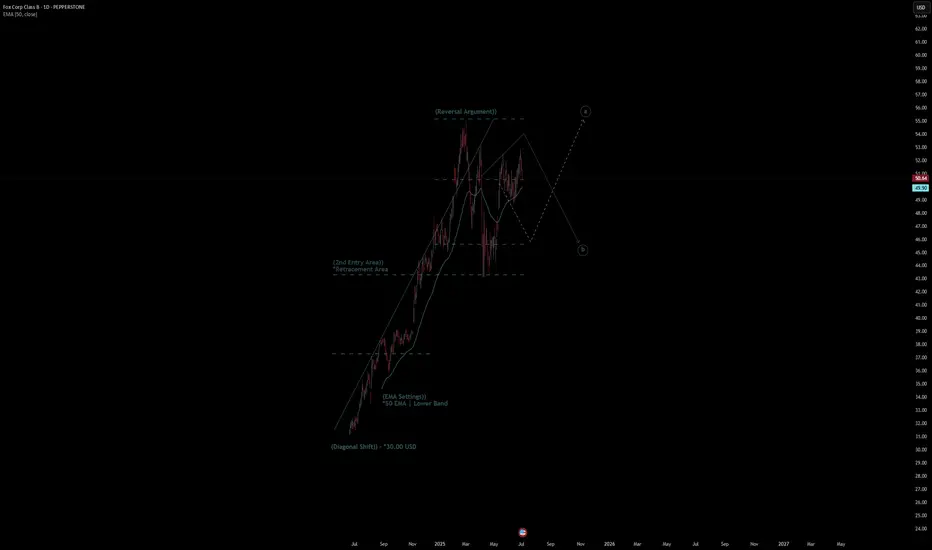
Fox Corp Class B Quote | Chart & Forecast SummaryKey Indicators On Trade Set Up In General
1. Push Set Up
2. Range Set Up
3. Break & Retest Set Up
Notes On Session
# Fox Corp Class B Quote
- Double Formation
* (Diagonal Shift)) - *30.00 USD | Completed Survey
* (2nd Entry Area)) | Subdivision 1
- Triple Formation
* (P1)) / (P2)) & (P3)) | Subdivision 2
* (TP1) = a / Long Consecutive Range
* (TP2) = b / Short Consecutive Pullback | Subdivision 3
* Daily Time Frame | Trend Settings Condition
- (Hypothesis On Entry Bias)) | Regular Settings
- Position On A 1.5RR
* Stop Loss At 45.00 USD
* Entry At 50.00 USD
* Take Profit At 58.00 USD
* (Uptrend Argument)) & No Pattern Confirmation
* Ongoing Entry & (Neutral Area))
Active Sessions On Relevant Range & Elemented Probabilities;
European-Session(Upwards) - East Coast-Session(Downwards) - Asian-Session(Ranging)
Conclusion | Trade Plan Execution & Risk Management On Demand;
Overall Consensus | Buy
BUY. gold against the dollar using "Heikin Ashi" Analysis
The chart for the price of gold against the dollar using "Heikin Ashi" candles on a 4-hour timeframe. Here are the details:
Price Analysis:
1. Ascending Triangle:
- The price is fluctuating within an ascending triangle, indicating the possibility of a continued uptrend.
- The upper level of the triangle acts as resistance at around $3,350.
2. Support Line:
- The ascending support line (green line) supports the price movement, enhancing the chances of the uptrend continuing.
3. Resistance Level:
- The level indicated by the red line represents the resistance that, if broken, could lead to a significant price increase.
Opening a Buy Position:
1. Confirmation of Breakout:
- Wait for confirmation of a breakout above the resistance level ($3,350) before starting to open a buy position.
- Closing a candle above the resistance level can be used as a confirmation signal.
2. Risk Management:
- Set a stop-loss below the support line of the triangle to minimize risks in case of a pullback.
3. Price Target Advice:
- Entry Price: $3,350.00
- First Target: $3,375.00
- Second Target: $3,400.00
- Third Target: $3,430.00
- 🚨 Stop Loss: $3,329.00
4. Ongoing Technical Analysis:
- Periodically review the analysis to ensure the trend continues and to identify potential changes.

How to make accurate layout during gold volatility?Gold maintained a small range of fluctuations and consolidation rhythm today. In the morning, we arranged long orders at 3330-3331 and successfully exited at 3343. Affected by the ADP data, the gold price broke through 3345 and hit 3351. We also arranged short orders in the 3350-3351 area in time and are still holding positions. The focus of the support below is 3325-3315, which is the key position today. As long as this position is maintained, the long position will rebound and rise. Otherwise, it will fall into the battle for support at 3305-3295. In terms of operation, we continue to step back and do more.
From the current analysis of gold trend, the support below focuses on 3325-3315. The main bullish trend remains unchanged. Focus on the long-short watershed position of 3305-3295. The daily level stabilizes above this position and continues to step back and do more bullish rhythm.
