Long positions have achieved profits, BTC market outlook📰 News information:
1. Pay attention to the trend of gold and US bonds
📈 Technical Analysis:
At present, BTC has rebounded and profited, and rebounded to around 108,000 again. 109,000 is also the upper track of the Bollinger Band. There is a certain suppression in the short term. Before the suppression fails to break through effectively, BTC may still fall into a weak and volatile market. If BTC hits resistance and pressure above 108,000-109,000 during the day, you can consider shorting. In view of the current volatile market, everyone must strictly control their positions, use leverage prudently, and do a good job of risk management to cope with market uncertainties.
🎯 Trading Points:
SELL 108,000-109,000
TP 107,000-106,000-105,000
In addition to investment, life also includes poetry, distant places, and Allen. Facing the market is actually facing yourself, correcting your shortcomings, confronting your mistakes, and strictly disciplining yourself. I hope my analysis can help you🌐.
TVC:GOLD OANDA:XAUUSD FX:XAUUSD FOREXCOM:XAUUSD PEPPERSTONE:XAUUSD FXOPEN:XAUUSD
Trend Lines

Estee Lauder | EL | Long at $67.33Reentering Estee Lauder at $67.33 due to the persistence of the Director, Paul Fribourg, buying around $33,000,000 worth of shares between $63-$66 (even after the earnings debacle). While the company had a horrendous outlook for FY2025, the bad news may be already priced in (i.e. cutting 7,000 jobs, weak sales, etc.). A "profit recovery and growth plan" is underway, so buckle up for the high risk of further declines in stock price in the near-term. Personally, a buy and hold at $67.33 with the primary thesis being global expansion (recovering Chinese market) or potential buyout into 2027.
Targets
$80.00
$86.00

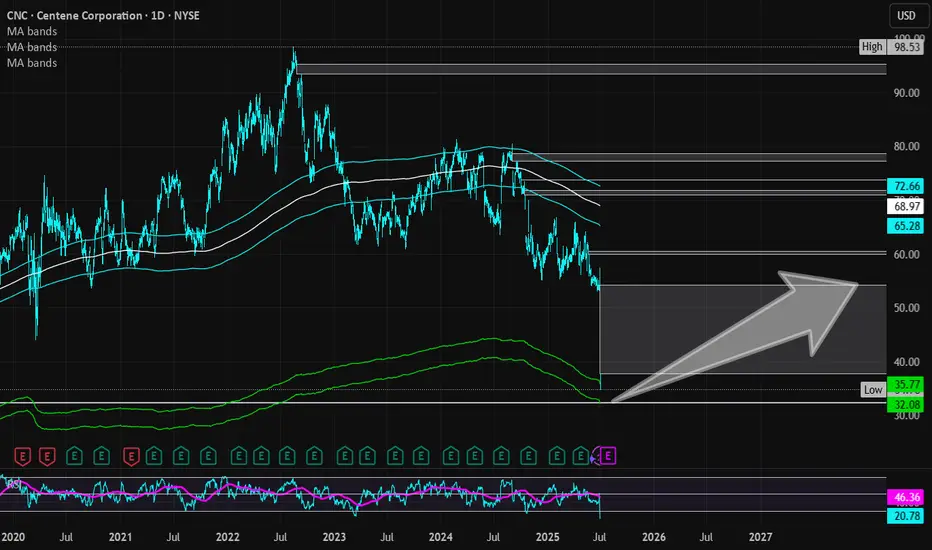
Centene Corp | CNC | Long at $35.00Centene Corp NYSE:CNC is a healthcare enterprise providing programs and services to under-insured and uninsured families, commercial organizations, and military families in the U.S. through Medicaid, Medicare, Commercial, and other segments. The stock dropped almost 40% this morning due to recent challenges, such as a $1.8B reduction in 2025 risk adjustment revenue and rising Medicaid costs (leading to withdrawal of 2025 earnings guidance). However, the company has a book value near $56, debt-to-equity of 0.7x (healthy), a current P/E of 5x, and a forward P/E of 9x.
It may be a few years before this stock recovers. But the price has entered my "crash" simple moving average area (currently between $32 and $36) and there is a price gap on the daily chart between $32 and $33 that will likely be closed before a move higher. Long-term, and potentially a new political administration, new life may enter this stock once again as the baby boom generation requires more healthcare services. But holding is not for the faint of heart...
Thus, at $35.00, NYSE:CNC is in a personal buy zone with a likely continued dip into the low $30s or high $20s before a slow move higher (where I will be accumulating more shares). Full disclosure: I am also a position holder in the $60s and cost averaging down.
Targets into 2028:
$45.00 (+28.6%)
$54.00 (+54.3%)
As expected, it will fall and form a head and shoulders bottom📰 News information:
1. ADP data, for reference of tomorrow's NFP data
2. Interest rate cuts and Powell's dovish comments
3. Geopolitical impact on the gold market
📈 Technical Analysis:
Yesterday we expected gold to retreat to the 3330-3320 area. Today, gold hit a low of around 3328 during the Asian session, which is in line with our judgment of the market trend. In the short term, gold may still fall. First, it may test the 3323 support line. If it falls back to this position during the day, you can try to go long. In the short term, focus on the 3315-3305 long-short dividing line below. If gold gets effective support below, it is expected to form a head and shoulders bottom pattern. The short-term decline will accumulate momentum for the future rise. Pay attention to the ADP data during the NY period
🎯 Trading Points:
BUY 3323-3315-3305
TP 3340-3350-3360-3375
In addition to investment, life also includes poetry, distant places, and Allen. Facing the market is actually facing yourself, correcting your shortcomings, confronting your mistakes, and strictly disciplining yourself. I hope my analysis can help you🌐.
FXOPEN:XAUUSD PEPPERSTONE:XAUUSD FOREXCOM:XAUUSD FX:XAUUSD OANDA:XAUUSD TVC:GOLD

US100 POSSIBLE SELL OPPORTUNITY!!We’re going to see a possible sell opportunity on US100 from the current market price. SL 22594 take profit at 22178

HelenP. I Gold will make small correction and then continue growHi folks today I'm prepared for you Euro analytics. In this chart, we can see how the price declined to the 3245 support level, which coincided with the support zone, and then started to grow. In a short time, it reached the 3395 resistance level, which coincided with the resistance zone, and then dropped to the trend line, breaking two levels, and made a gap. After this movement, the price started to grow in a wedge and soon reached the support level, which broke it and continued to rise next. Later, it made a correction to the 3245 level and then continued to move up and reached the resistance level. Price bounced from this level and corrected, after which it turned around and rose to the resistance line of the wedge pattern, breaking the 3395 resistance level. But soon, it turned around and corrected to the trend line. Not a long time ago, price exited from the wedge, fell to the support level, and then started to grow. For this case, I expect that XAUUSD will make a small correction. Then I think it can continue to grow and reach the 3395 resistance level, which is my current goal. If you like my analytics you may support me with your like/comment.❤️
Disclaimer: As part of ThinkMarkets’ Influencer Program, I am sponsored to share and publish their charts in my analysis.

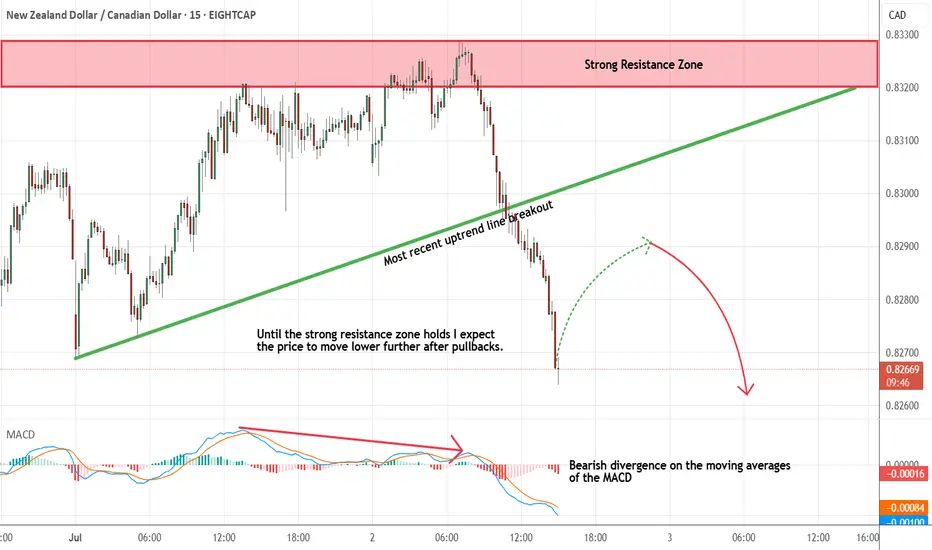
NZDCAD - Looking To Sell Pullbacks In The Short TermM15 - Bearish divergence followed by the most recent uptrend line breakout.
No opposite signs.
Expecting pullbacks and bearish continuation until the strong resistance zone holds.
If you enjoy this idea, don’t forget to LIKE 👍, FOLLOW ✅, SHARE 🙌, and COMMENT ✍! Drop your thoughts and charts below to keep the discussion going. Your support helps keep this content free and reach more people! 🚀
--------------------------------------------------------------------------------------------------------------------
Critical moment! Where will gold go?After rebounding for two consecutive days, gold prices consolidated in a narrow range in the Asian market on Wednesday, hovering below a one-week high. Although the US dollar rebounded slightly and the market's improved risk appetite suppressed safe-haven demand, the Fed's interest rate cut expectations and trade uncertainties limited the downside of gold prices. The market is waiting for the upcoming ADP and non-farm data to determine the timing of the Fed's interest rate cut. The key technical resistance is $3,358.
Gold received a positive cross in June. At present, the monthly line has an upper shadow for three consecutive trading months, and the shadow is long, indicating that the upper selling pressure is relatively large; in this way, for the future market, we are more optimistic about the highs and falls. In the recent stage, gold is not interested in US data, but Trump frequently calls for the Fed to cut interest rates, which we still need to pay attention to. The sharp rise in gold in the past two days is not unrelated to the Fed's expectation of a rate cut. On the other hand, it is also related to the market rumor that the US President Trump's tariff deadline on July 9 is also related. If the US dollar index bottoms out and rebounds, ushering in a phased upward trend; then, it is bound to suppress gold.
Short-term resistance is yesterday's high point 3350-3360 area. If it breaks above, it is expected to hit 3375-80, and further 3400 mark; before breaking above 3400 area, there is still a large sweep range. If it goes up, the bulls will have a wave of acceleration, and the upper 3425 and 3450 may even hit the historical high. For the day, the 5-day moving average 3315 area will form a strong support after breaking through. If it rebounds and rushes higher, it cannot break below. Once it breaks below, the market will continue to fall, further 3300~3295, and then 3275 and 3255~45 areas; that is, the rise on Monday and Tuesday means the end of the bulls. Therefore, in terms of operation, the short-term relies on the 3315-3325 area to support low longs, and if it rises, it will continue to short with reference to the resistance area.

TSLA: Don't Sleep on the PullbackTesla’s bullish momentum is still in control – the weekly chart shows we’re still in an uptrend, and the trend is still our best friend. After a strong bounce from support a couple weeks ago, price is now rejecting off a weak resistance zone. Ideally, this pulls it back into my entry zone to retest the bottom or the 50% mark of the current swing. I’m using trend lines for guidance and expecting the next swing to push up into that confluence area. My golden zone is set between $367–$390, with partial profits be taken at $367 (top of the channel) and the rest near $390, where we meet the trend line. Stop loss is placed at $241, just below the level where momentum would likely shift.

Exclusive trading strategy, short gold!From the current gold structure, we can see that gold still needs to continue to retest the 3320-3310, or even the 3305-3295 area; so in the short term, we can still seize the opportunity to consider shorting gold in batches in the 3340-3360 area.
Trading signal:
@3340-3360 Sell, TP:3325-3315-3305
A reliable trader must have an explanation for everything and respond to everything. I have always been committed to the market and insist on writing the most useful core strategies for traders. The transaction details can be seen in the channel!

How do we plan before ADP and NFP?📰 News information:
1. ADP data, for reference of tomorrow's NFP data
2. Interest rate cuts and Powell's dovish comments
3. Geopolitical impact on the gold market
📈 Technical Analysis:
The market will continue to fluctuate before the ADP data, and the market will continue to rise after the adjustment. In the 4H cycle, the upper rail of the pressure is temporarily suspended, and the Bollinger Bands also close. This is why I emphasize the need to pay attention to the 3323 support line below. At present, gold rebounded, I think it will touch 3348 at most, that is, it rebounded to 50%. Therefore, before the ADP data, I still hold the position of 3340-3350 for shorting, and find support for long at 3325-3315 below. I have marked the pattern of head and shoulders bottom in the figure. I have been engaged in spot, futures, foreign exchange and other transactions for many years. My analysis ideas can be referred to by brothers
🎯 Trading Points:
SELL 3340-3350
TP 3330-3325-3315-3295
BUY 3323-3315-3305
TP 3340-3350-3360-3375
In addition to investment, life also includes poetry, distant places, and Allen. Facing the market is actually facing yourself, correcting your shortcomings, confronting your mistakes, and strictly disciplining yourself. I hope my analysis can help you🌐.
TVC:GOLD OANDA:XAUUSD FX:XAUUSD FOREXCOM:XAUUSD PEPPERSTONE:XAUUSD FXOPEN:XAUUSD

Gold may need to retreat to around 3300 againYesterday, the gold rebound stopped at around 3358, and then began to retreat. After that, it even failed to stand above 3350 during the rebound process, which to a certain extent hit the confidence of the bulls;
At present, gold has retreated to the area near 3330 again. Although gold has fallen slowly, the center of gravity of gold is still shifting downward in the short term, and the trading volume of gold is gradually increasing when it is falling, so I think the short position may not be over, and the 3330 area may be broken at any time; and the support area that really deserves our attention is first the 3320-3315 area, followed by the 3300-3295 area;
From the current gold structure, I think gold may still test the area near 3300 again before rising. Only after gold retreats to the area near 3300, it is possible to build an A-B-C head and shoulders bottom structure at the technical level (as shown in the figure), which can also help gold build a complete and effective rising structure, so gold has the need to retreat to the area near 3300 to build a right shoulder structure.
Therefore, I think shorting gold is still the first choice for short-term trading at present; you can consider shorting gold in the 3335-3355 area, looking at the target area of 3320-3310-3300.

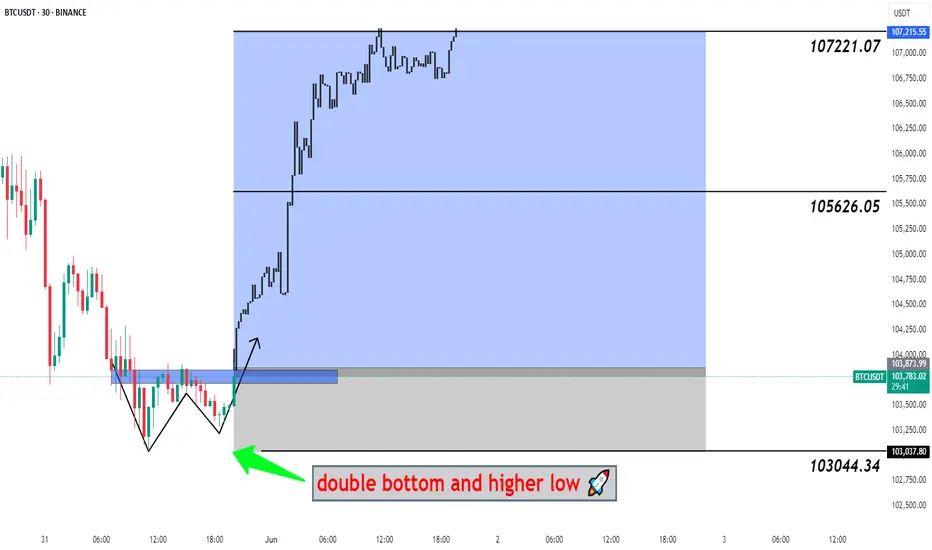
#BTCUSDT Big Pump Next Hour - Bitcoin, BTCUSD, BTCUSDT 📉 Double Bottom Pattern Forming – Potential Reversal Setup
The current price structure is showing signs of a Double Bottom – a classic bullish reversal pattern. After an extended downtrend, this pattern suggests that the market may be preparing for a trend reversal from this key demand zone.
🔹 Trade Setup
Entry, Targets, and Stop Loss (SL) are marked on the chart.
Entry: Upon breakout confirmation above the neckline.
Stop Loss: Just below the recent swing low to manage downside risk.
Targets: Calculated using the measured move method from the bottom to the neckline .
🔹 Risk & Money Management (Professional Approach)
To maintain consistent profitability and protect capital, strict risk management is essential. For this setup:
🔸 Position Sizing: Based on a fixed % of total capital (typically 1–2% of account equity per trade).
🔸 Risk-to-Reward Ratio: Minimum of 1:2, ideally higher.
🔸 Stop Loss Discipline: No arbitrary changes after entry. SL only adjusted for breakeven or trailing stops once price moves favorably.
🔸 Trade Management: Secure partial profits at key levels, trail stops as structure forms.
🔸 Capital Allocation: Avoid overexposure. Trade fits within overall portfolio strategy.
💬 Let the setup come to you. React, don’t predict.
🔁 Like, comment, or share your thoughts below!
BINANCE:BTCUSDT BITSTAMP:BTCUSD COINBASE:BTCUSD BINANCE:BTCUSDT.P INDEX:BTCUSD CRYPTOCAP:BTC.D CRYPTO:BTCUSD BYBIT:BTCUSDT.P BINANCE:BTCUSD
Trading Recommendations and Analysis for EUR/USDOn the weekly chart, the price is approaching the upper boundary of the price channel, around the 1.1822 mark, from which a reversal of the entire trend may occur.
A divergence with the Marlin oscillator is ready for immediate formation. If the price breaks above the channel line, it will most likely be a false false breakout, invalidating the channel. Only a weekly candle close above the specified level, accompanied by the oscillator rising above the previous peak, would significantly complicate the technical picture for a trend reversal.
On the daily chart, a possible target in the event of a breakout above 1.1822 is the 1.1905 level - the resistance from 1.1822 is the 1.1905 level - the resistance from July - August 2021. On the four - hour chart, the Marlin oscillator does not support the price's bullish momentum.
For now, the trend remains upward, but we are preparing for a possible shift. The Nonfarm Payrolls, Independence Day, and "Liberation Day" (new tariffs) are just around the corner. Donald Trump may have a surprise in store.

USDJPY: Strong Bullish Price Action 🇺🇸🇯🇵
I see 2 strong bullish confirmation on USDJPY after a test of a key daily
support cluster.
The price violated a trend line of a falling channel and a neckline of
an inverted head & shoulders pattern with one single strong bullish candle.
The pair may rise more and reach 144.45 level soon.
❤️Please, support my work with like, thank you!❤️
I am part of Trade Nation's Influencer program and receive a monthly fee for using their TradingView charts in my analysis.

USDJPY: Pullback From SupportI believe that 📈USDJPY could bounce up from the highlighted intraday support.
I see 2 bullish breakout confirmations:
bullish breakouts of a neckline of a cup and handle pattern and a resistance line of a falling wedge pattern.
Goal - 144.67

Sideways ChannelLooks like today we have bounced off the midpoint of this channel. Yesterday we dropped, today we rise!
Overall, this looks like a very neutral position. Potential for a short gain here up to previous highs with a bounce back down to lows.
No one can predict how long we will stay in this channel, but the breakout or breakdown will be very bold and very loud in one direction.
As a trend trader, I am looking to a breakup potential right now. If I had to be in a position, it would be long.

GOLD (XAUUSD): Classic Trend-Following Pattern⚠️Gold closed on Tuesday, forming a bullish flag pattern on an hourly chart, indicating a market correction following a strong upward wave.
A breakout above the resistance line with a candle close will likely signal a continuation of the trend, with a high probability of the price rising to at least a new higher high.
However, keep in mind that the price may respect the trend line multiple times and corrections could be prolonged, which is why we depend on a reliable breakout as a trigger.

BTC/USDT Technical Analysis, 2025-07-01 19:30 UTCA bullish trade opportunity was identified after price action formed a Piercing Line candlestick pattern, signaling a potential reversal from recent lows.
🔹 Technical Overview:
Entry Price: 105,869.86 USDT
Take Profit (TP): 106,939.86 USDT
Stop Loss (SL): 104,669.86 USDT
200 EMA: 106,320.49 USDT (Price is trading below — potential dip-buy opportunity)
Pattern Detected: Piercing Line (bullish reversal)
🔹 Volume Context:
Recent candles showed moderate volume with signs of buyer interest increasing.
OBV trend has turned slightly positive, supporting a short-term bullish case.
🔹 Order Flow:
Price action is showing signs of recovery from a local support zone.
Some imbalance in the order book tilted toward buyers, with supportive bid liquidity observed.
This setup combines trend deviation, bullish price action, and support reaction, creating a favorable risk-to-reward scenario. Trade is now active and being monitored toward the defined TP level, with strict stop-loss protection in place.

The idea is clear, gold falls as expected!The gold market is just as I predicted. I have repeatedly warned everyone not to chase the 3350-3355 line. The technical side needs to step back. Now, it just proves the idea I gave. After gold hit the highest line of 3358, it stepped back to the 3337 line and started to fluctuate. Our 3355 short order plan successfully touched 3340 to stop profit and exit. From the current gold trend, it should fluctuate like this before closing. After the opening, we will step back and go long as planned. Focus on the 3330-3335 line below. If it does not break, we can consider going long.
From the current gold trend analysis, pay attention to the 3360-3370 line of pressure on the top, and the short-term support on the bottom is around 3330-3335. Focus on the key support at 3315-3325. Relying on this range as a whole, maintain the main tone of low-long participation unchanged, wait for the pullback to confirm the support and then intervene when the opportunity arises. In the middle position, keep watching and do less, chase orders cautiously, and wait for the entry opportunity after the key points are in place.
Gold operation suggestion: go long around 3315-3325, target 3340-3350.

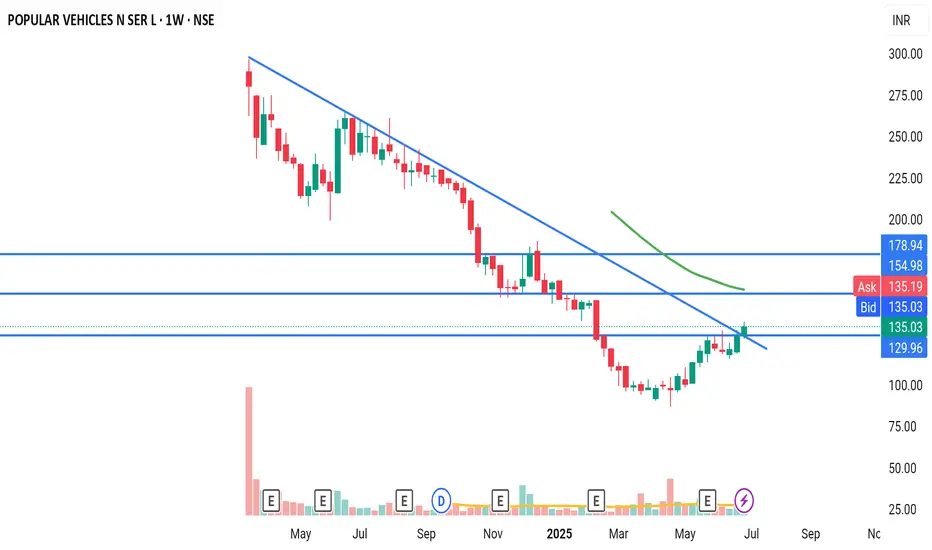
PVSLStrong upmove expected from CMP. Breakout of Cup and Handle pattern in daily timeframe, crossed trendline in daily and weekly timeframe.
PIVXUSDT Holding Key Support Within Falling WedgePIVXUSDT continues its descent within a falling wedge structure, currently stabilizing above a key support zone. Price is now poised to retest the Immediate Internal Resistance Level.
A breakout above this level could trigger a reversal, while rejection may lead to a new low toward the strong accumulation zone a potential high-probability buy area. Targets toward the projected final upside are highlighted on the chart.
Monitor closely for confirmation at the resistance level to define the next move recommended.

Trading The 3 Step Rocket Booster StrategyTrading within a certain time frame has shown me that its better to set a time stop limit.
This time stop limit tells you when to stop trading your entry.
-
Now does this work? am not sure but i will try anything
that will produce results.
-
Right now am focusing on short term trading strategies.The main aim is to enter on 4 hour time frames.
-
Am hoping that this will increase my trading skills.Either way my focuss is on learning how to trade better setups.
-
Key Point:Dont stop journal-ling your trades on trading-view community.
-
Now on this entry am looking at a rising volume from the bottom of the market.
-
Also we are looking at the rocket booster strategy:
-
It has the following steps:
-
-The price has to be above the 50 EMA
-The price has to be above the 200 EMA
-The price has to gap up.
-
This strategy has become so popular its shocking.Because when i began teaching...
-
it it was not as popular.
-
I call it the 3-Step Rocket Booster Strategy
If you want to learn more about how to find
stocks such as NYSE:KO
-
Rocket boost this content to learn more.
-
Disclaimer:Trading is risky please learn risk management and profit taking strategies.Also do not use margin trading.And use a simulation trading account before you trade with real money.
